Qdrant Dashboard
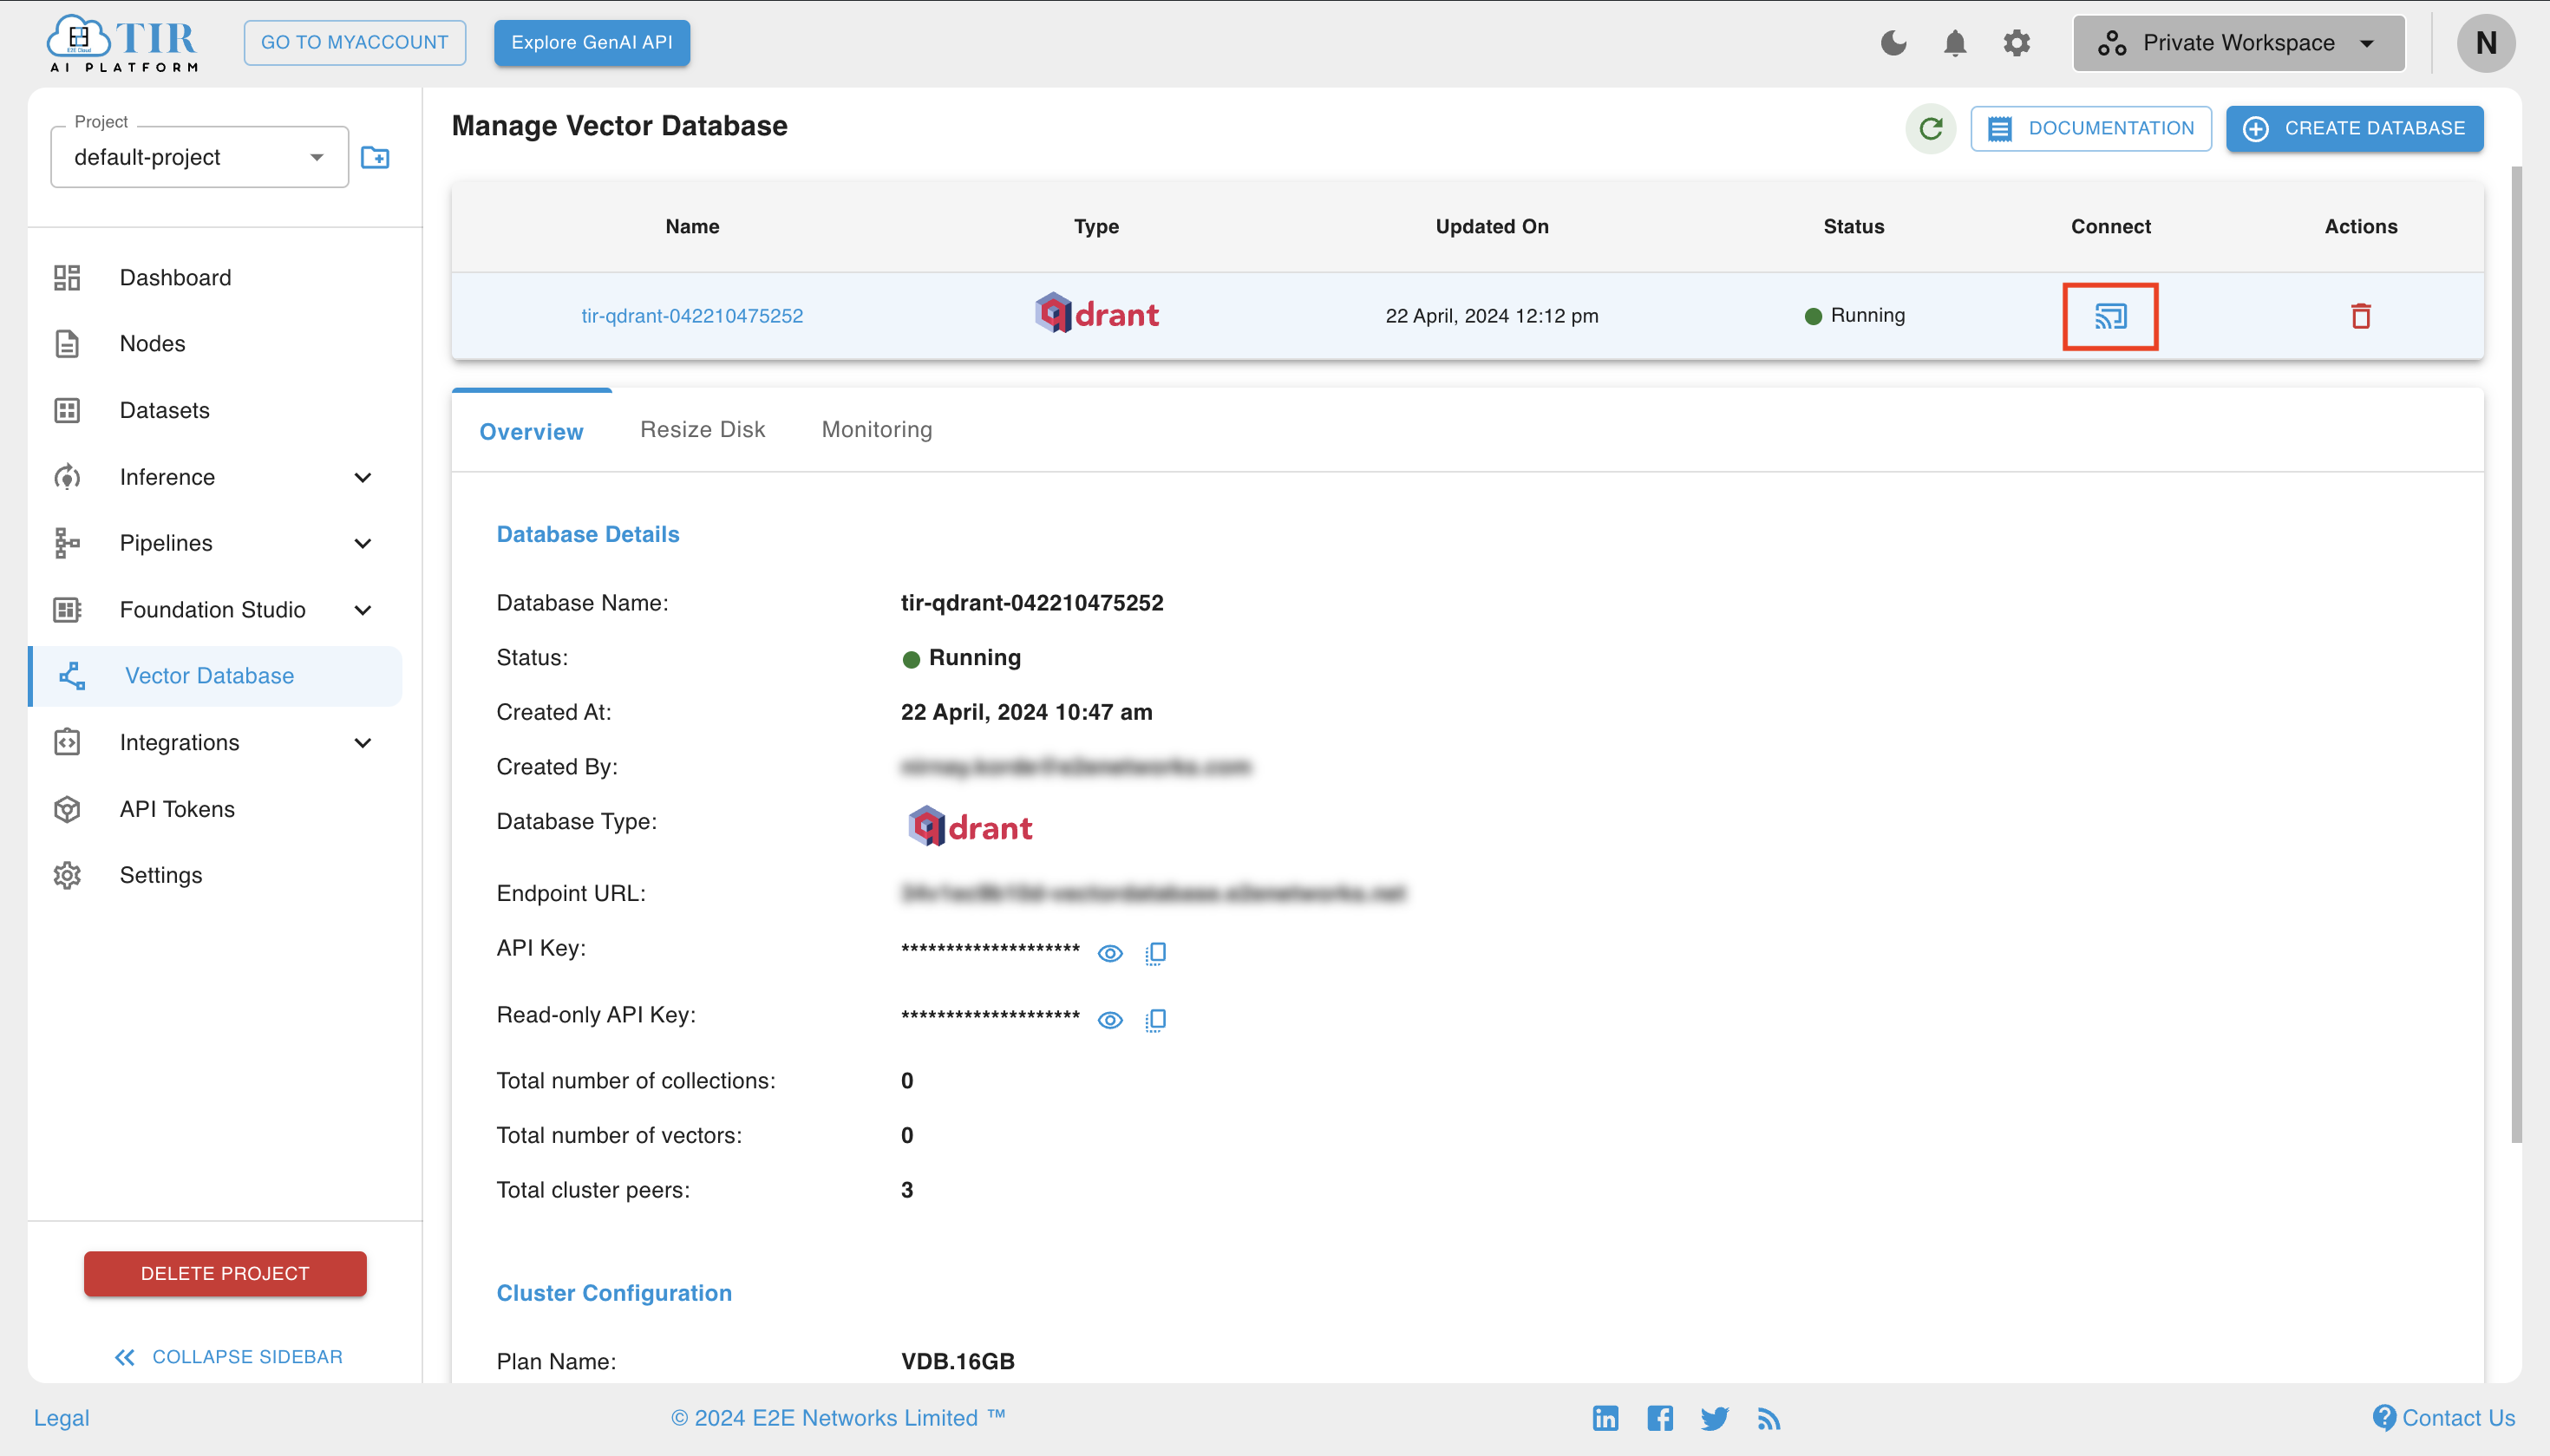
Qdrant provides its own Dashboard to interact with the data and the collections. We can access the dashboard by clicking the Connect button in the Manage Vector Database page on TIR.
Dashboard Landing Page
- When you visit the dashboard URL for the first time, you will see the following landing page.
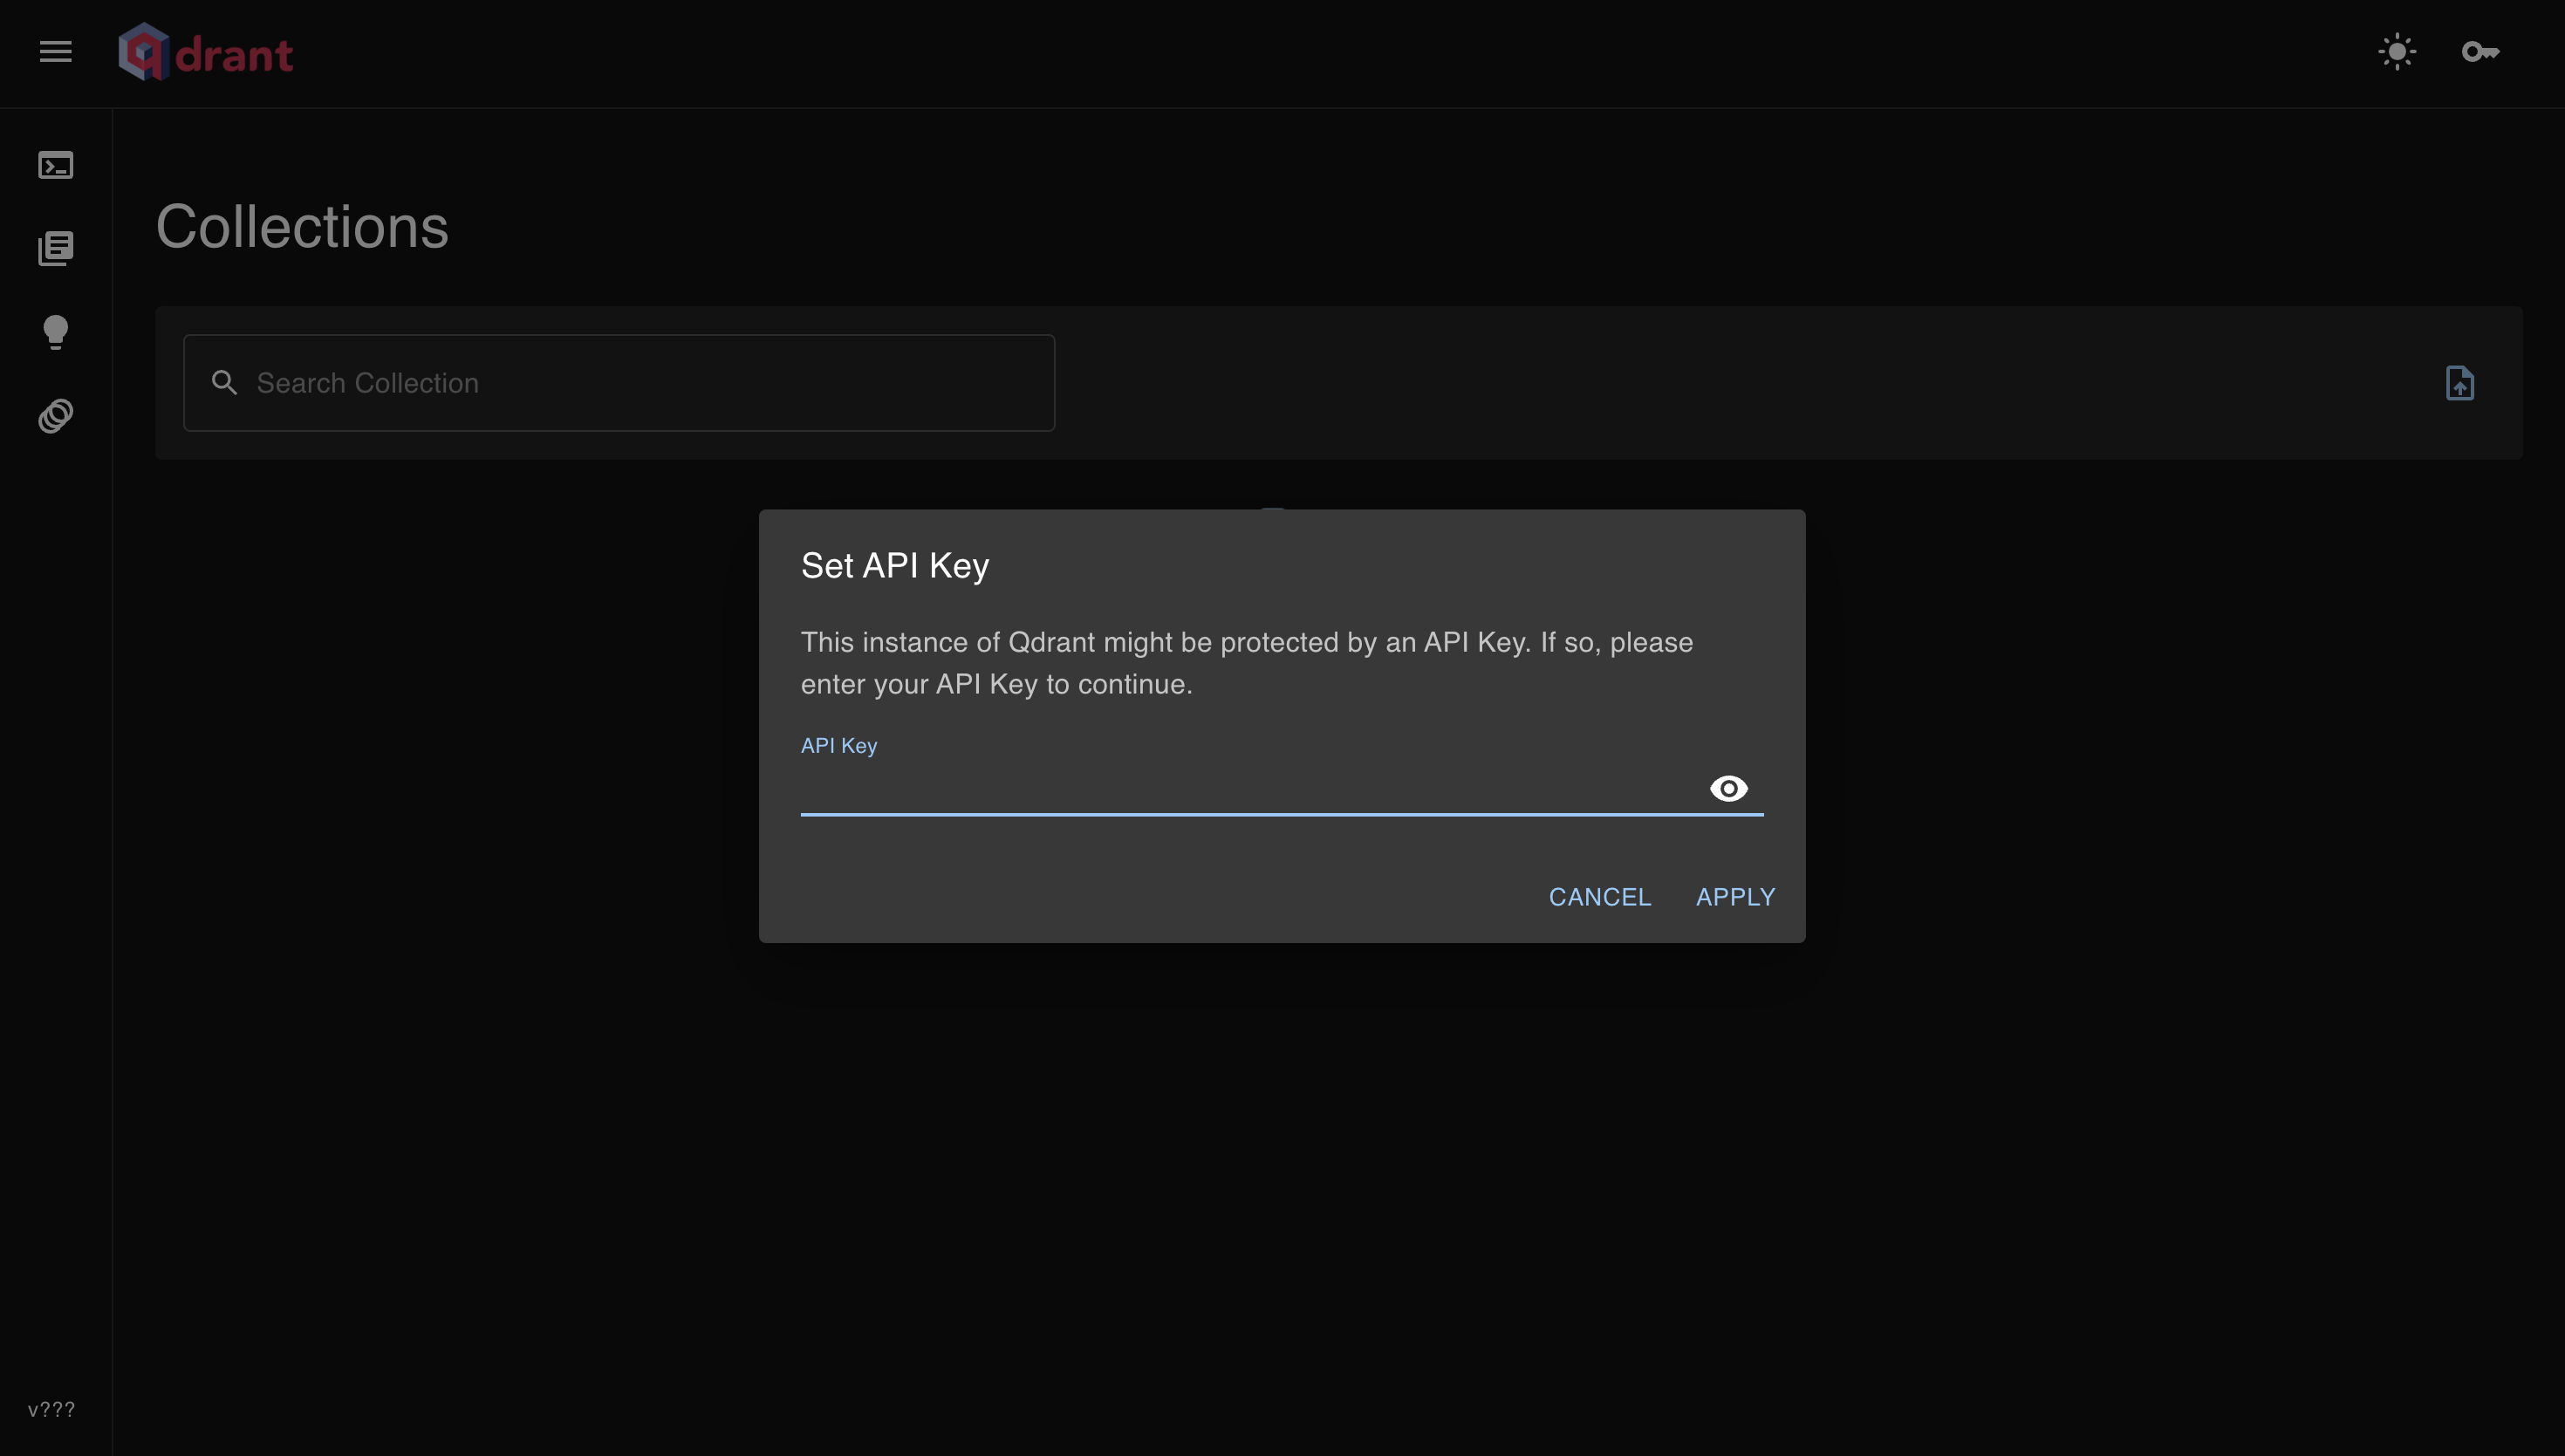
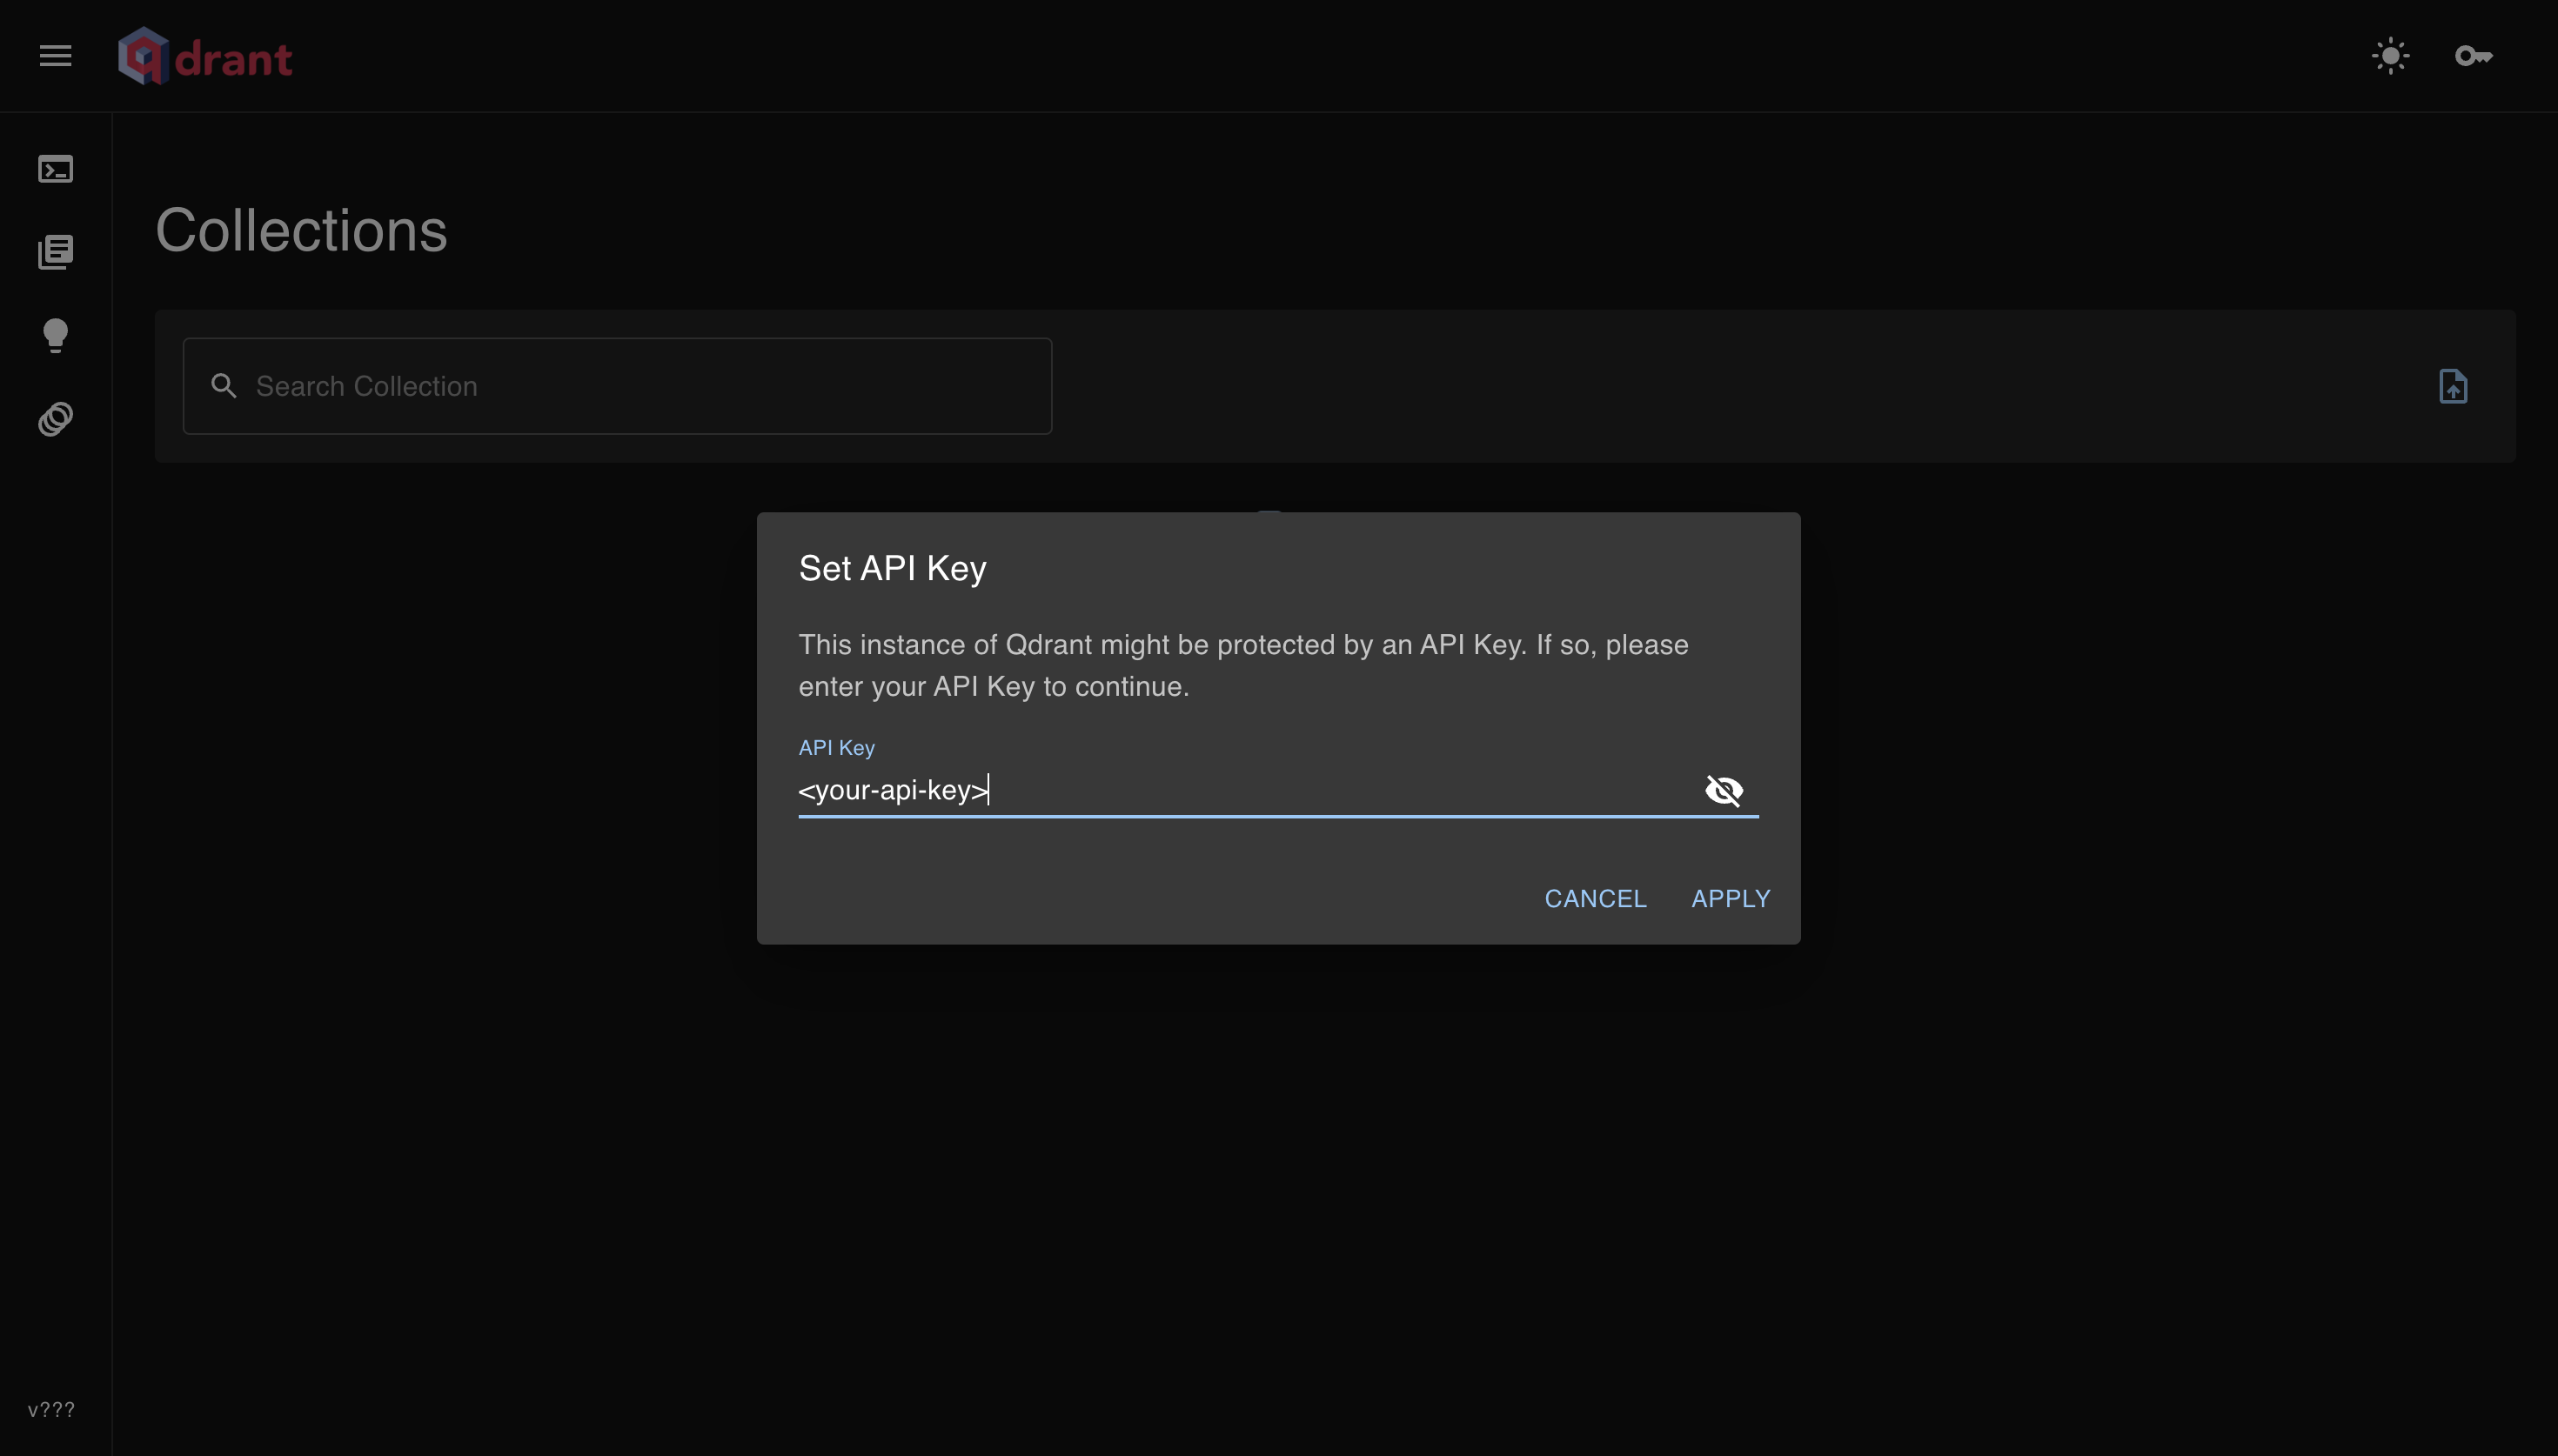
- To access the dashboard, we need to enter the API-Key in the input field and click on the "Apply" button.
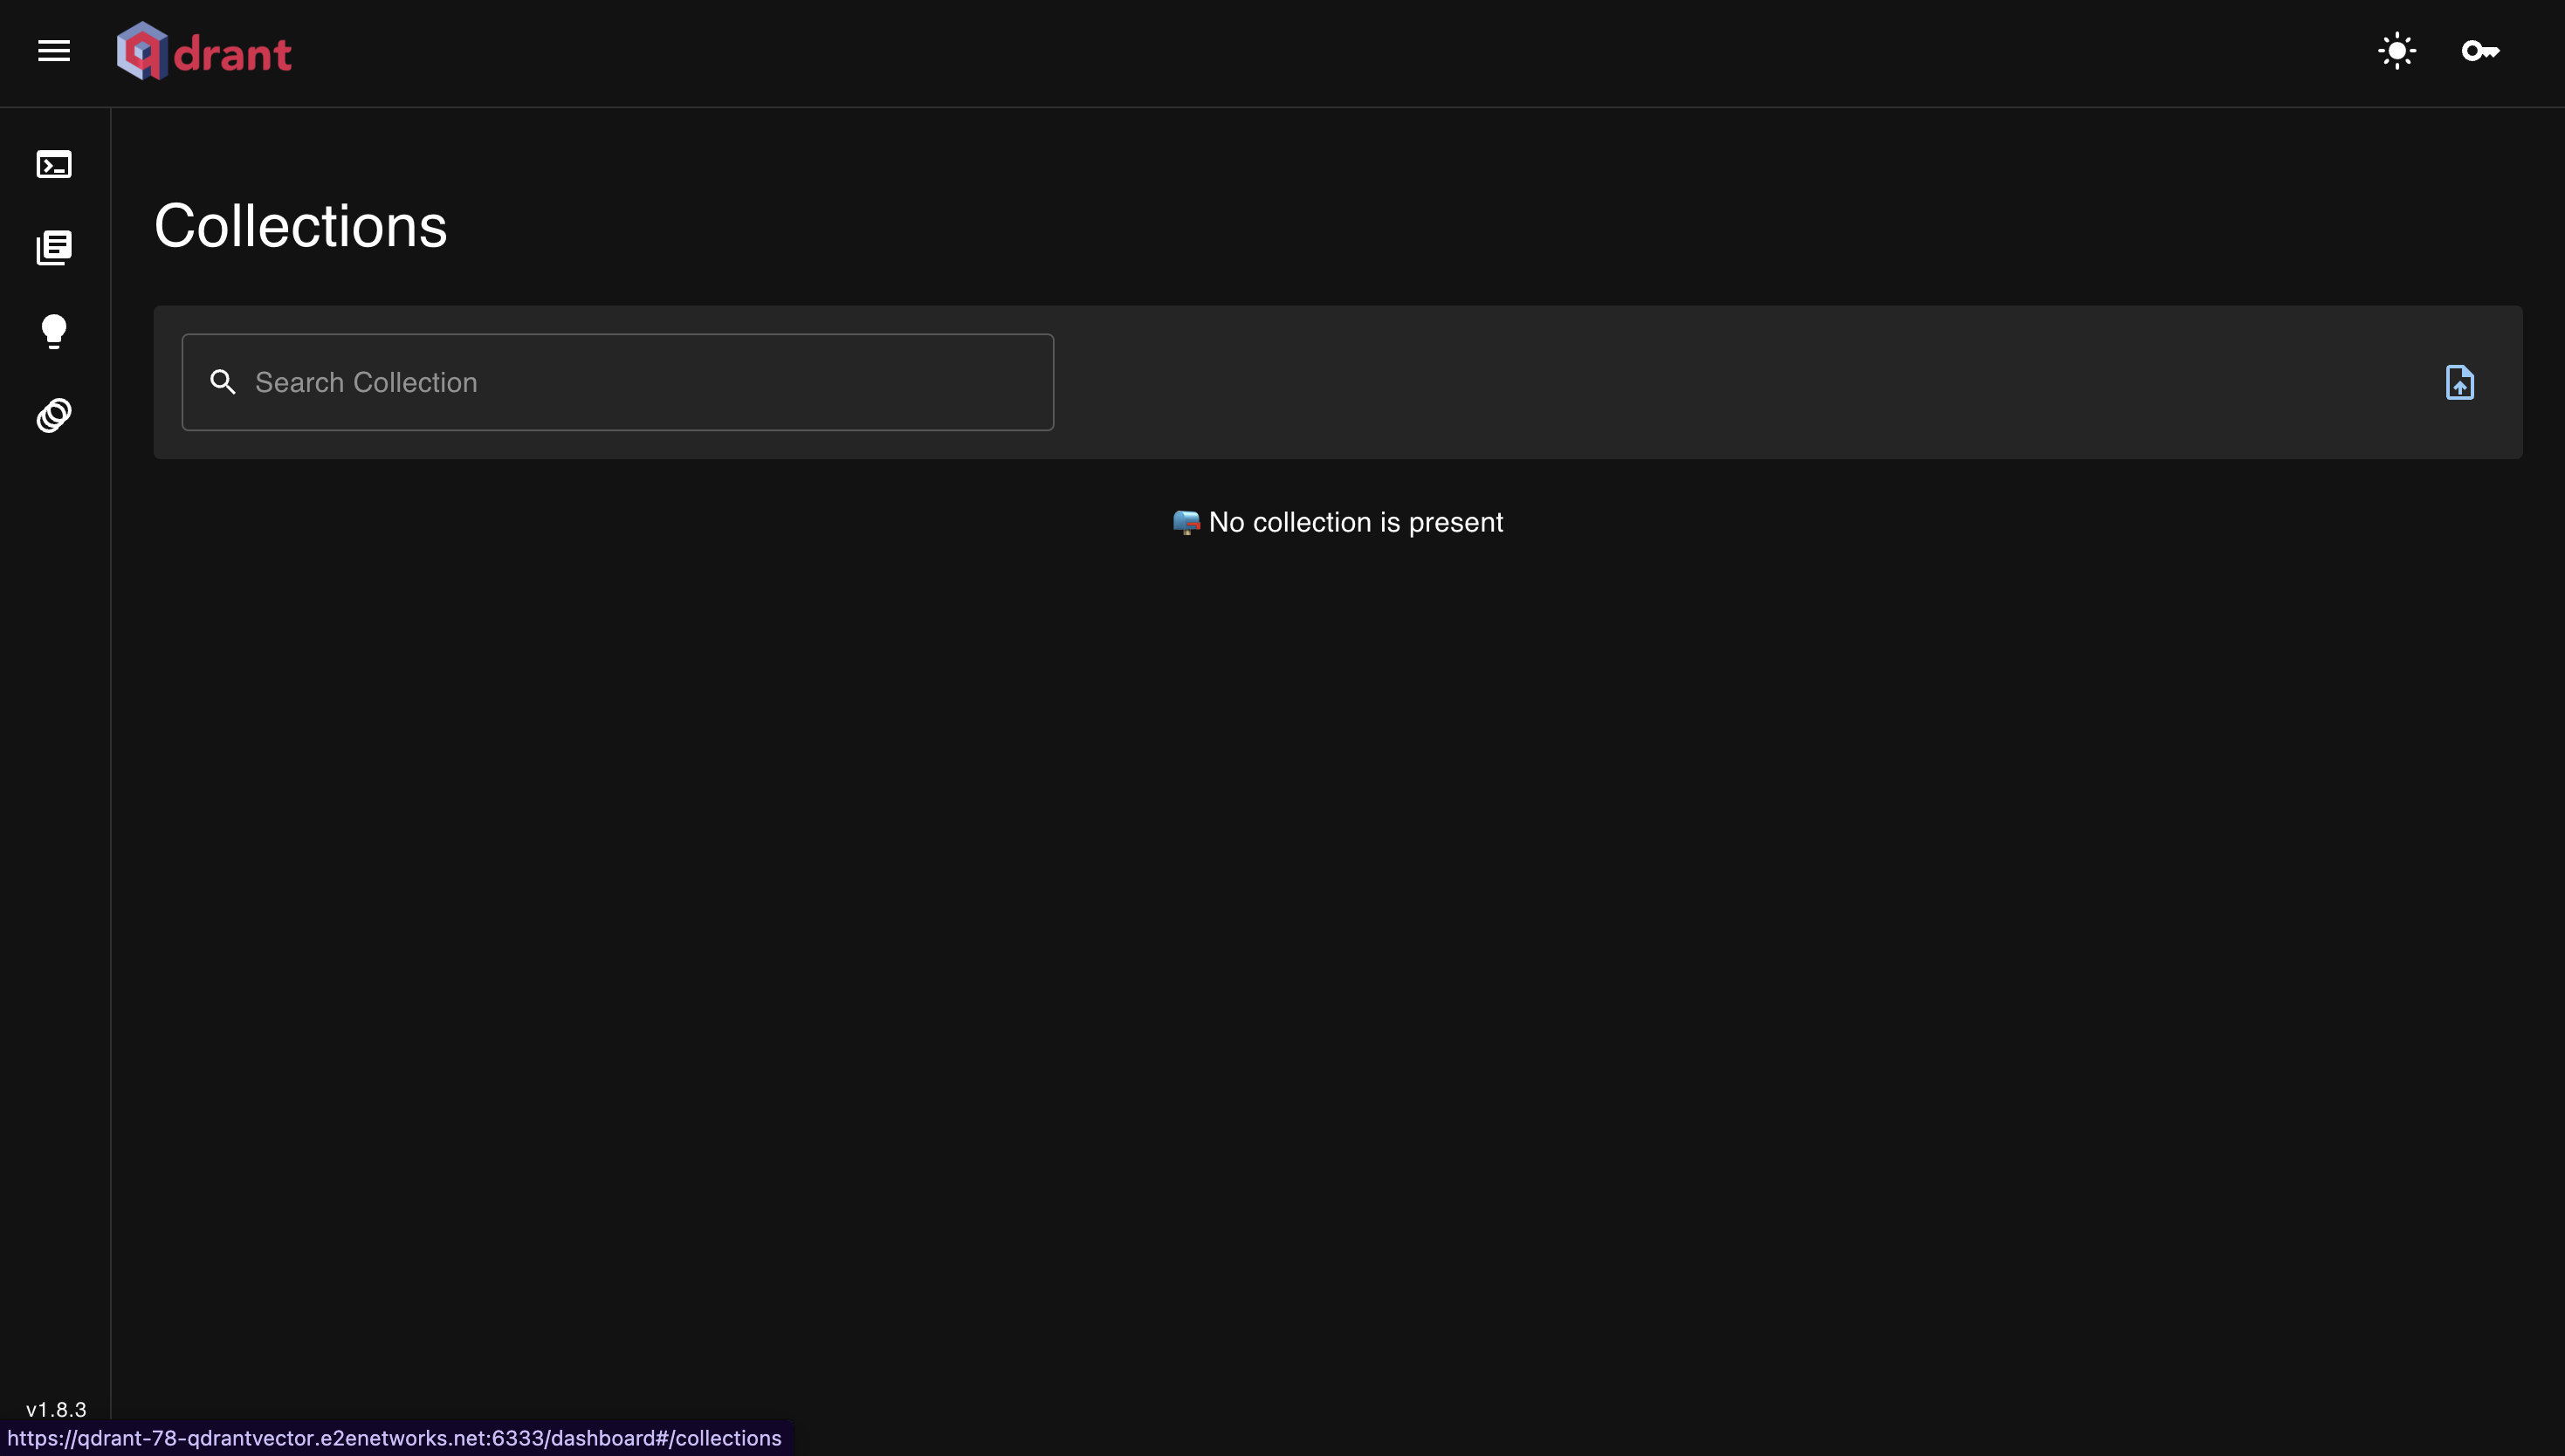
- Once authentication is complete, we land on the collections page.
Overview of the Dashboard
The dashboard consists of the following sections:
- Collections
- Console
- Tutorial
- Datasets
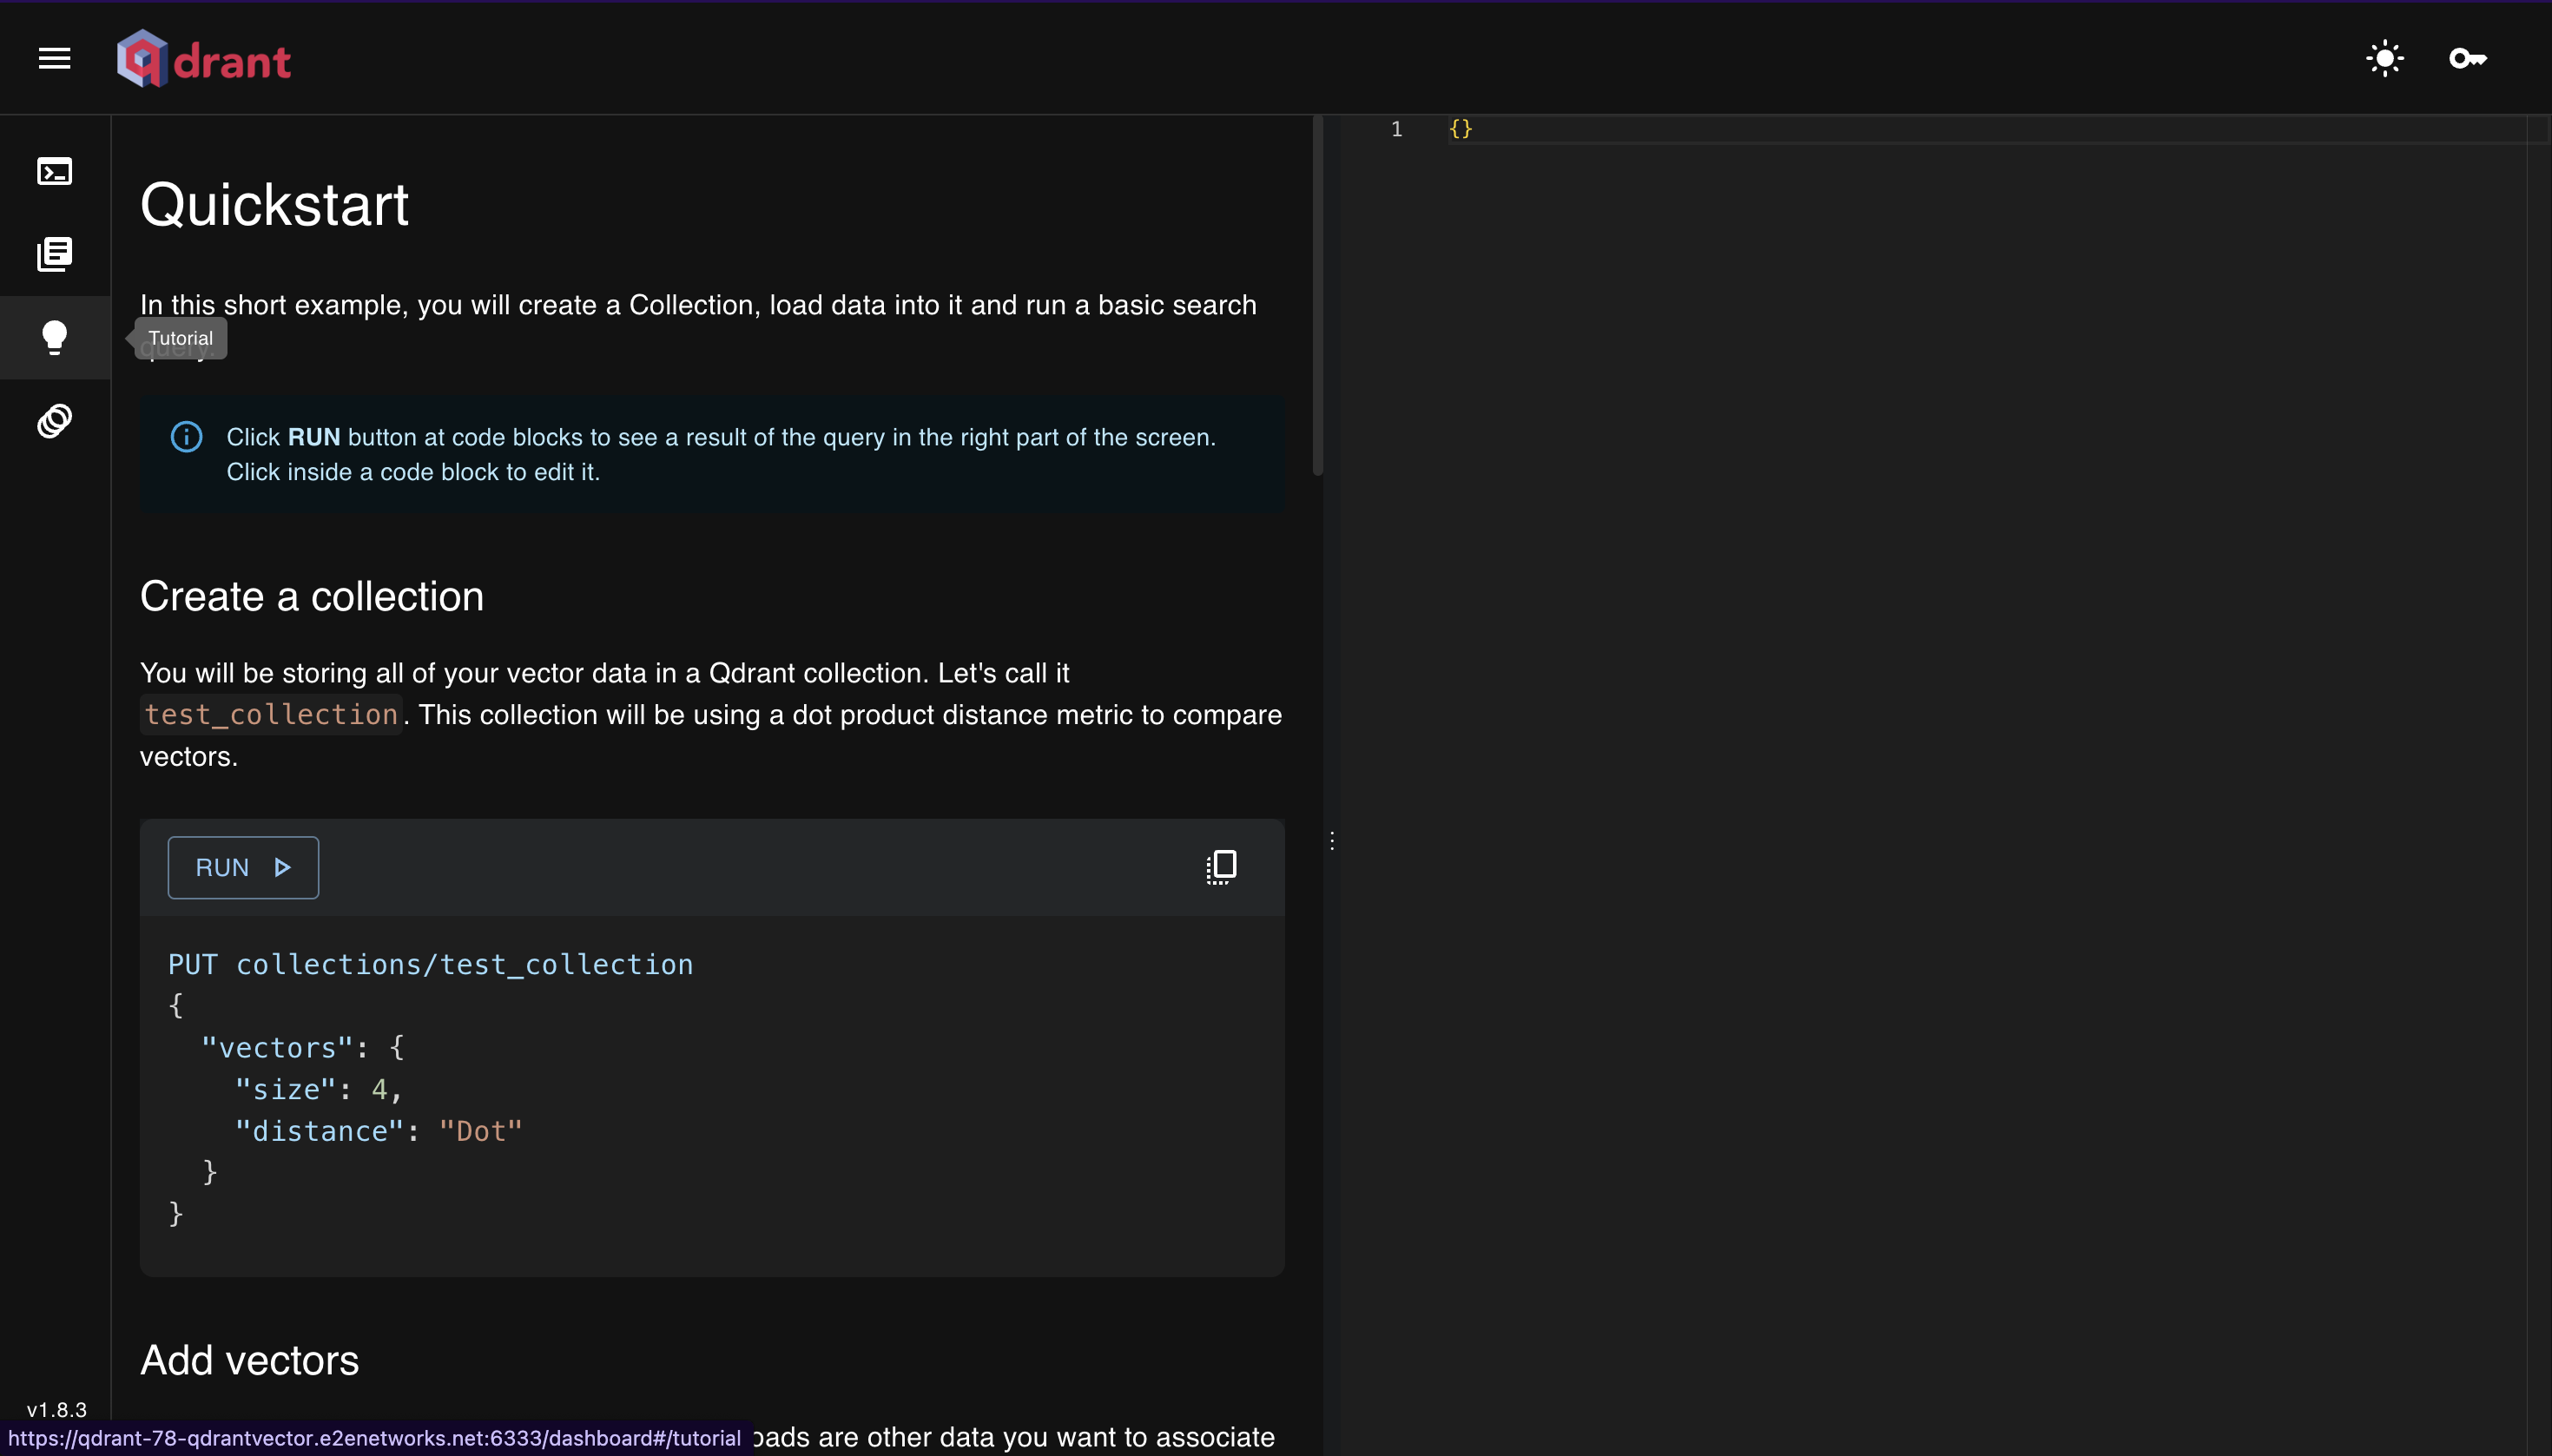
Tutorial Section
- Qdrant has its own tutorial page where you can interact with the API and learn how they work.
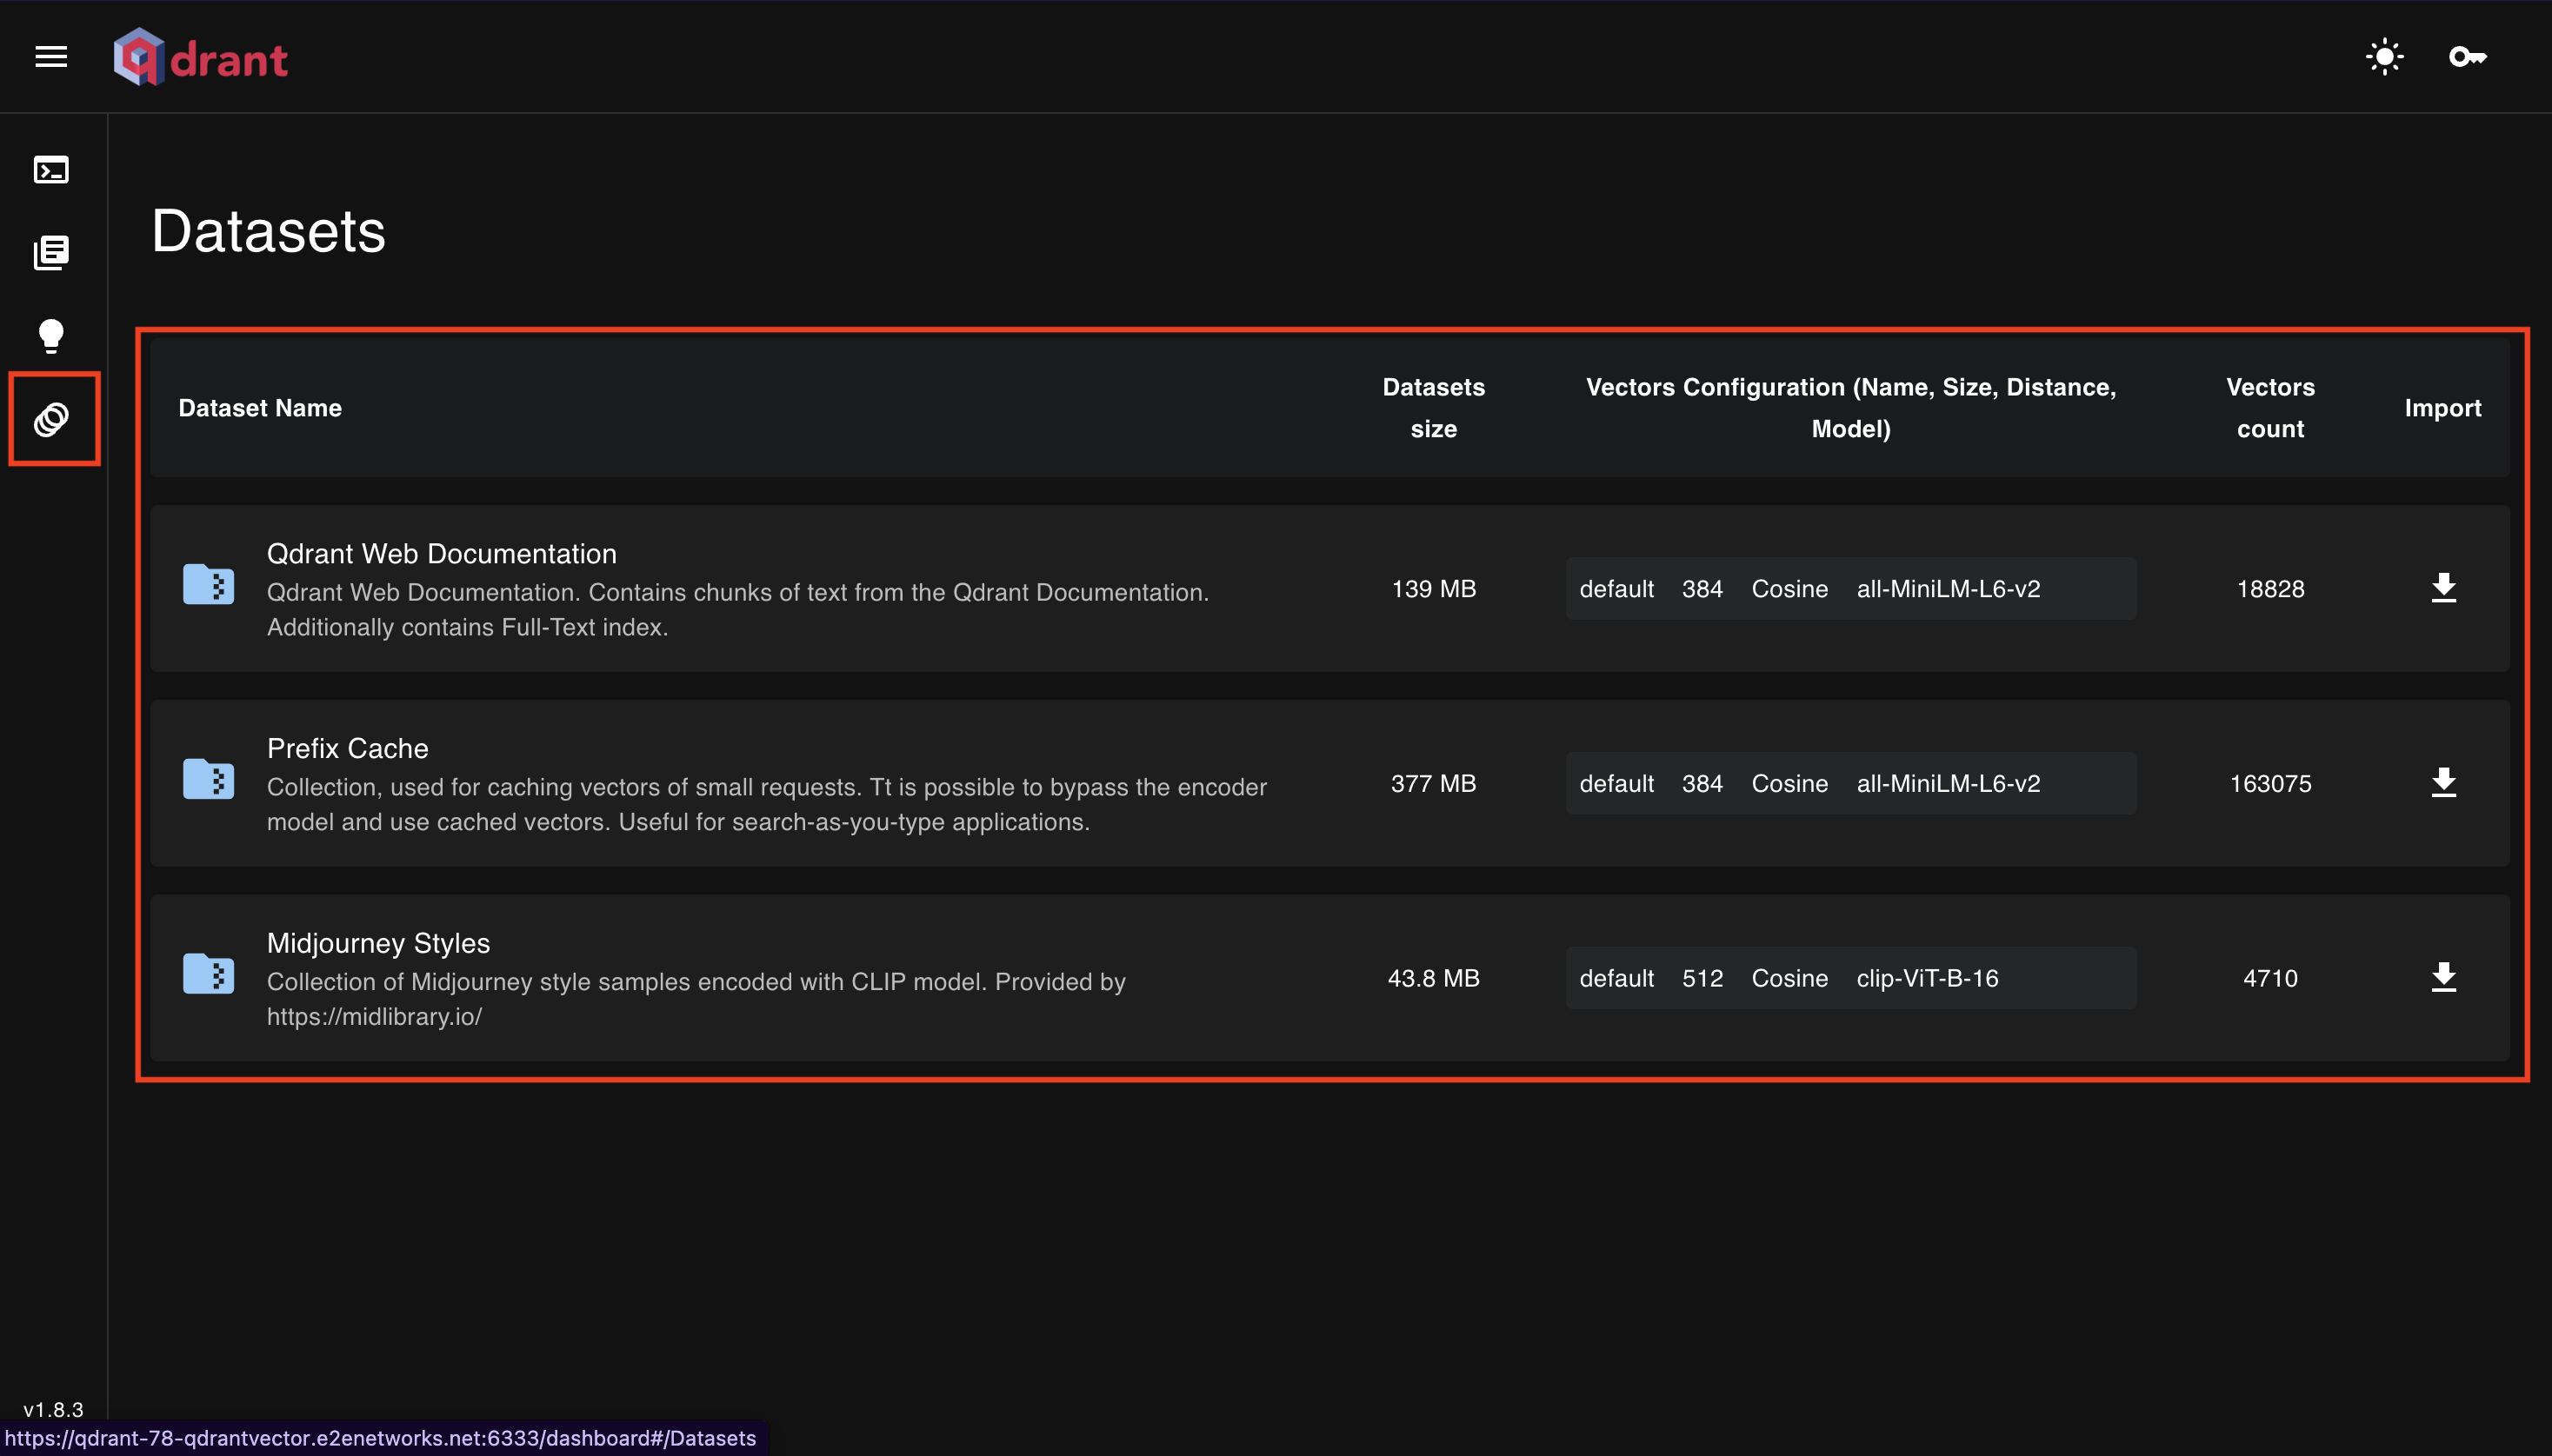
Dataset Section
- Qdrant provides some dummy data to play around with the dashboard.
Console Section
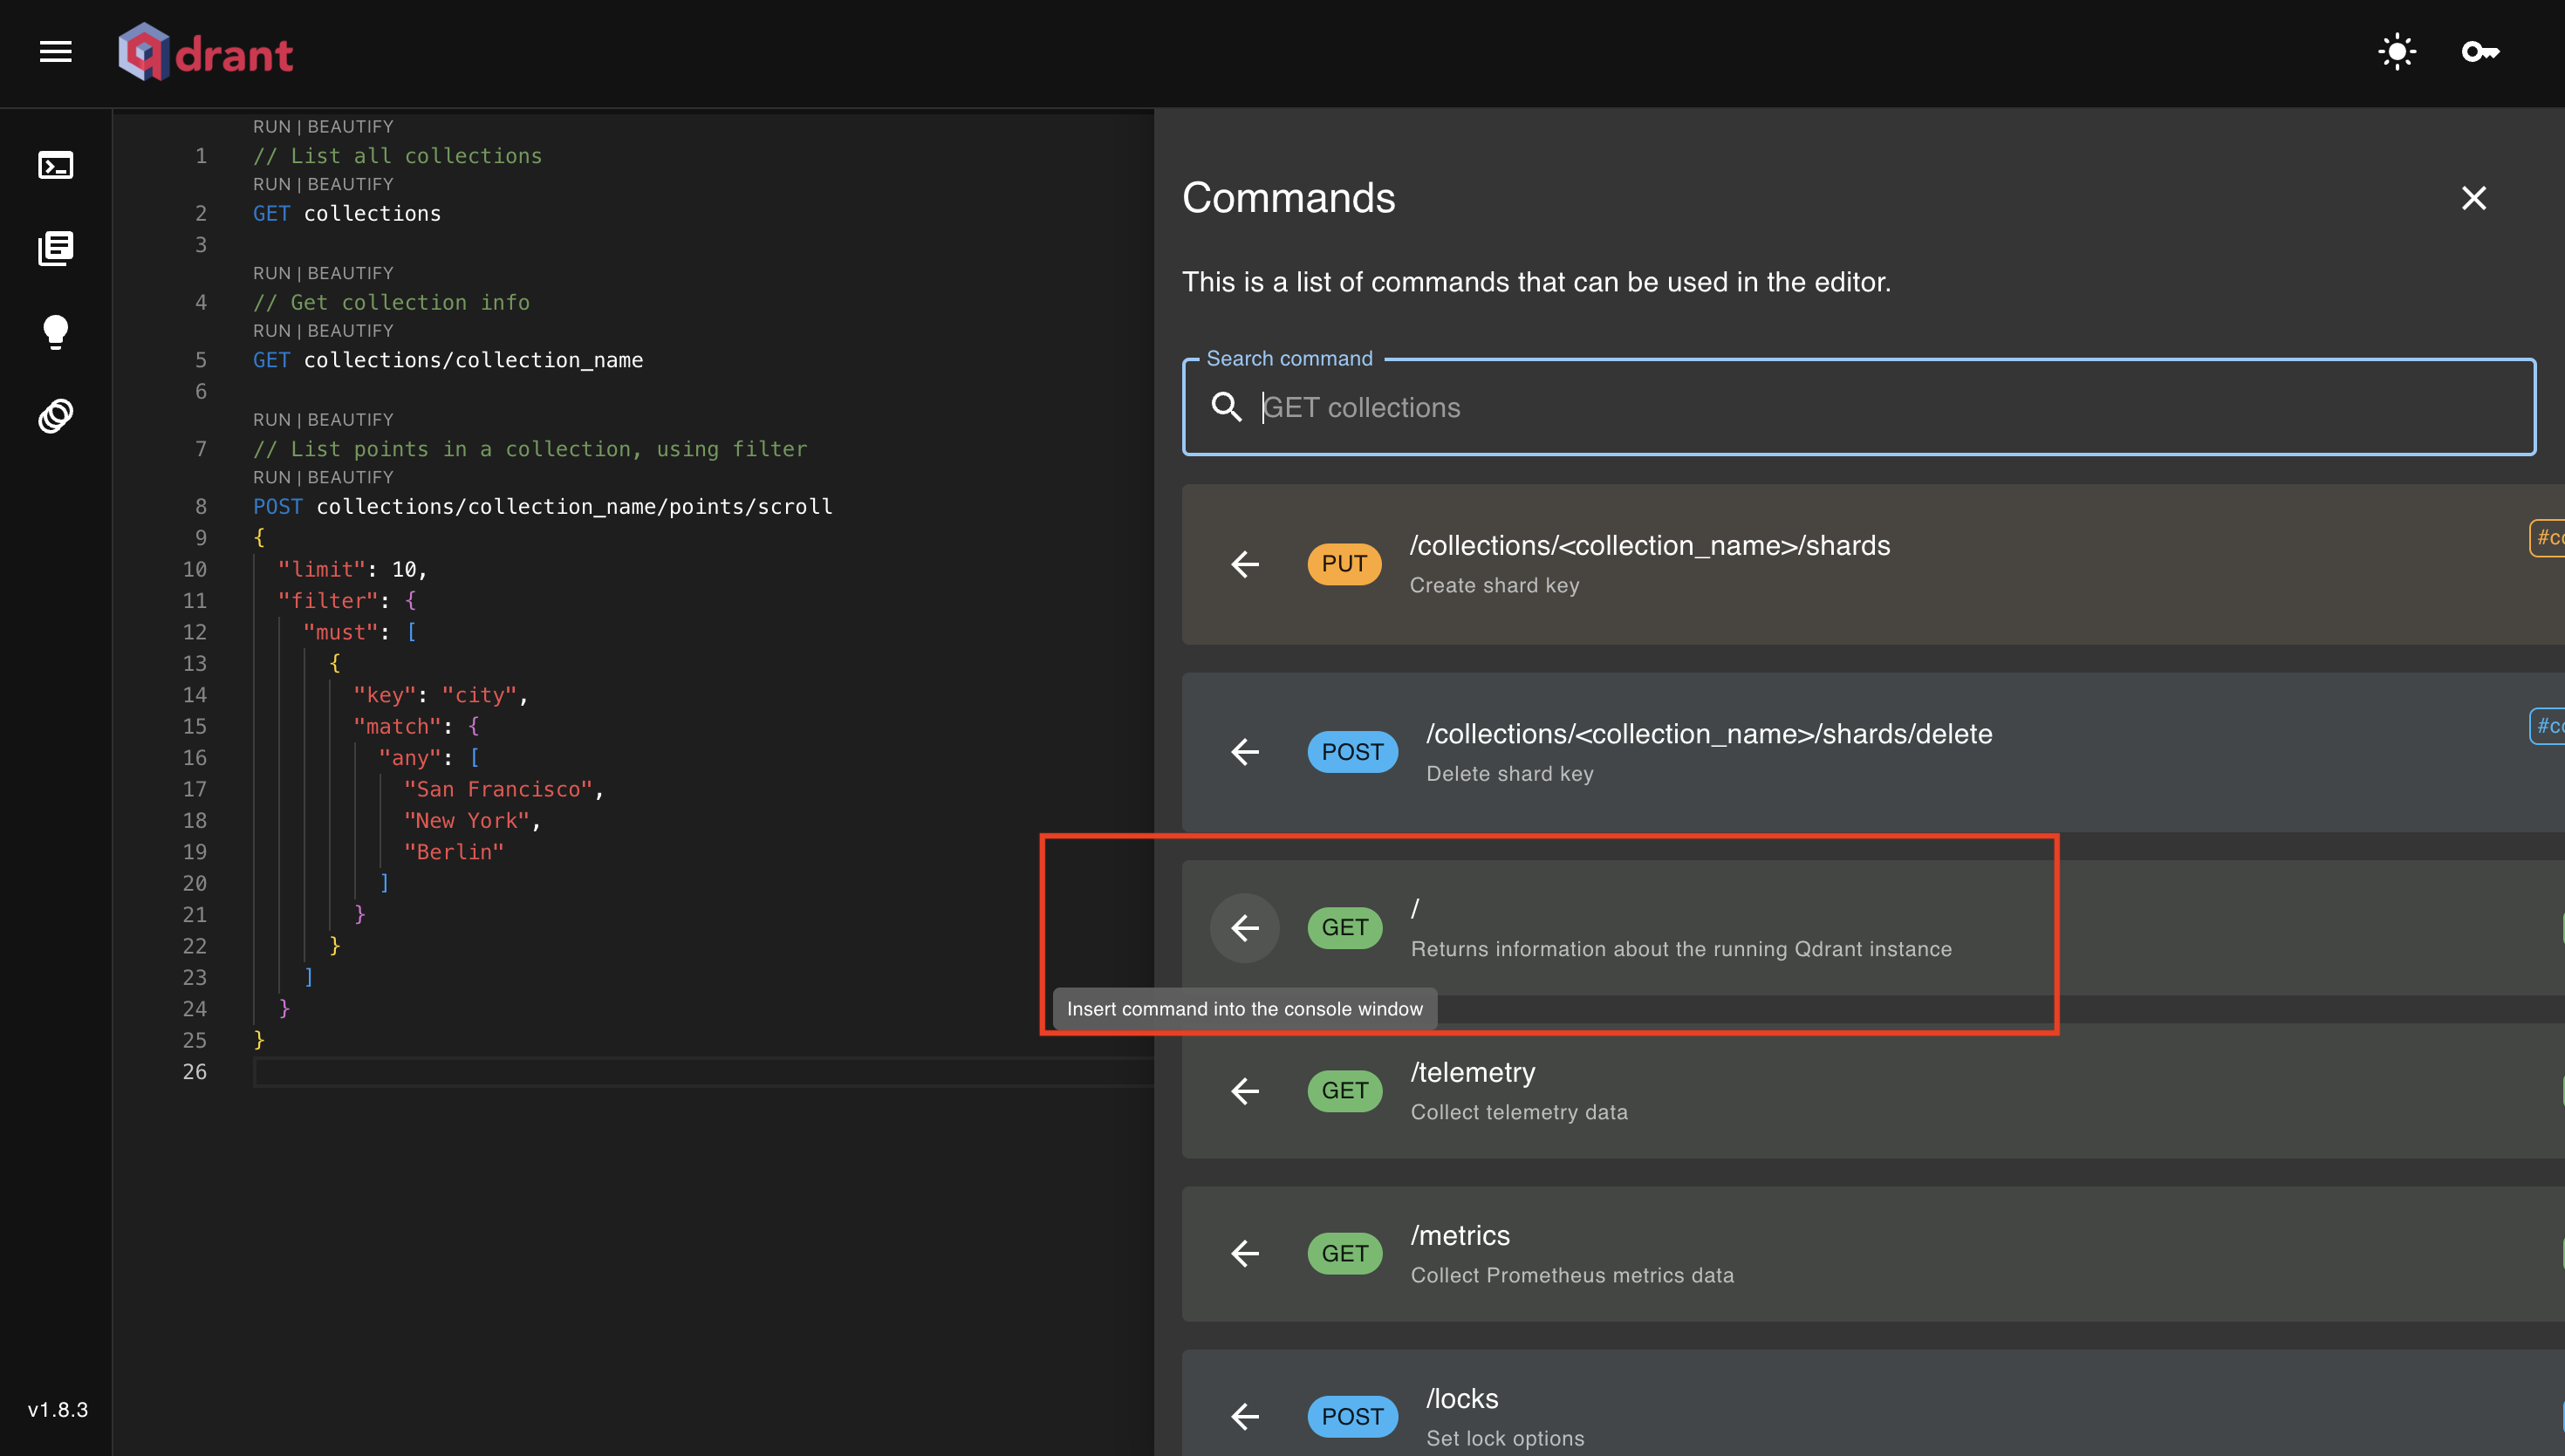
- The console section is used to interact with the Qdrant API.
- We can execute the API commands in the console section.
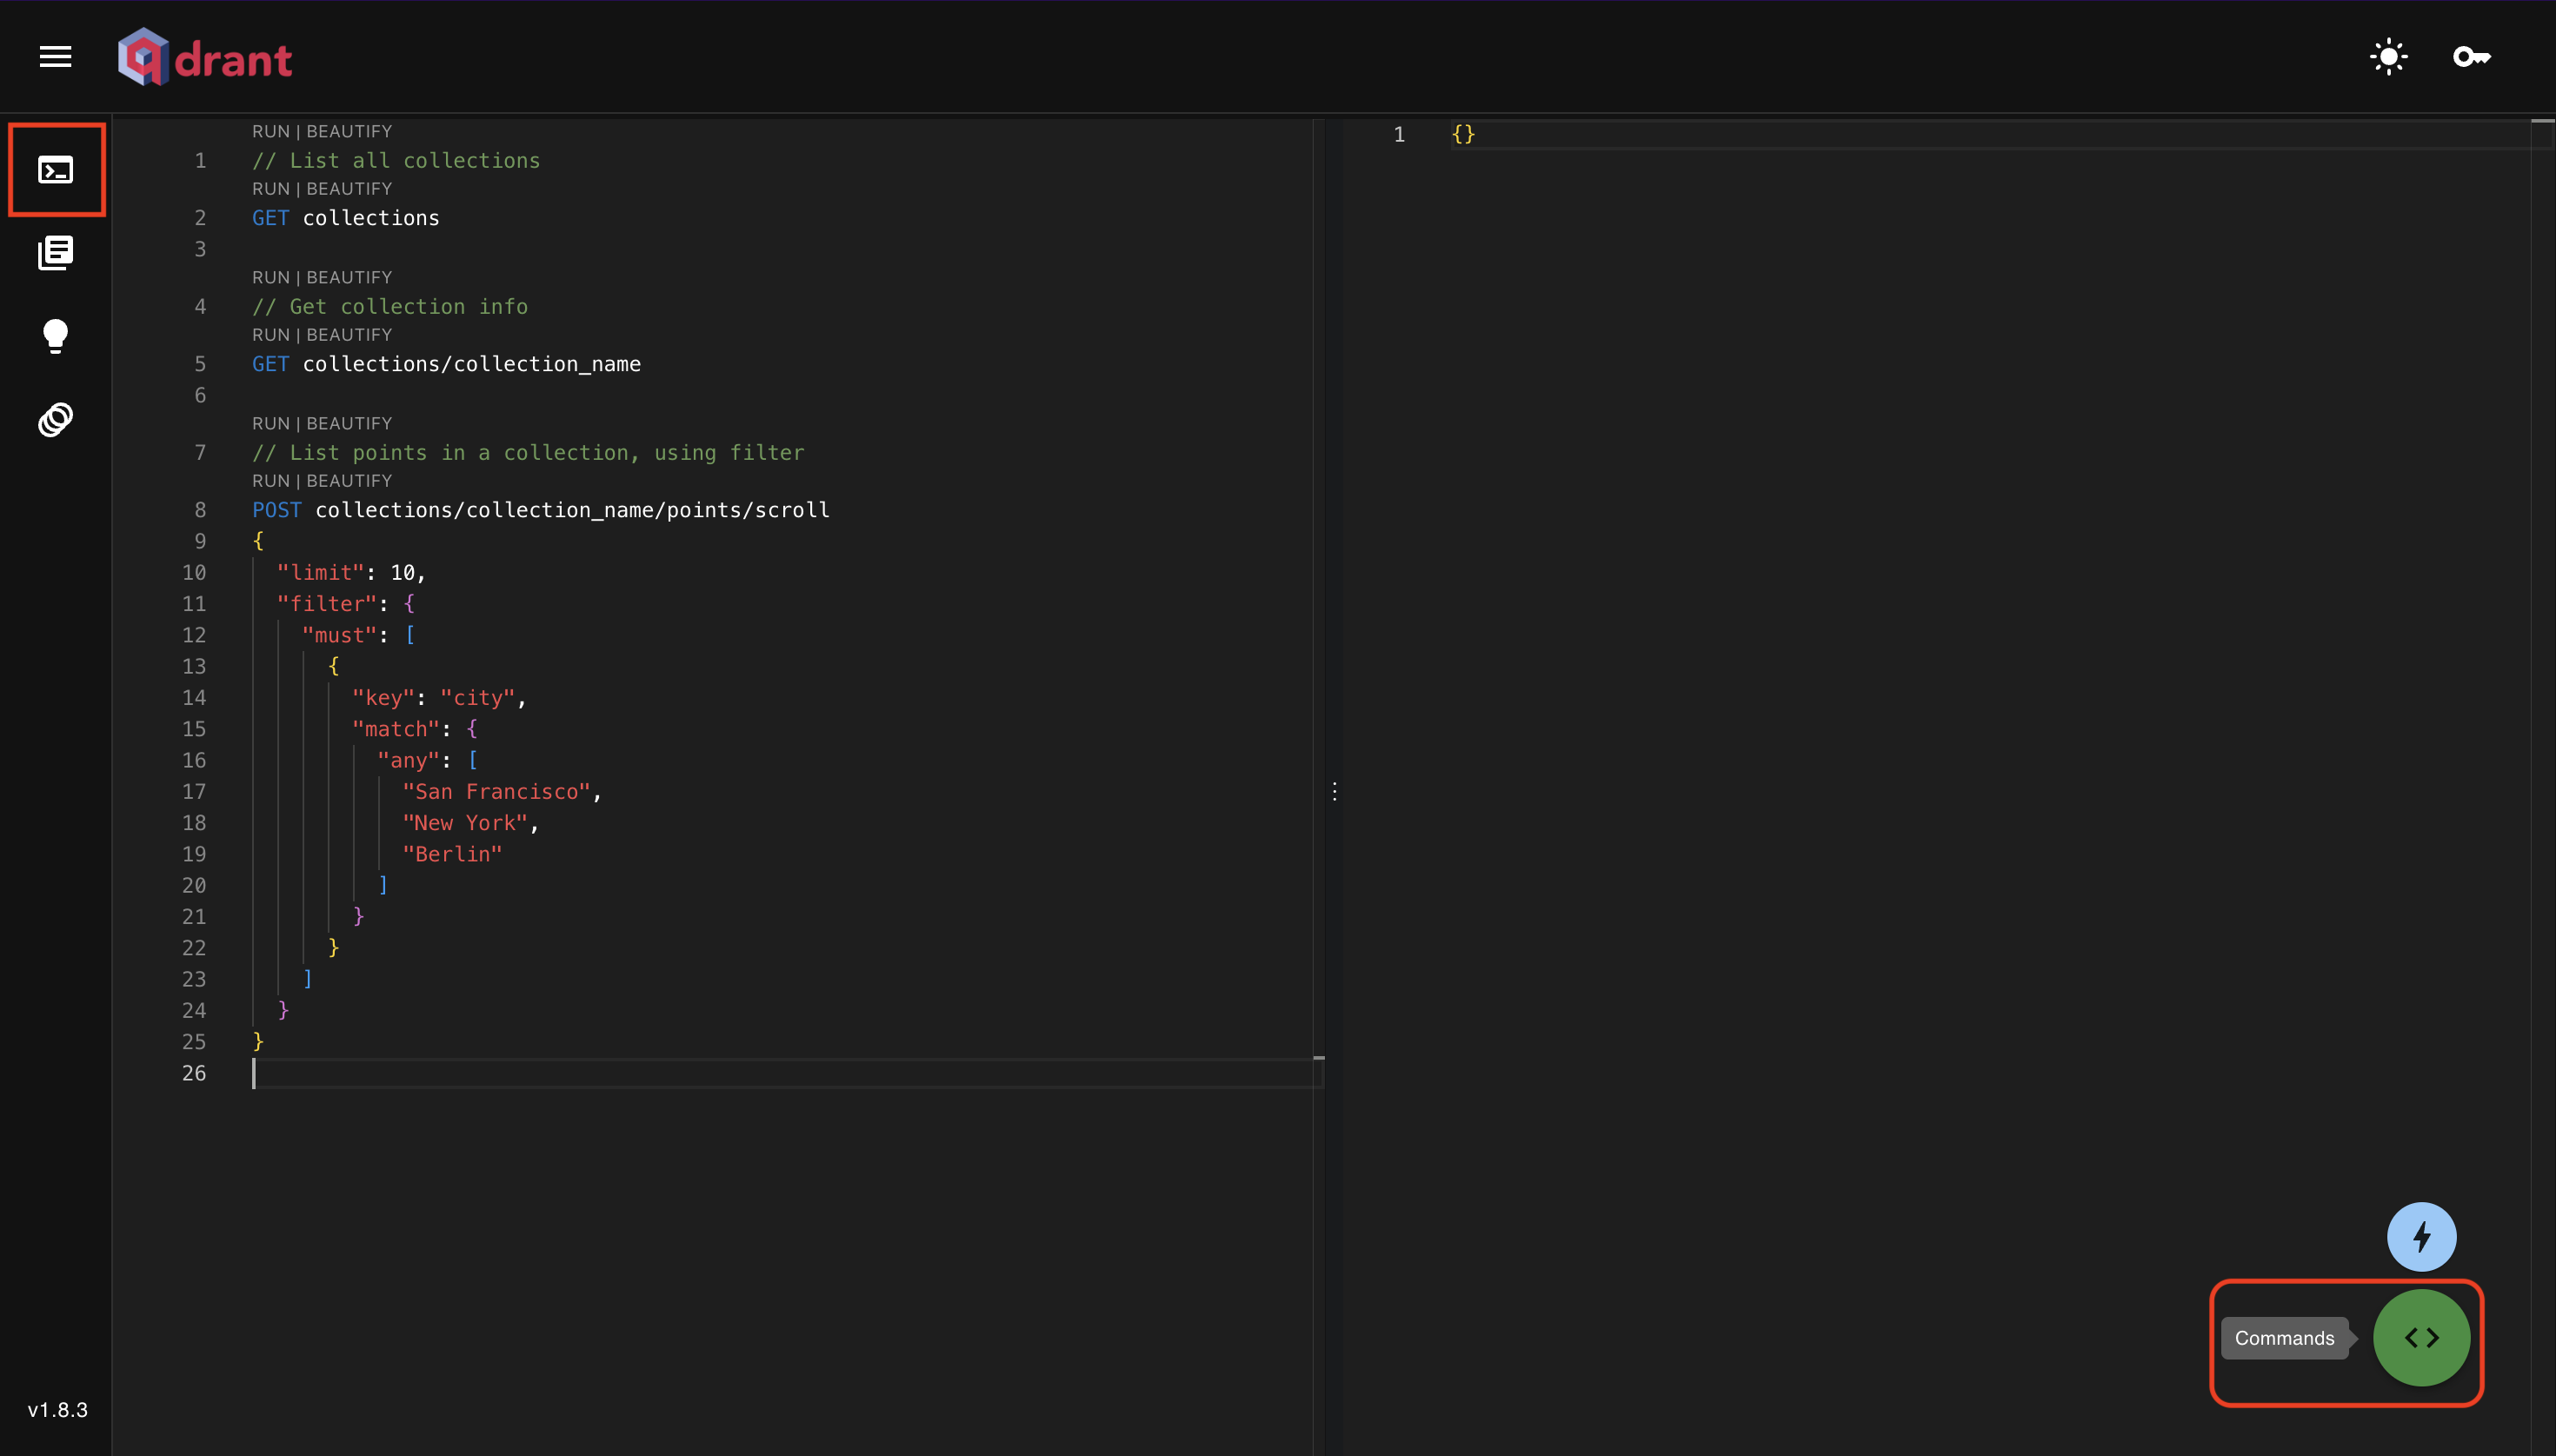
- Qdrant provides all the API commands in the console section.
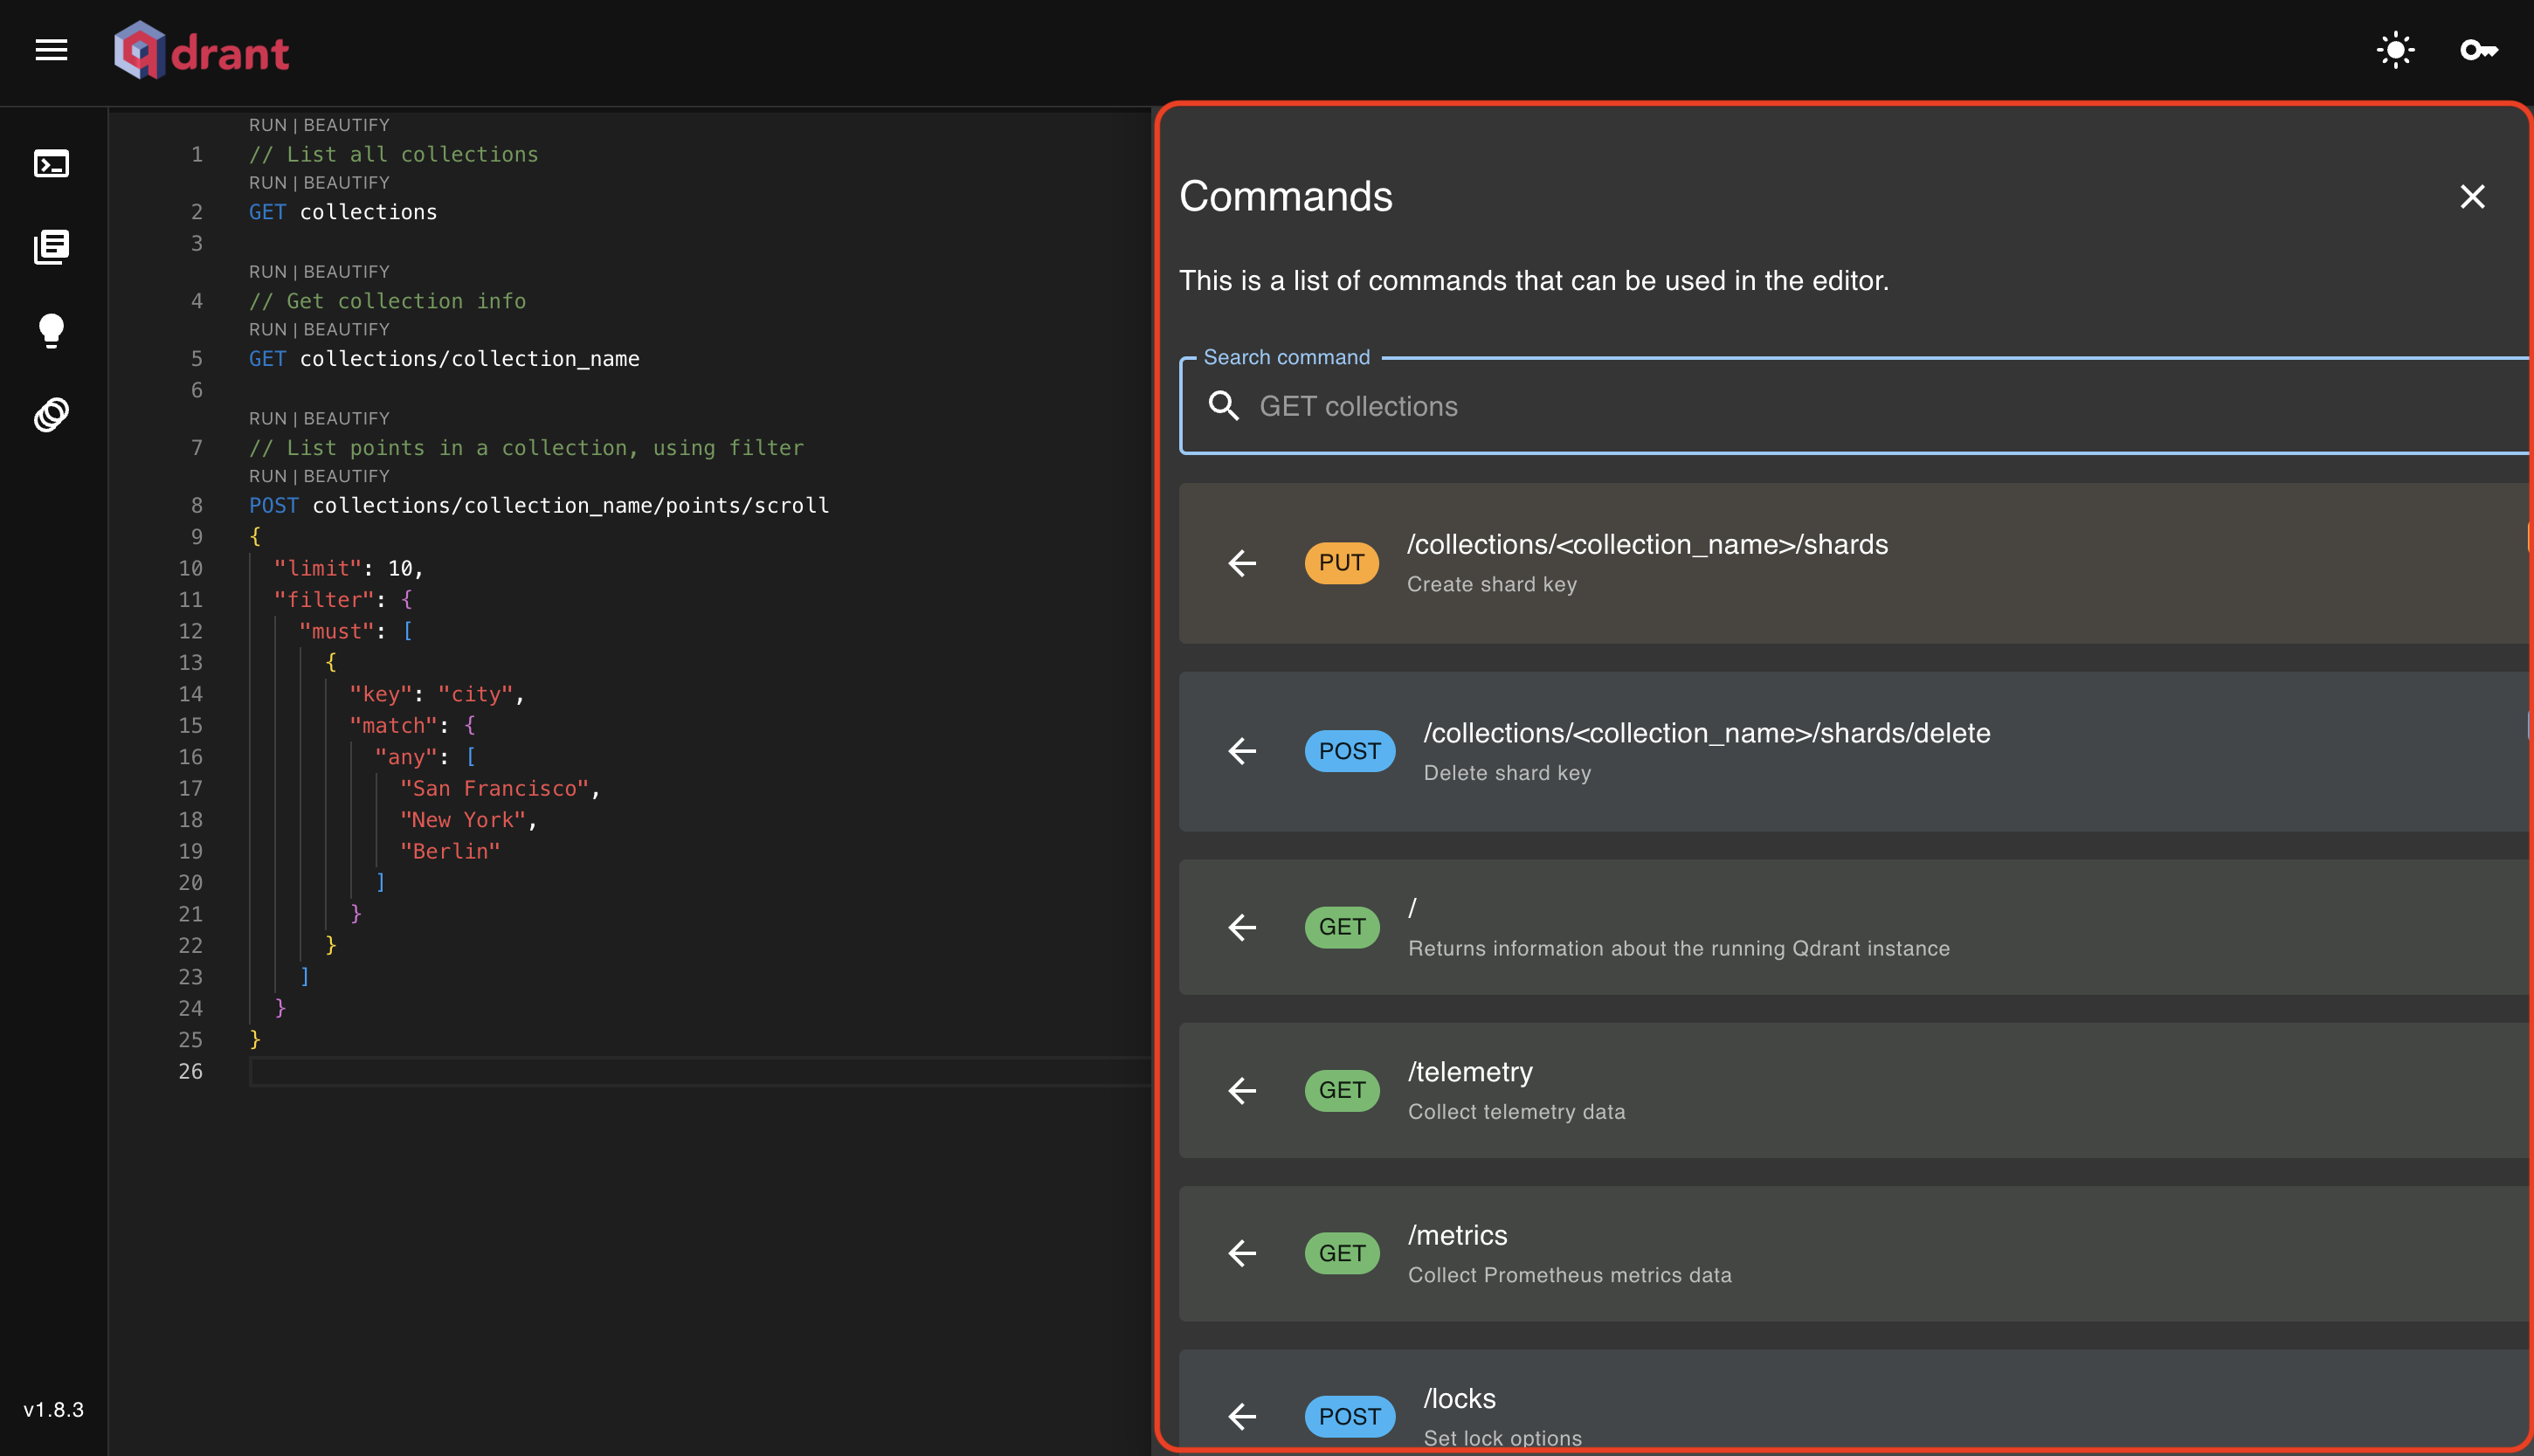
- Click on any API command to insert the command in the console.
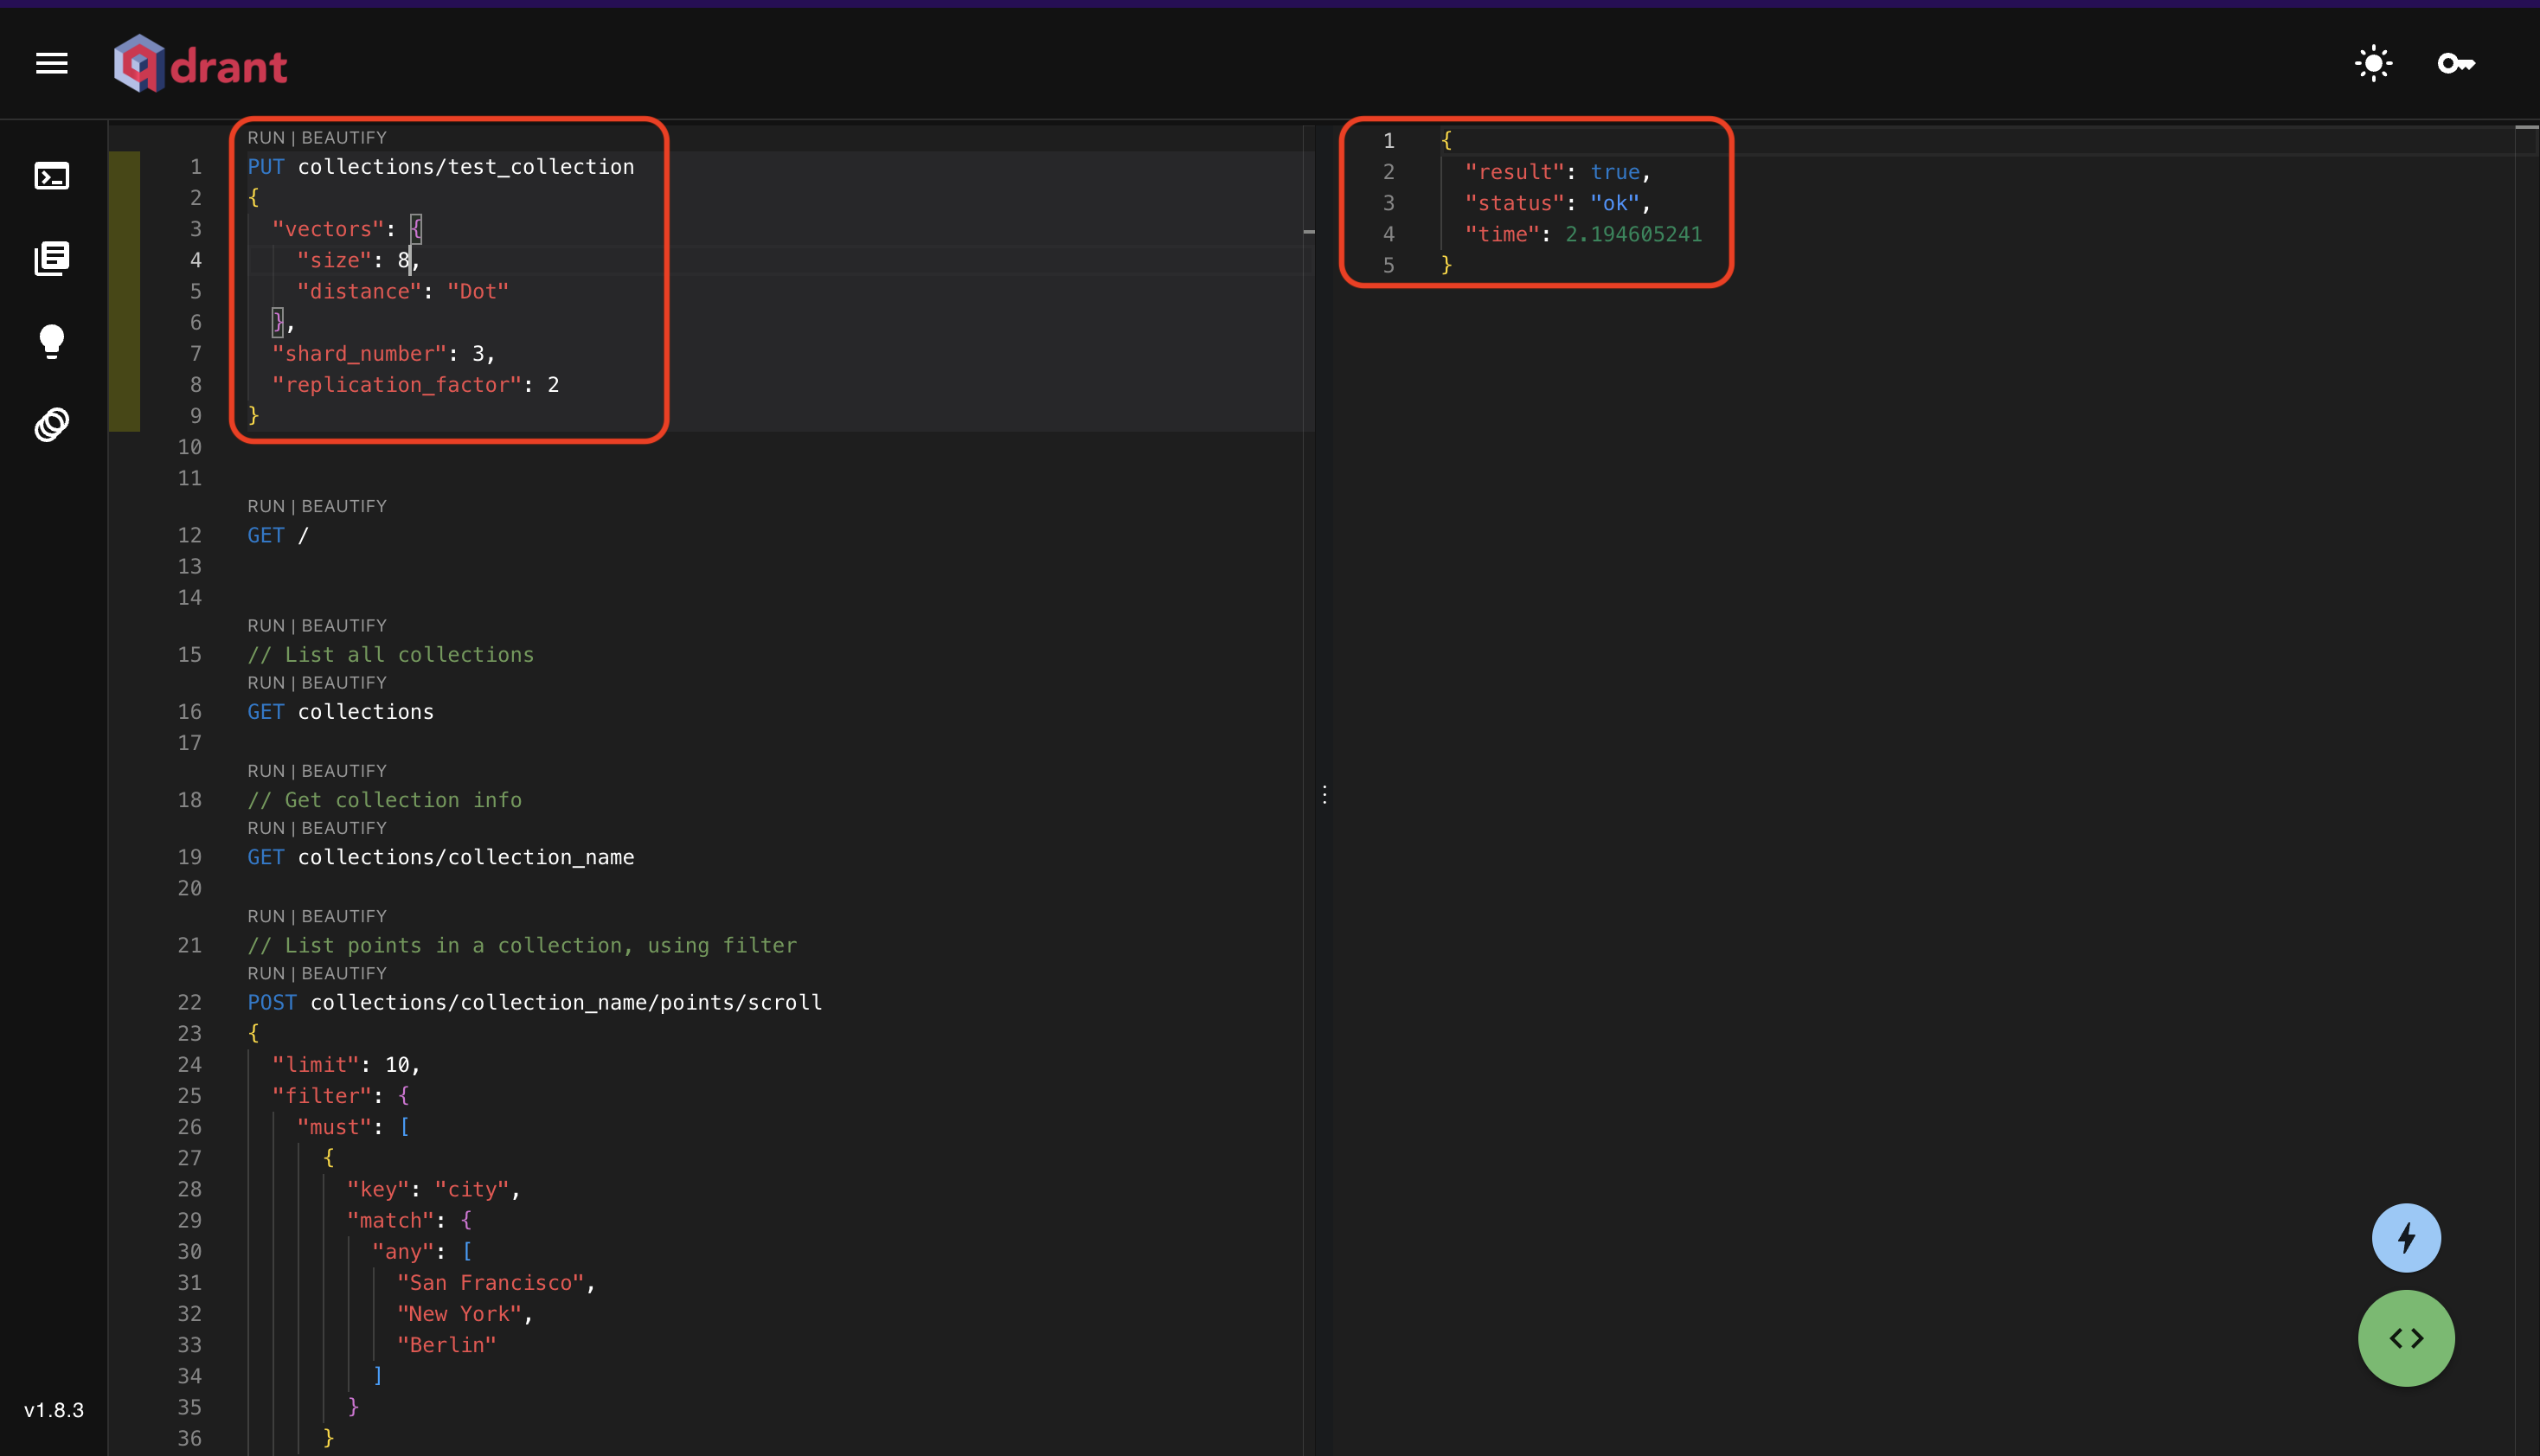
- After inserting the command in the console, click on the "Run" button to execute the command. Here we add a collection to the Qdrant.
Collections Section
-
The collections section is used to interact with the collections.
-
We can add, delete, and visualize the collections in the collections section.
-
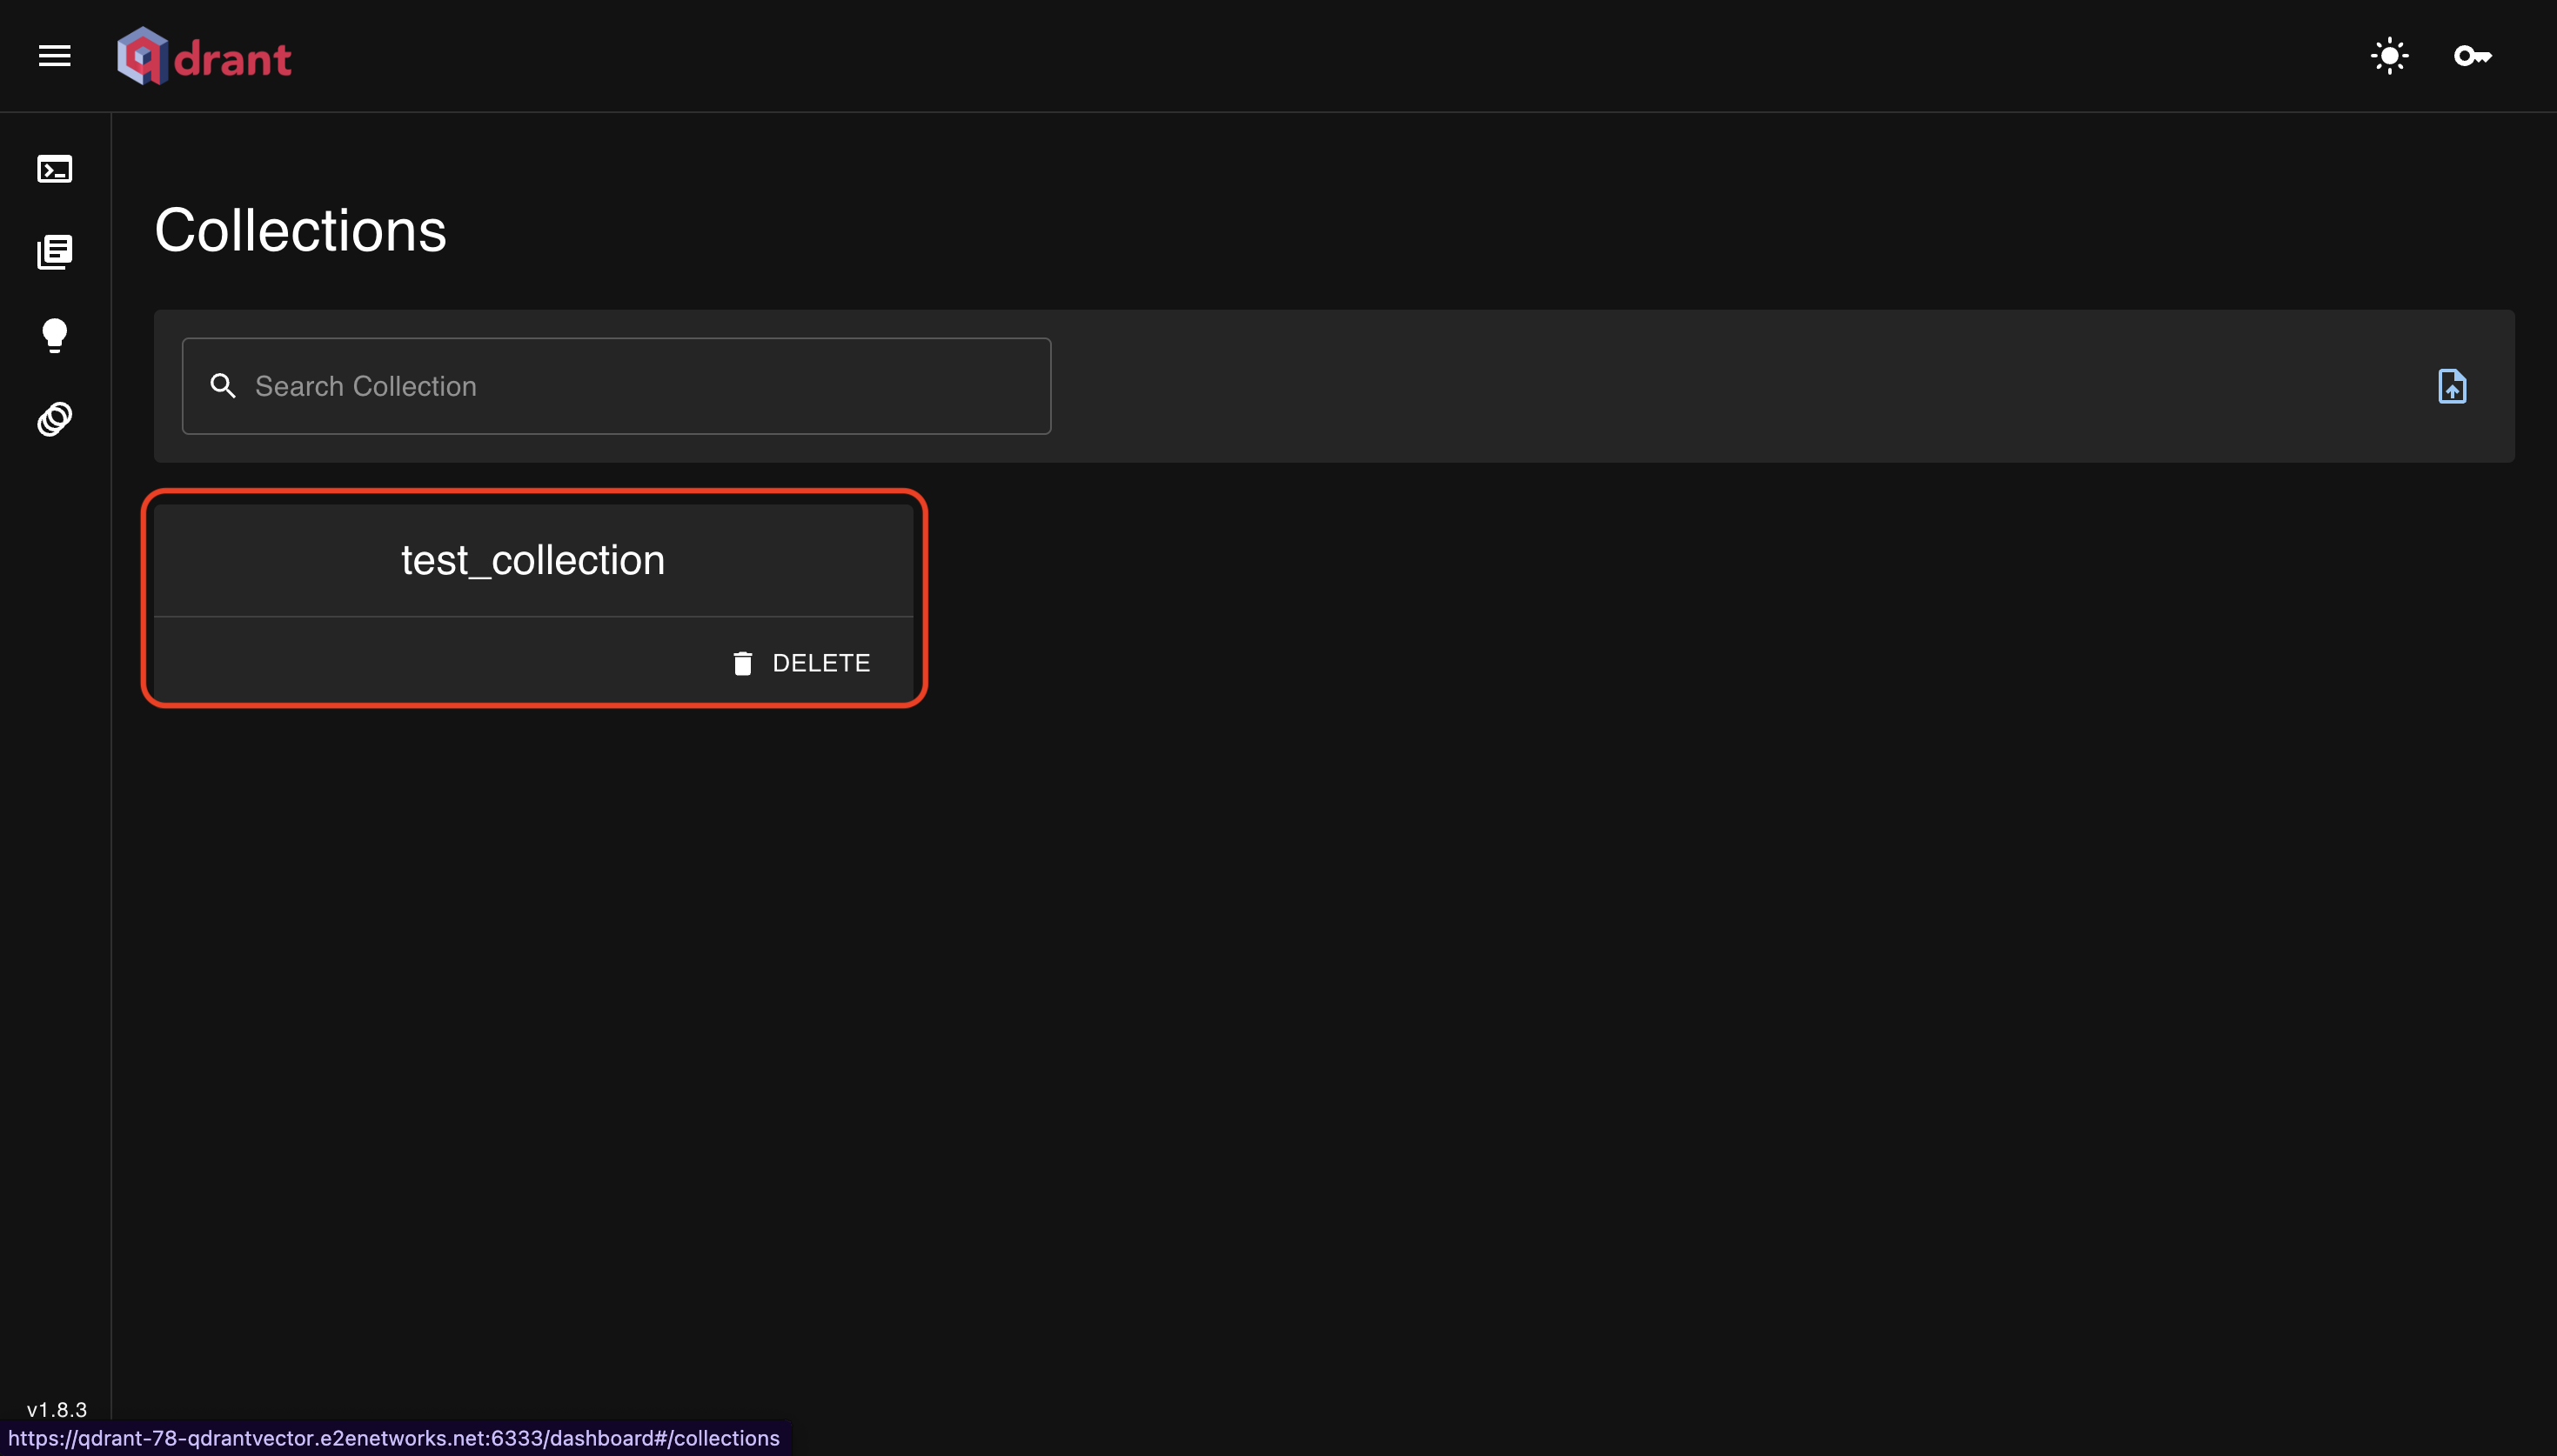
After adding the collection, we can see the collection on the collections page.
- Even though we have created a collection, it is empty.
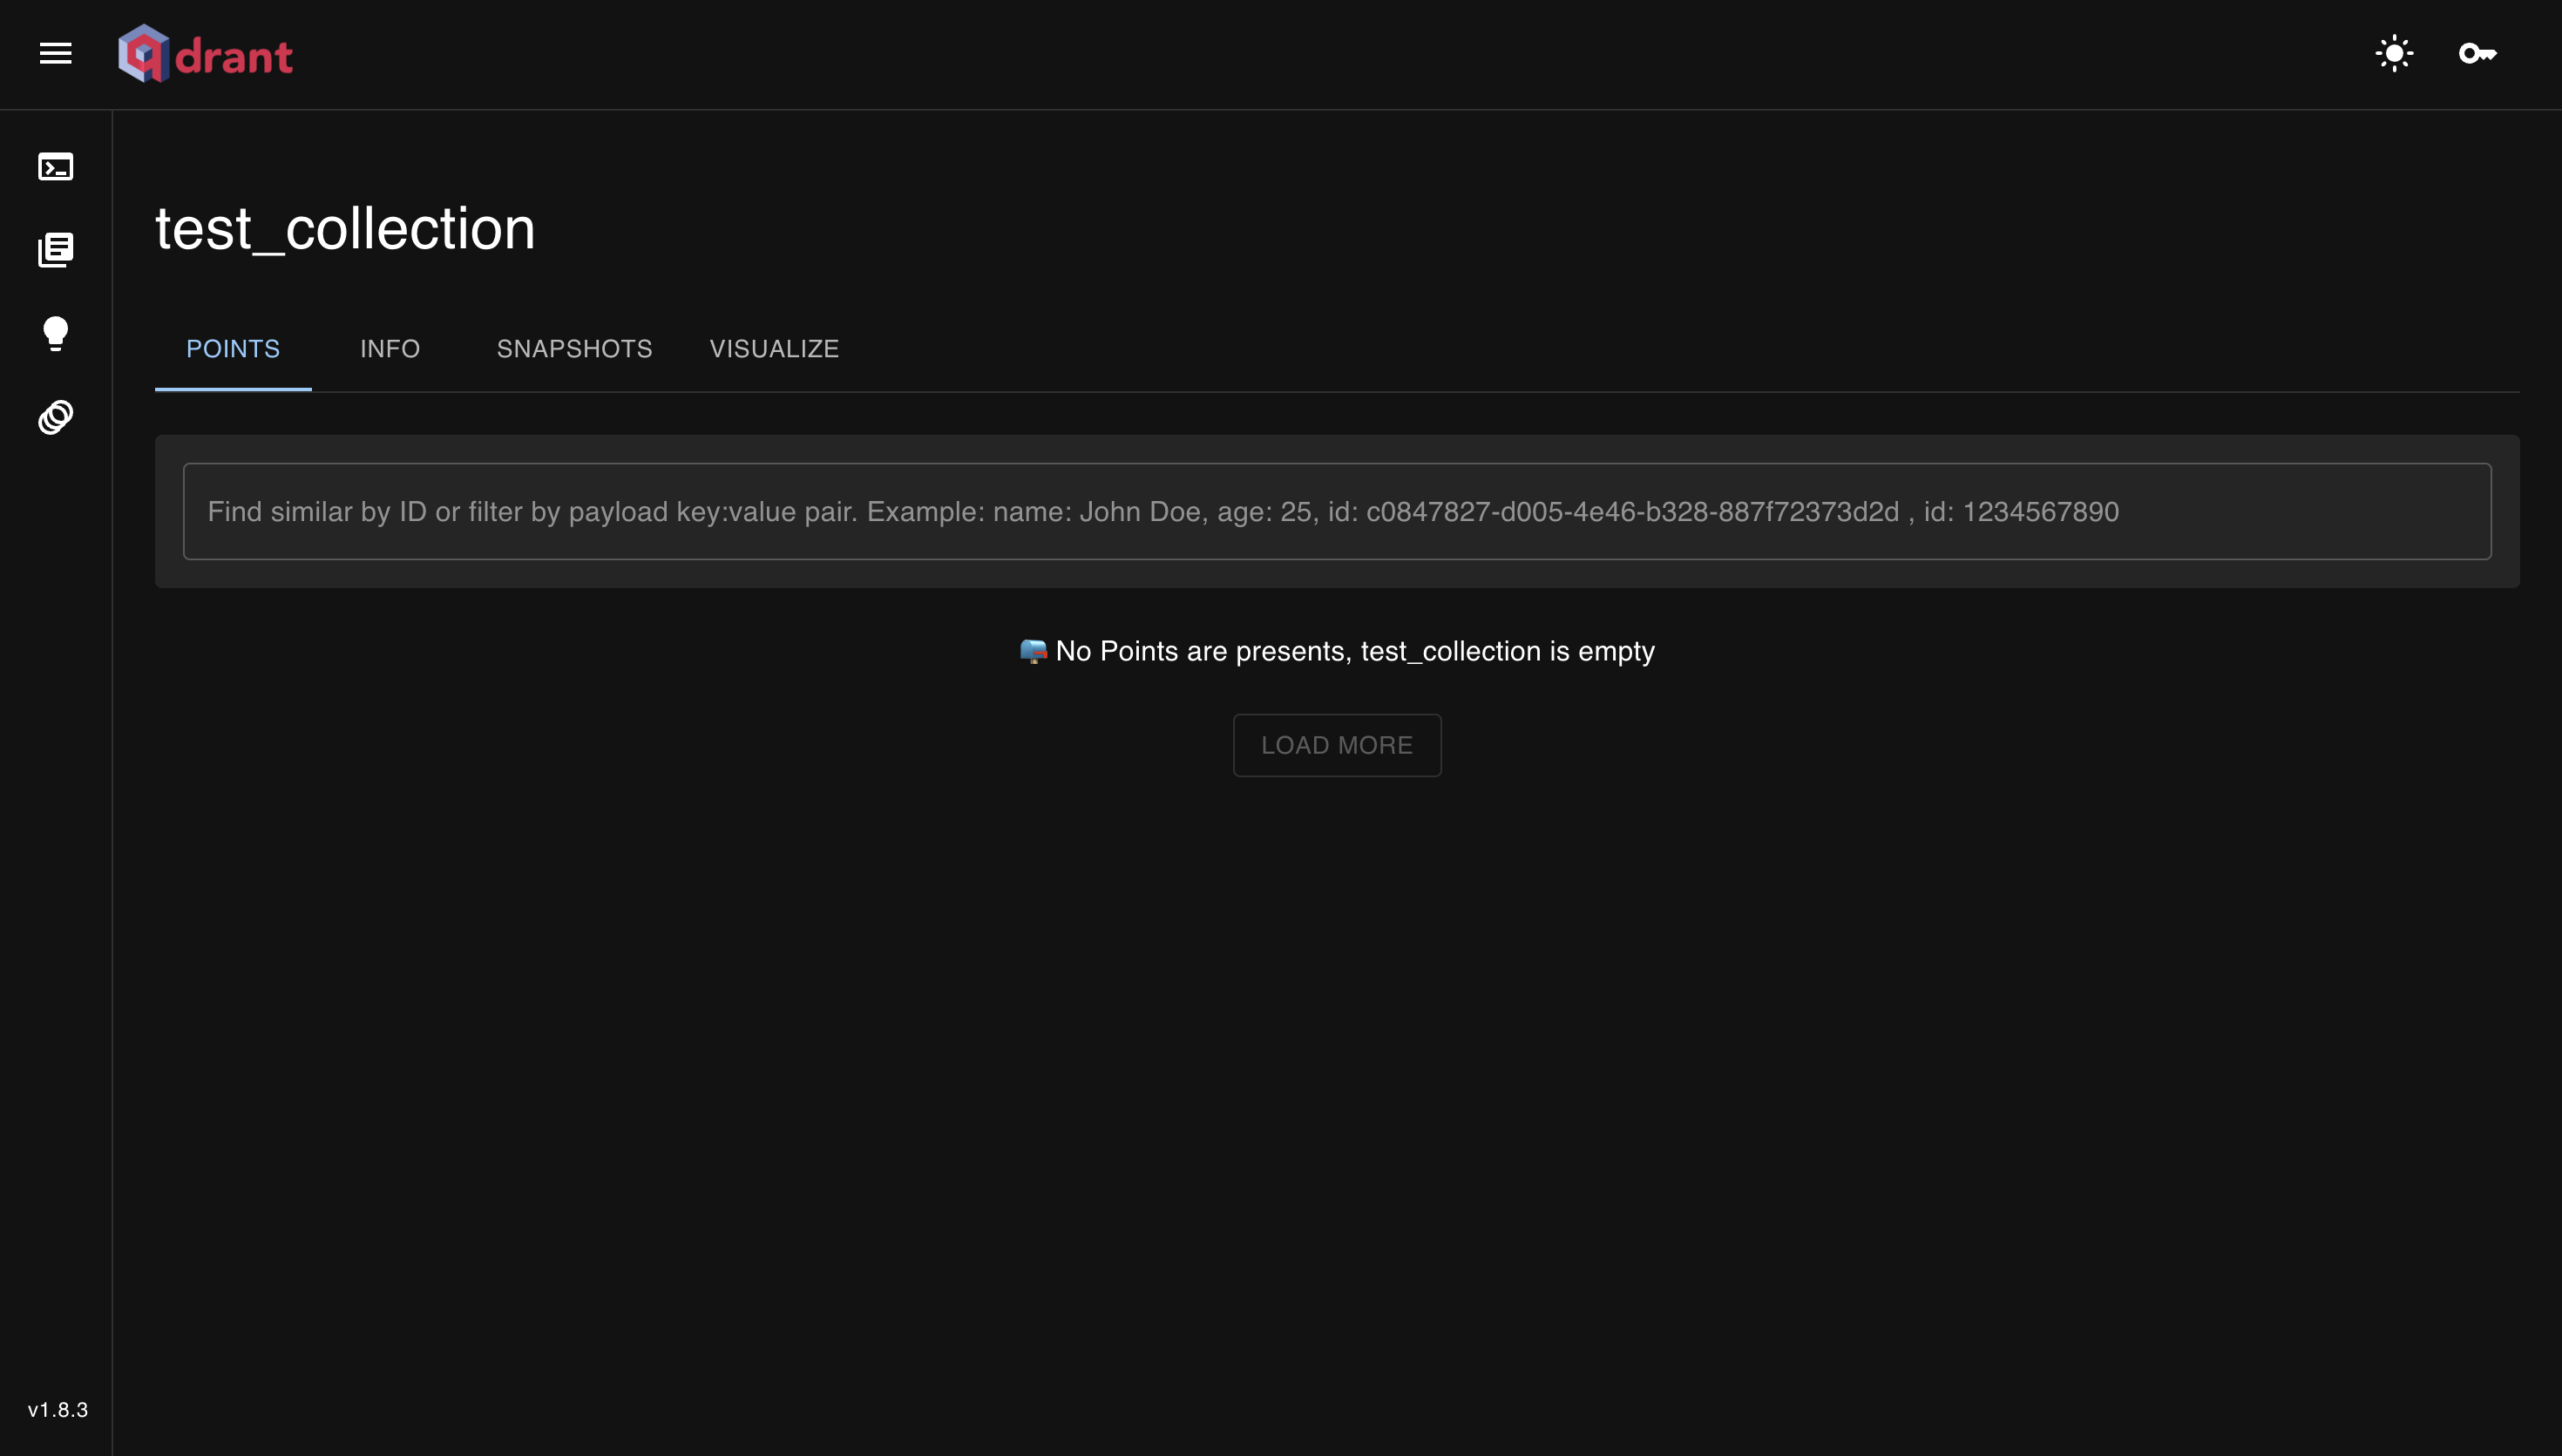
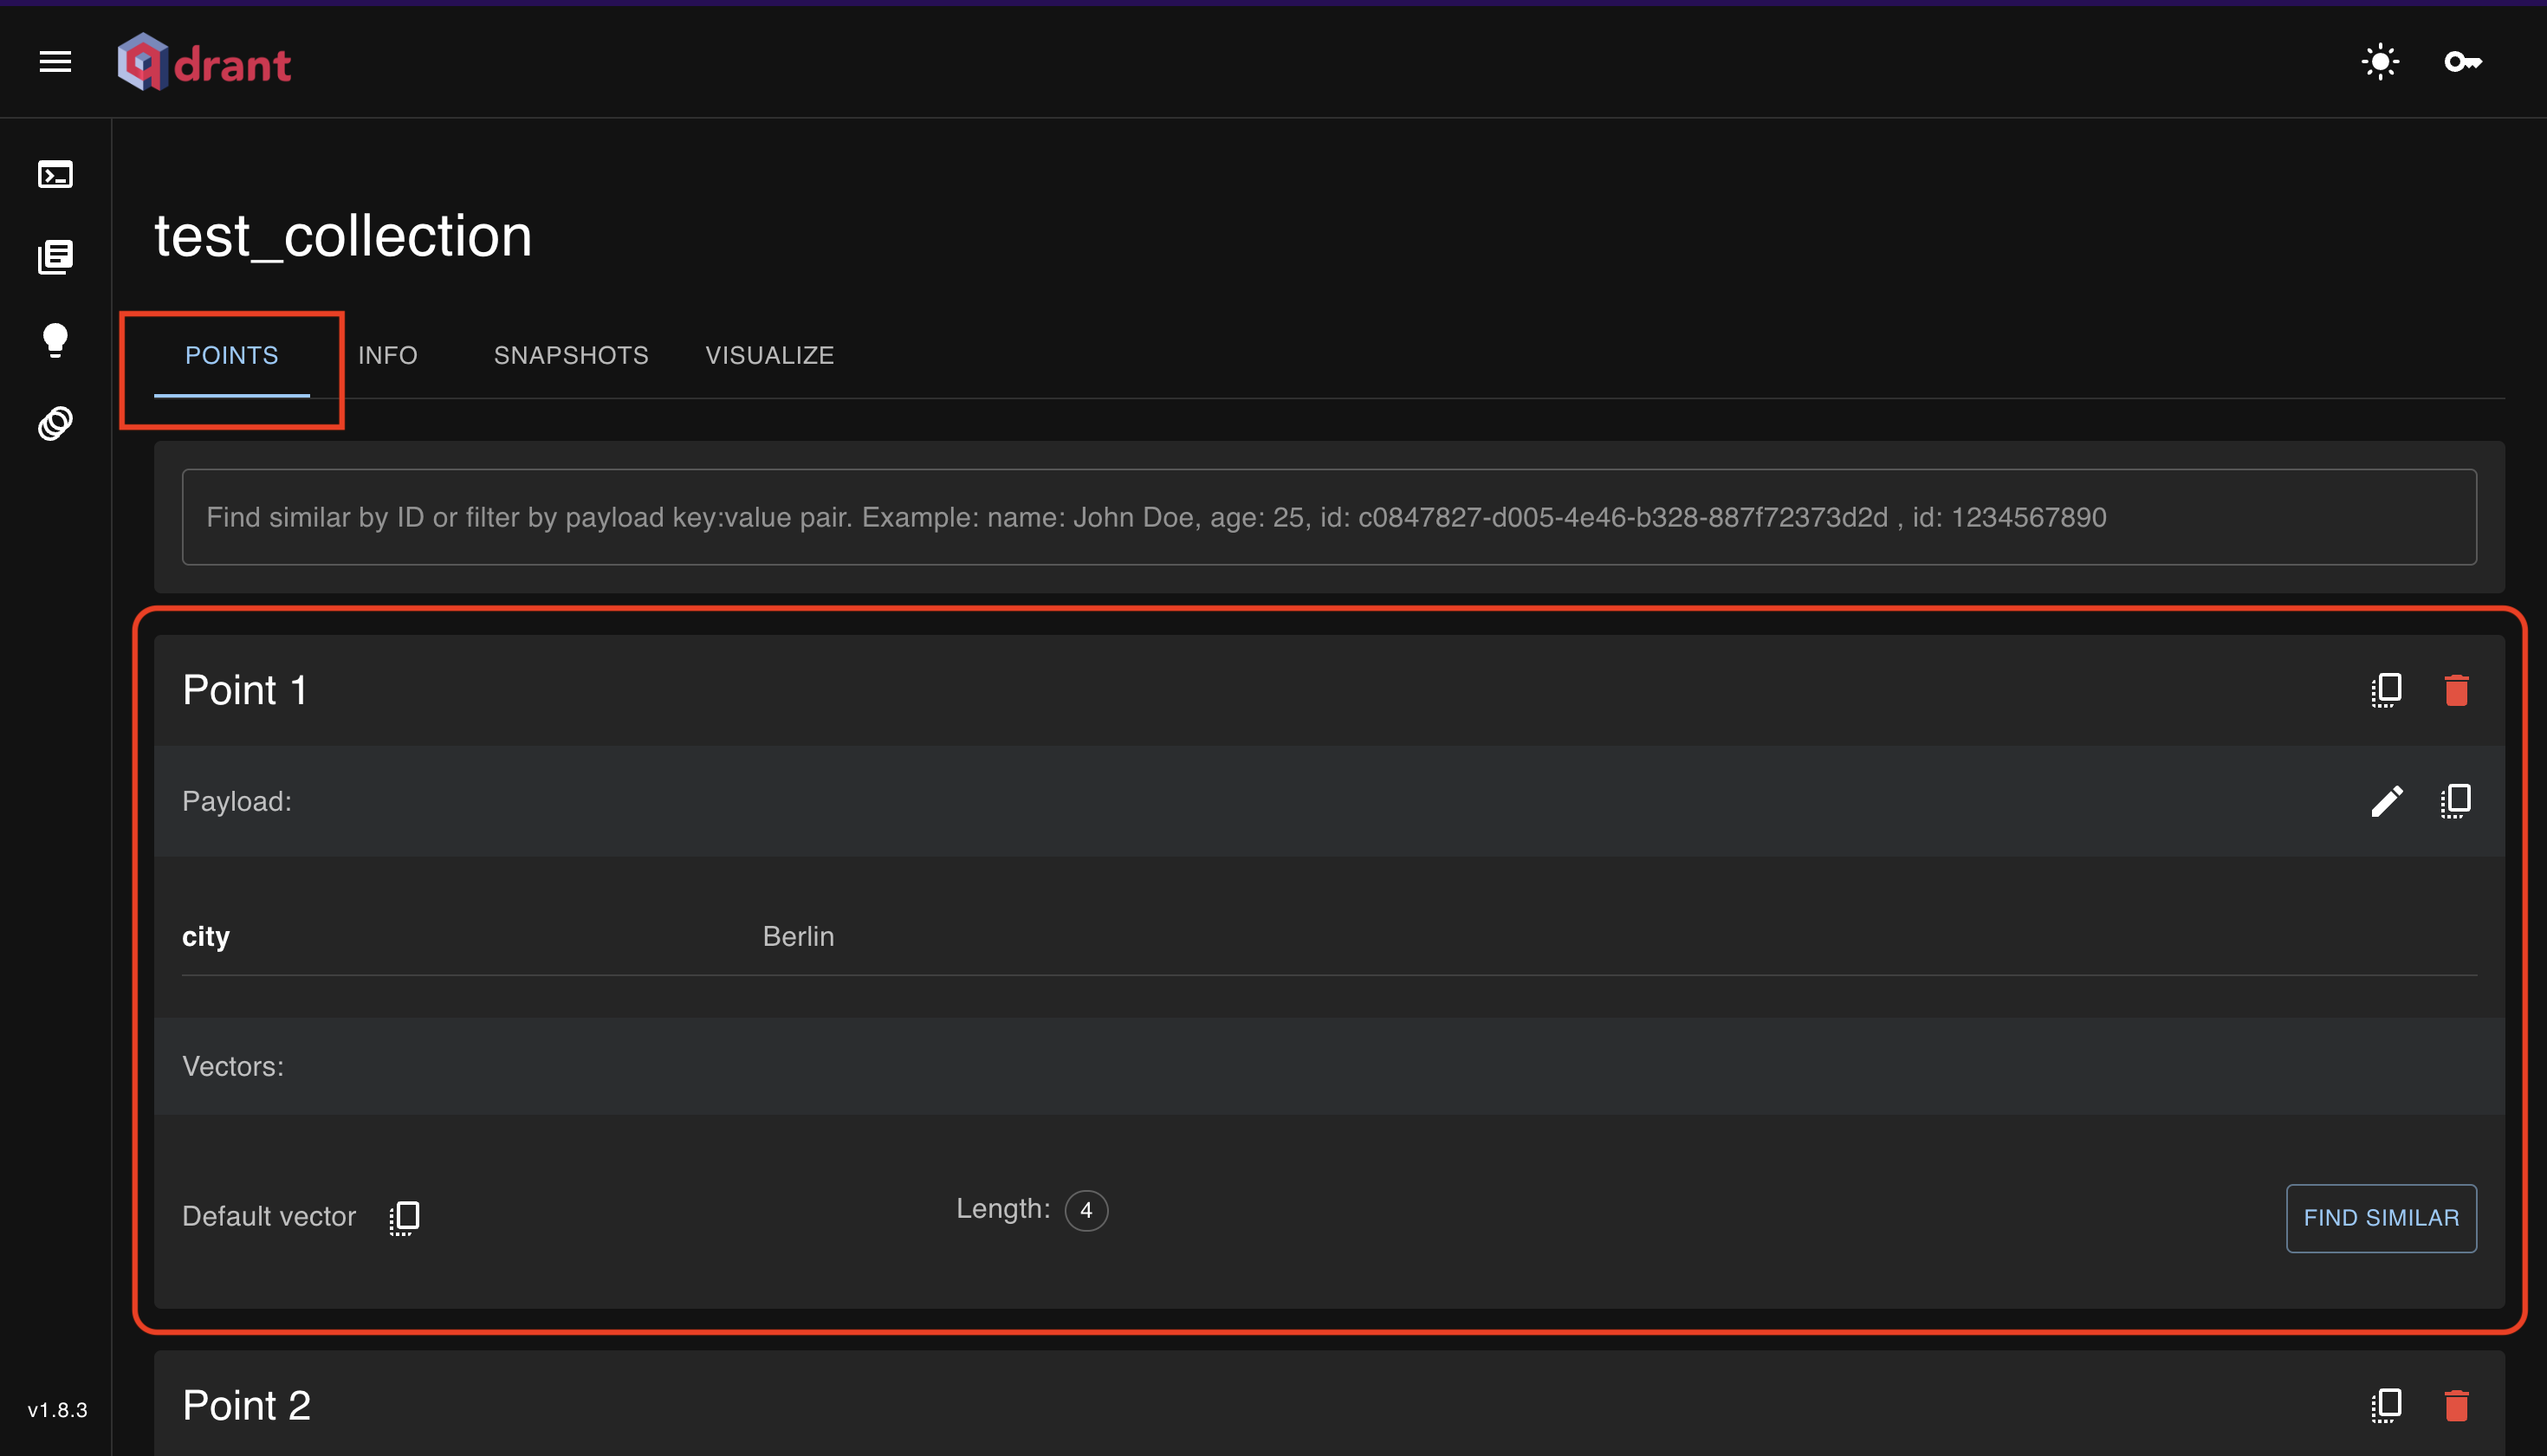
- After we add some points to the collections, we can see the points in the points tab.
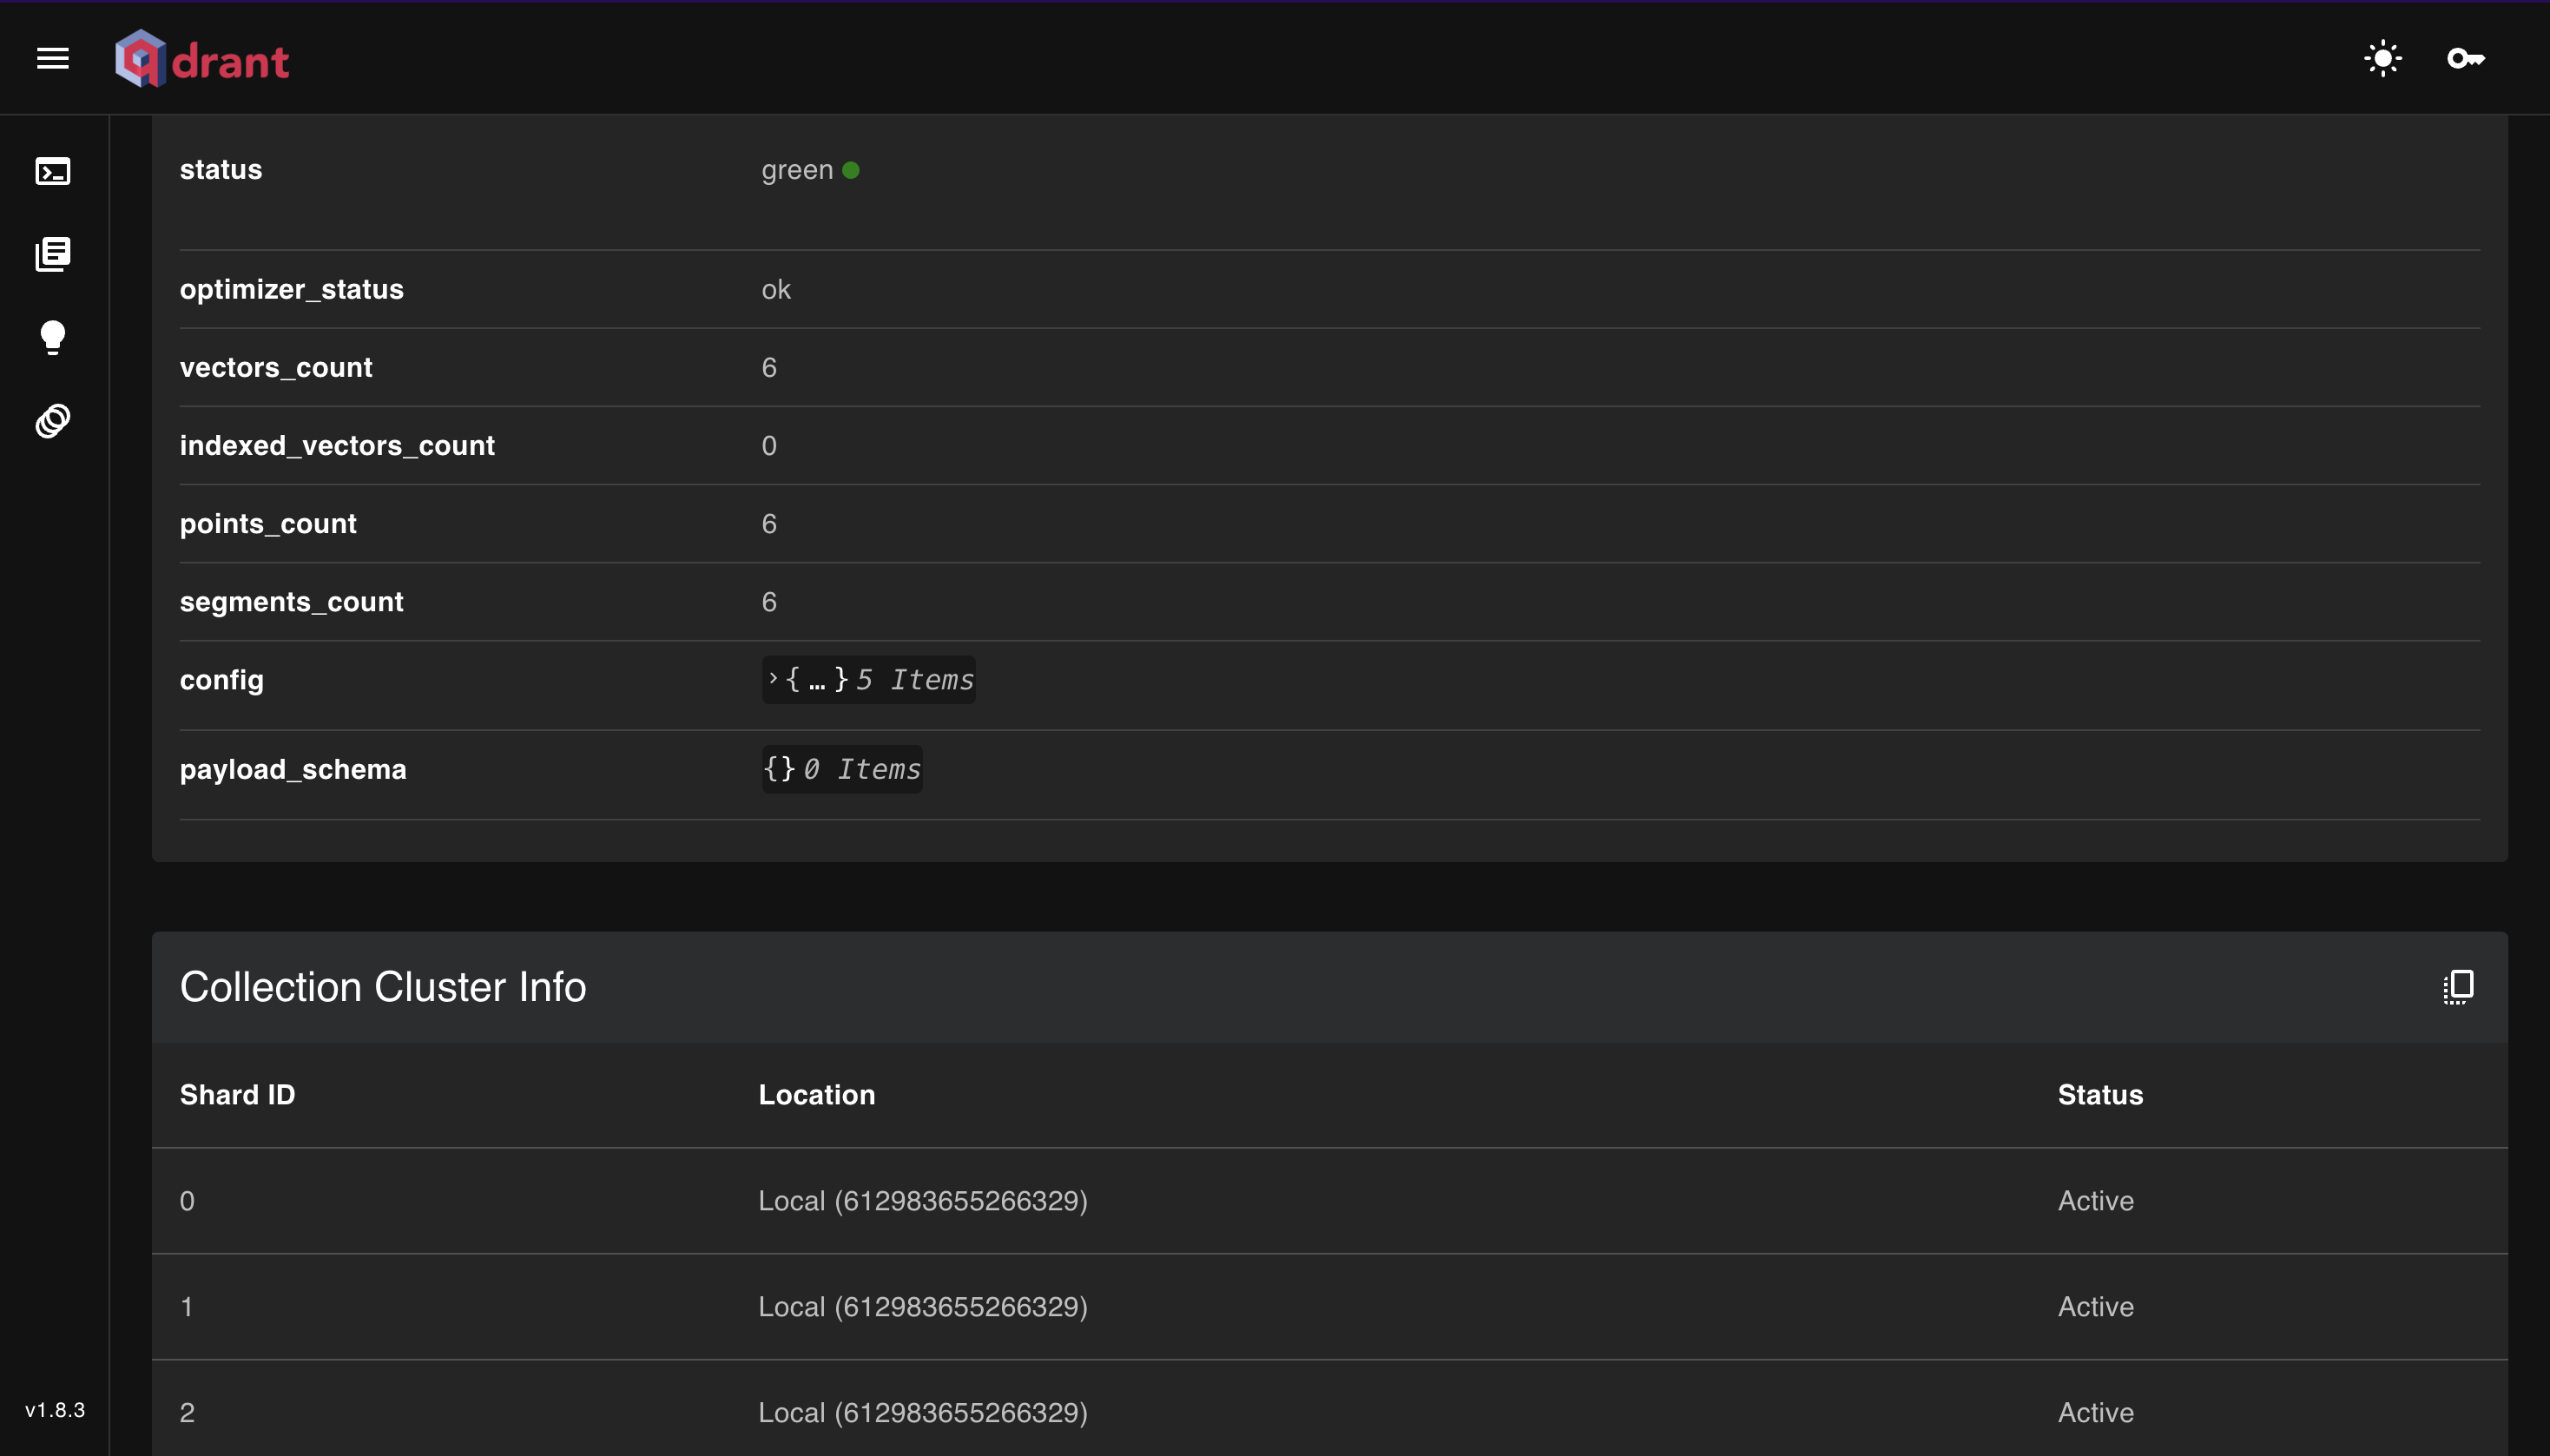
- We can see the information about the collection in the info tab.
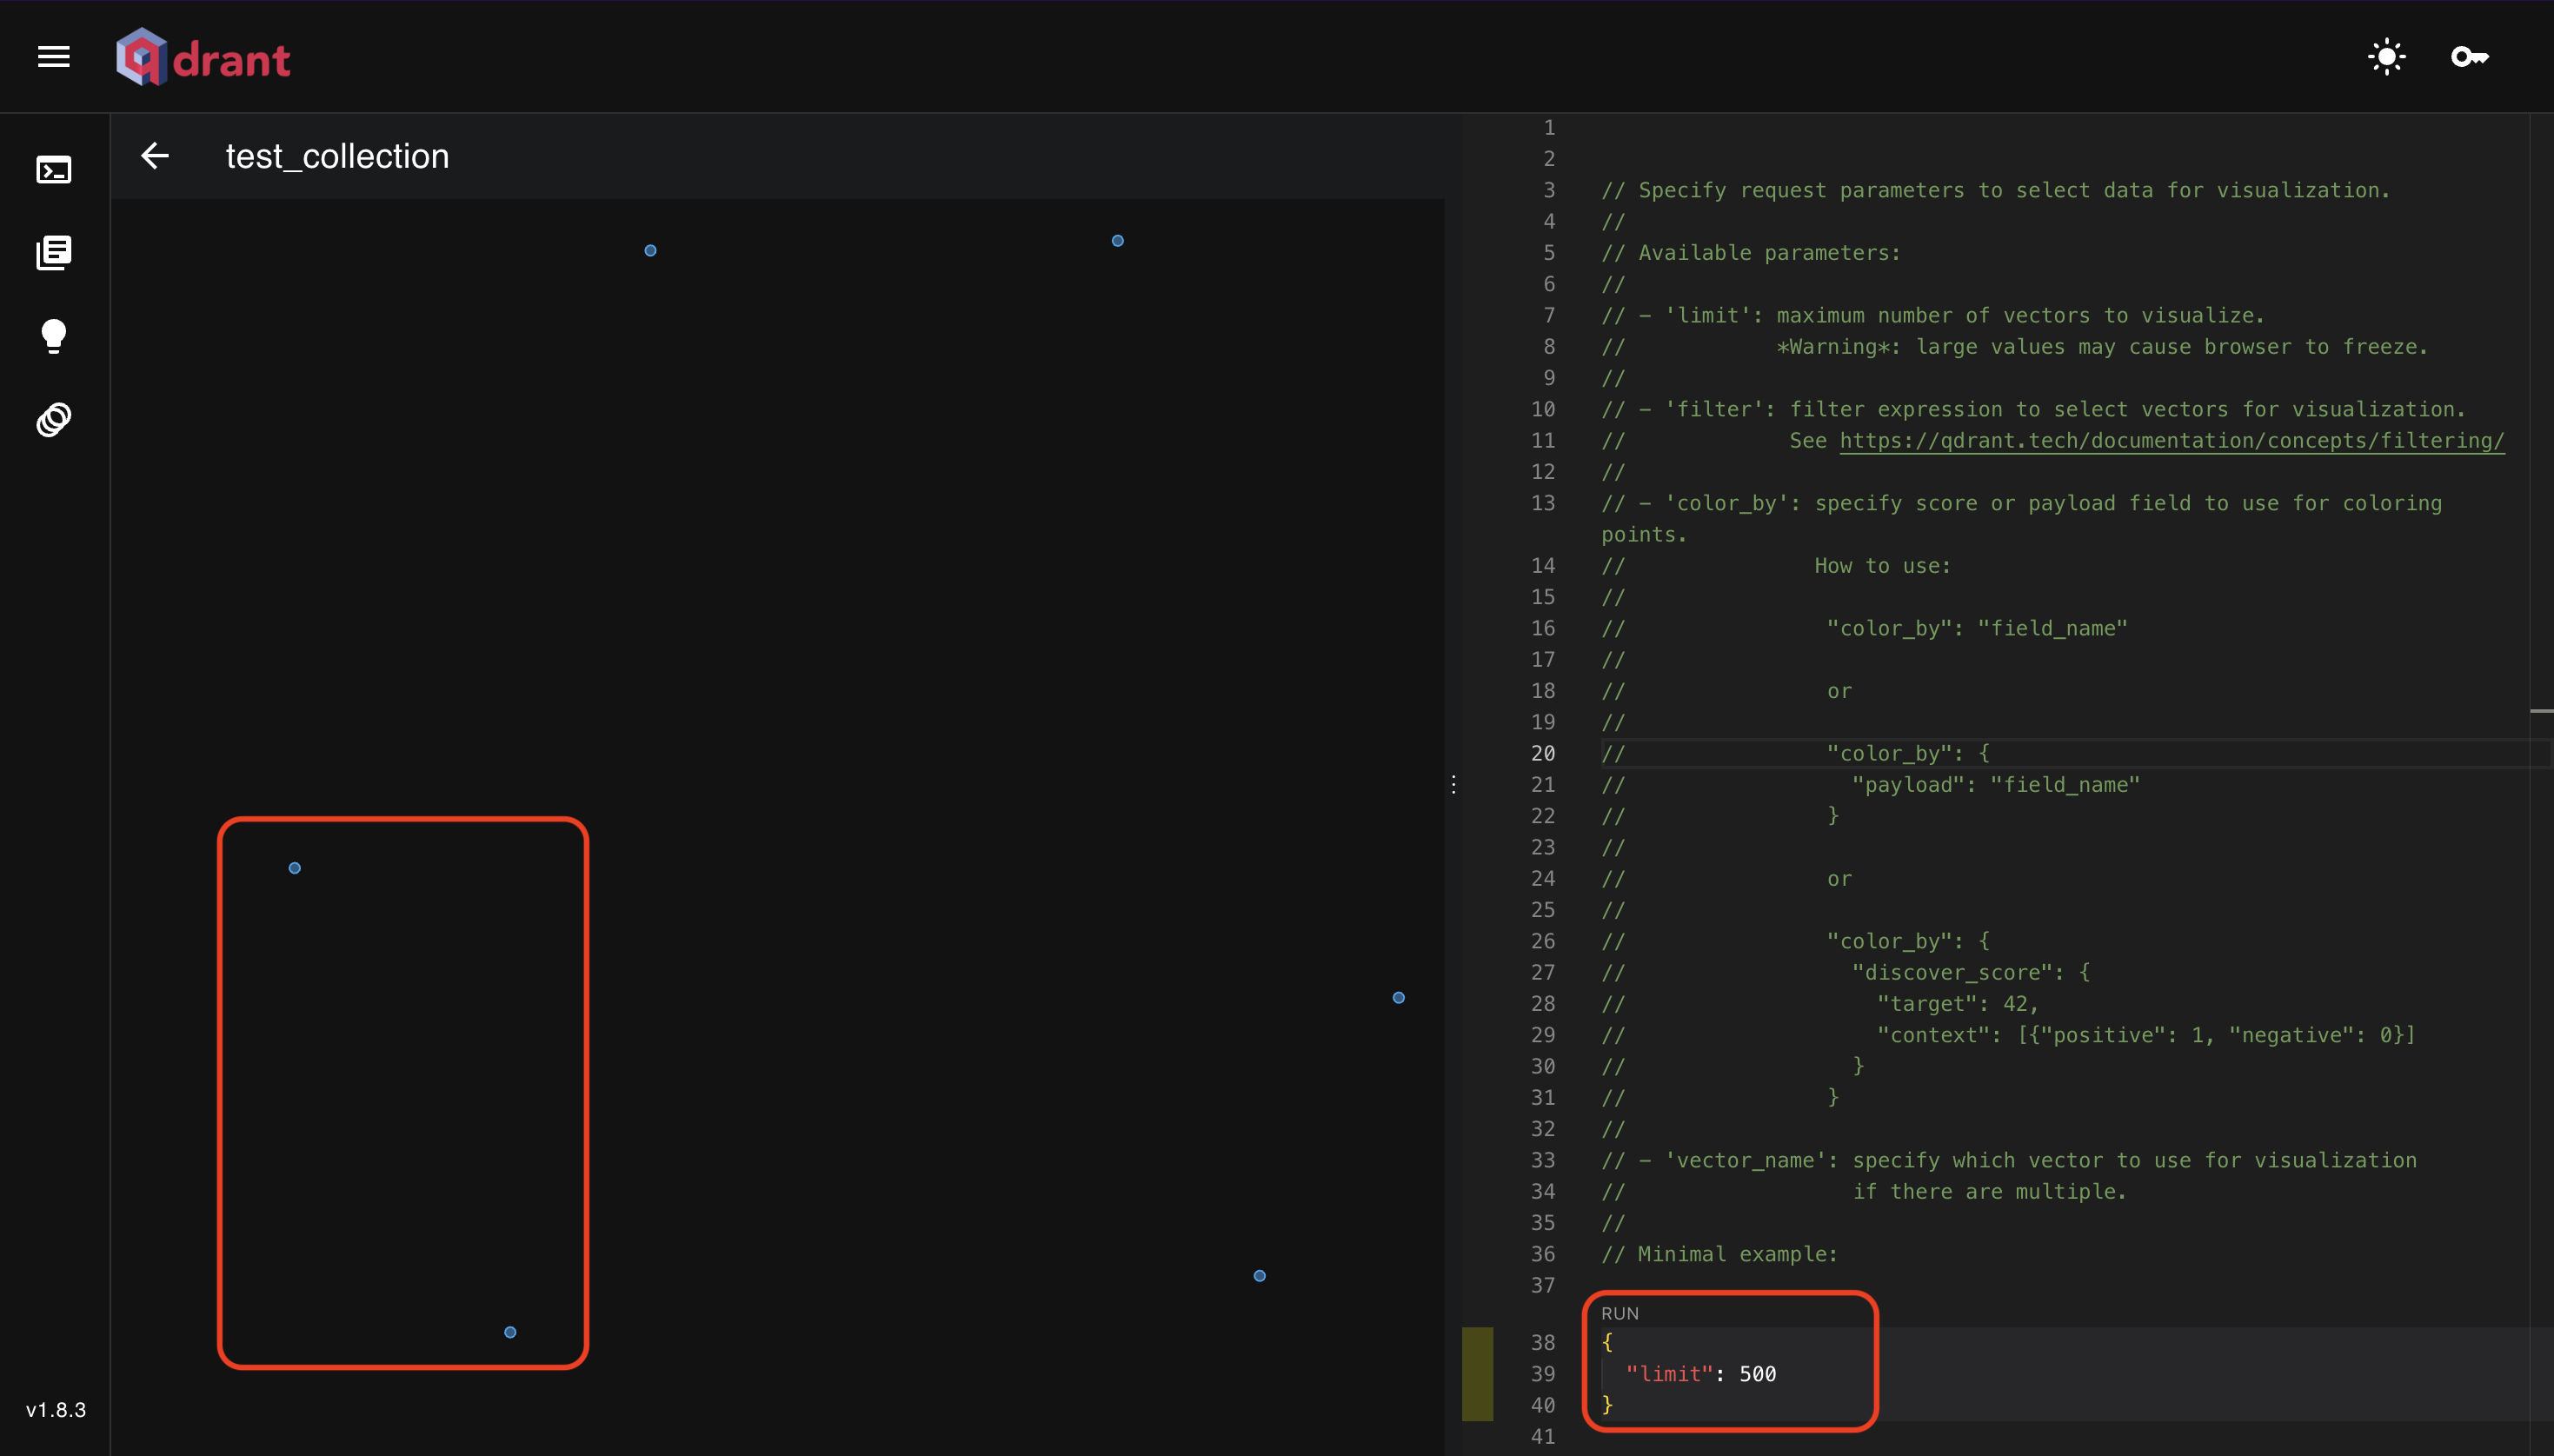
- We can visualize the points in the collection in the visualize tab.
What's Next?
You are free to explore the Qdrant dashboard and play around with the API commands.
- For the HTTP API tutorial, head over to Qdrant HTTP Requests.
- For the Python Client tutorial, head over to Qdrant Python Client.
- For more information on Qdrant, head over to Qdrant Documentation.