Using TensorBoard in Instances
Introduction
TensorBoard provides the visualization and tooling needed for machine learning experimentation:
- Tracking and visualizing metrics such as loss and accuracy
- visualizing the model graph (ops and layers)
- Viewing histograms of weights, biases, or other tensors as they change over time
- Projecting embeddings to a lower dimensional space
- Displaying images, text, and audio data
- Profiling TensorFlow programs
In E2E, user you can add TensorBoard to their Instance by selecting it in the Add-ons menu
either during creation or in the overview section.
To use TensorBoard in E2E, user need to select it in the Add-ons list and then launch TensorBoard in the Instance. Just selecting the add-on or just launching TensorBoard without selecting it in the add-ons will not work.
If Instance does not have TensorBoard installed, user can install it by running the following commands:
Installation
!pip3 install tensorboard
User can start TensorBoard by running the following command in your Instance:
Usage
%load_ext tensorboard
%tensorboard --logdir logs --bind_all
- The
--bind_allflag is required to view the TensorBoard result using the provided TensorBoard URL. - The
--logdiris the directory where TensorBoard will look to find TensorFlow event files that it can display. Replacelogswith your log directory containing the event files.
TensorBoard URL
User can get the URL from either Add-ons section in Manage Instance overview tab or by
running the following command in your Instance:
import os
os.getenv("TENSORBOARD_URL")
Example
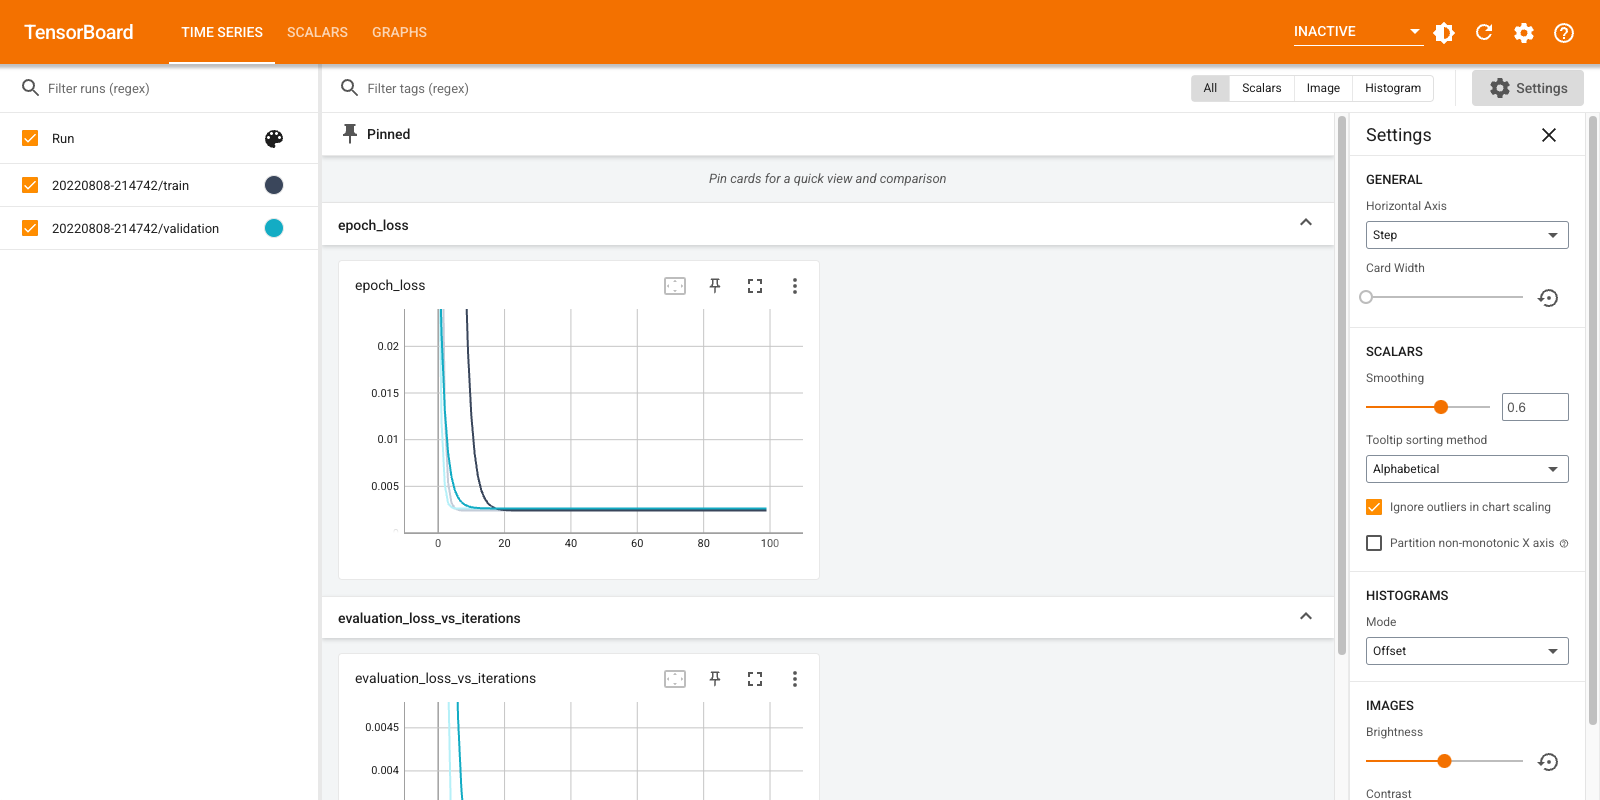
Below is an example of TensorBoard being used on Instance:
TensorBoard's Time Series Dashboard allows you to visualize these metrics using a simple API with very little effort. This tutorial presents very basic example to User you learn how to use these APIs with TensorBoard when developing your Keras model.
Setup
import os
from datetime import datetime
from packaging import version

import tensorflow as tf
from tensorflow import keras
from keras import backend as K

import numpy as np

print("TensorFlow version: ", tf.__version__)
assert version.parse(tf.__version__).release[0] >= 2, \
    "This requires TensorFlow 2.0 or above."
Set up data for a simple regression
You're now going to use Keras to calculate a regression, i.e., find the best line of fit for a paired data set.
You're going to use TensorBoard to observe how training and test loss change across epochs. Hopefully, you'll see training and test loss decrease over time and then remain steady.
First, generate 1000 data points roughly along the line y = 0.5x + 2. Split these data points into training and test sets. Your hope is that the neural net learns this relationship.
data_size = 1000
# 80% of the data is for training.
train_pct = 0.8

train_size = int(data_size * train_pct)

# Create some input data between -1 and 1 and randomize it.
x = np.linspace(-1, 1, data_size)
np.random.shuffle(x)

# Generate the output data.
# y = 0.5x + 2 + noise
y = 0.5 * x + 2 + np.random.normal(0, 0.05, (data_size, ))

# Split into test and train pairs.
x_train, y_train = x[:train_size], y[:train_size]
x_test, y_test = x[train_size:], y[train_size:]
Training the model and logging loss
You're now ready to define, train and evaluate your model.
To log the loss scalar as you train, you'll do the following:
- Create the Keras TensorBoard callback
- Specify a log directory
- Pass the TensorBoard callback to Keras' Model.fit().
TensorBoard reads log data from the log directory hierarchy.
In this instance, the root log directory is logs/scalars, suffixed by a timestamped subdirectory.
The timestamped subdirectory enables you to easily identify and select training runs
as you use TensorBoard and iterate on your model.
logdir = "logs/scalars/" + datetime.now().strftime("%Y%m%d-%H%M%S")
tensorboard_callback = keras.callbacks.TensorBoard(log_dir=logdir)

model = keras.models.Sequential([
    keras.layers.Dense(16, input_dim=1),
    keras.layers.Dense(1),
])

model.compile(
    loss='mse', # keras.losses.mean_squared_error
    optimizer=keras.optimizers.SGD(learning_rate=0.2),
)

print("Training ... With default parameters, this takes less than 10 seconds.")
training_history = model.fit(
    x_train, # input
    y_train, # output
    batch_size=train_size,
    verbose=0, # Suppress chatty output; use TensorBoard instead
    epochs=100,
    validation_data=(x_test, y_test),
    callbacks=[tensorboard_callback],
)

print("Average test loss: ", np.average(training_history.history['loss']))
Examining loss using TensorBoard
Now, start TensorBoard, specifying the root log directory you used above.
Wait a few seconds for TensorBoard to start up & access the UI using the TensorBoard URL
%load_ext tensorboard
%tensorboard --logdir logs/scalars --bind_all

os.getenv("TENSORBOARD_URL")
Sample Output

While Instance currently do not support local rendering of TensorBoard, users can view the TensorBoard using the TensorBoard URL. TensorBoard must be selected in the Add-ons list to access the URL.