Introduction
E2E Networks nodes and load balancers are monitored for commonly tracked parameters to ensure server health in real-time. The information is visually represented on the MyAccount portal. MyAccount also allows you to easily configure alert policies and set email notifications to respond quickly when server health alerts are triggered, aiding in better planning and proactively resolving potential issues.
In this guide, we’ll cover how to view monitoring graphs and set alerts through the MyAccount portal.
- Login to MyAccount portal
- Once logged in to My Account, select the 'Nodes' or 'Load Balancer' sub-menu under the Products menu on the left side of your dashboard.
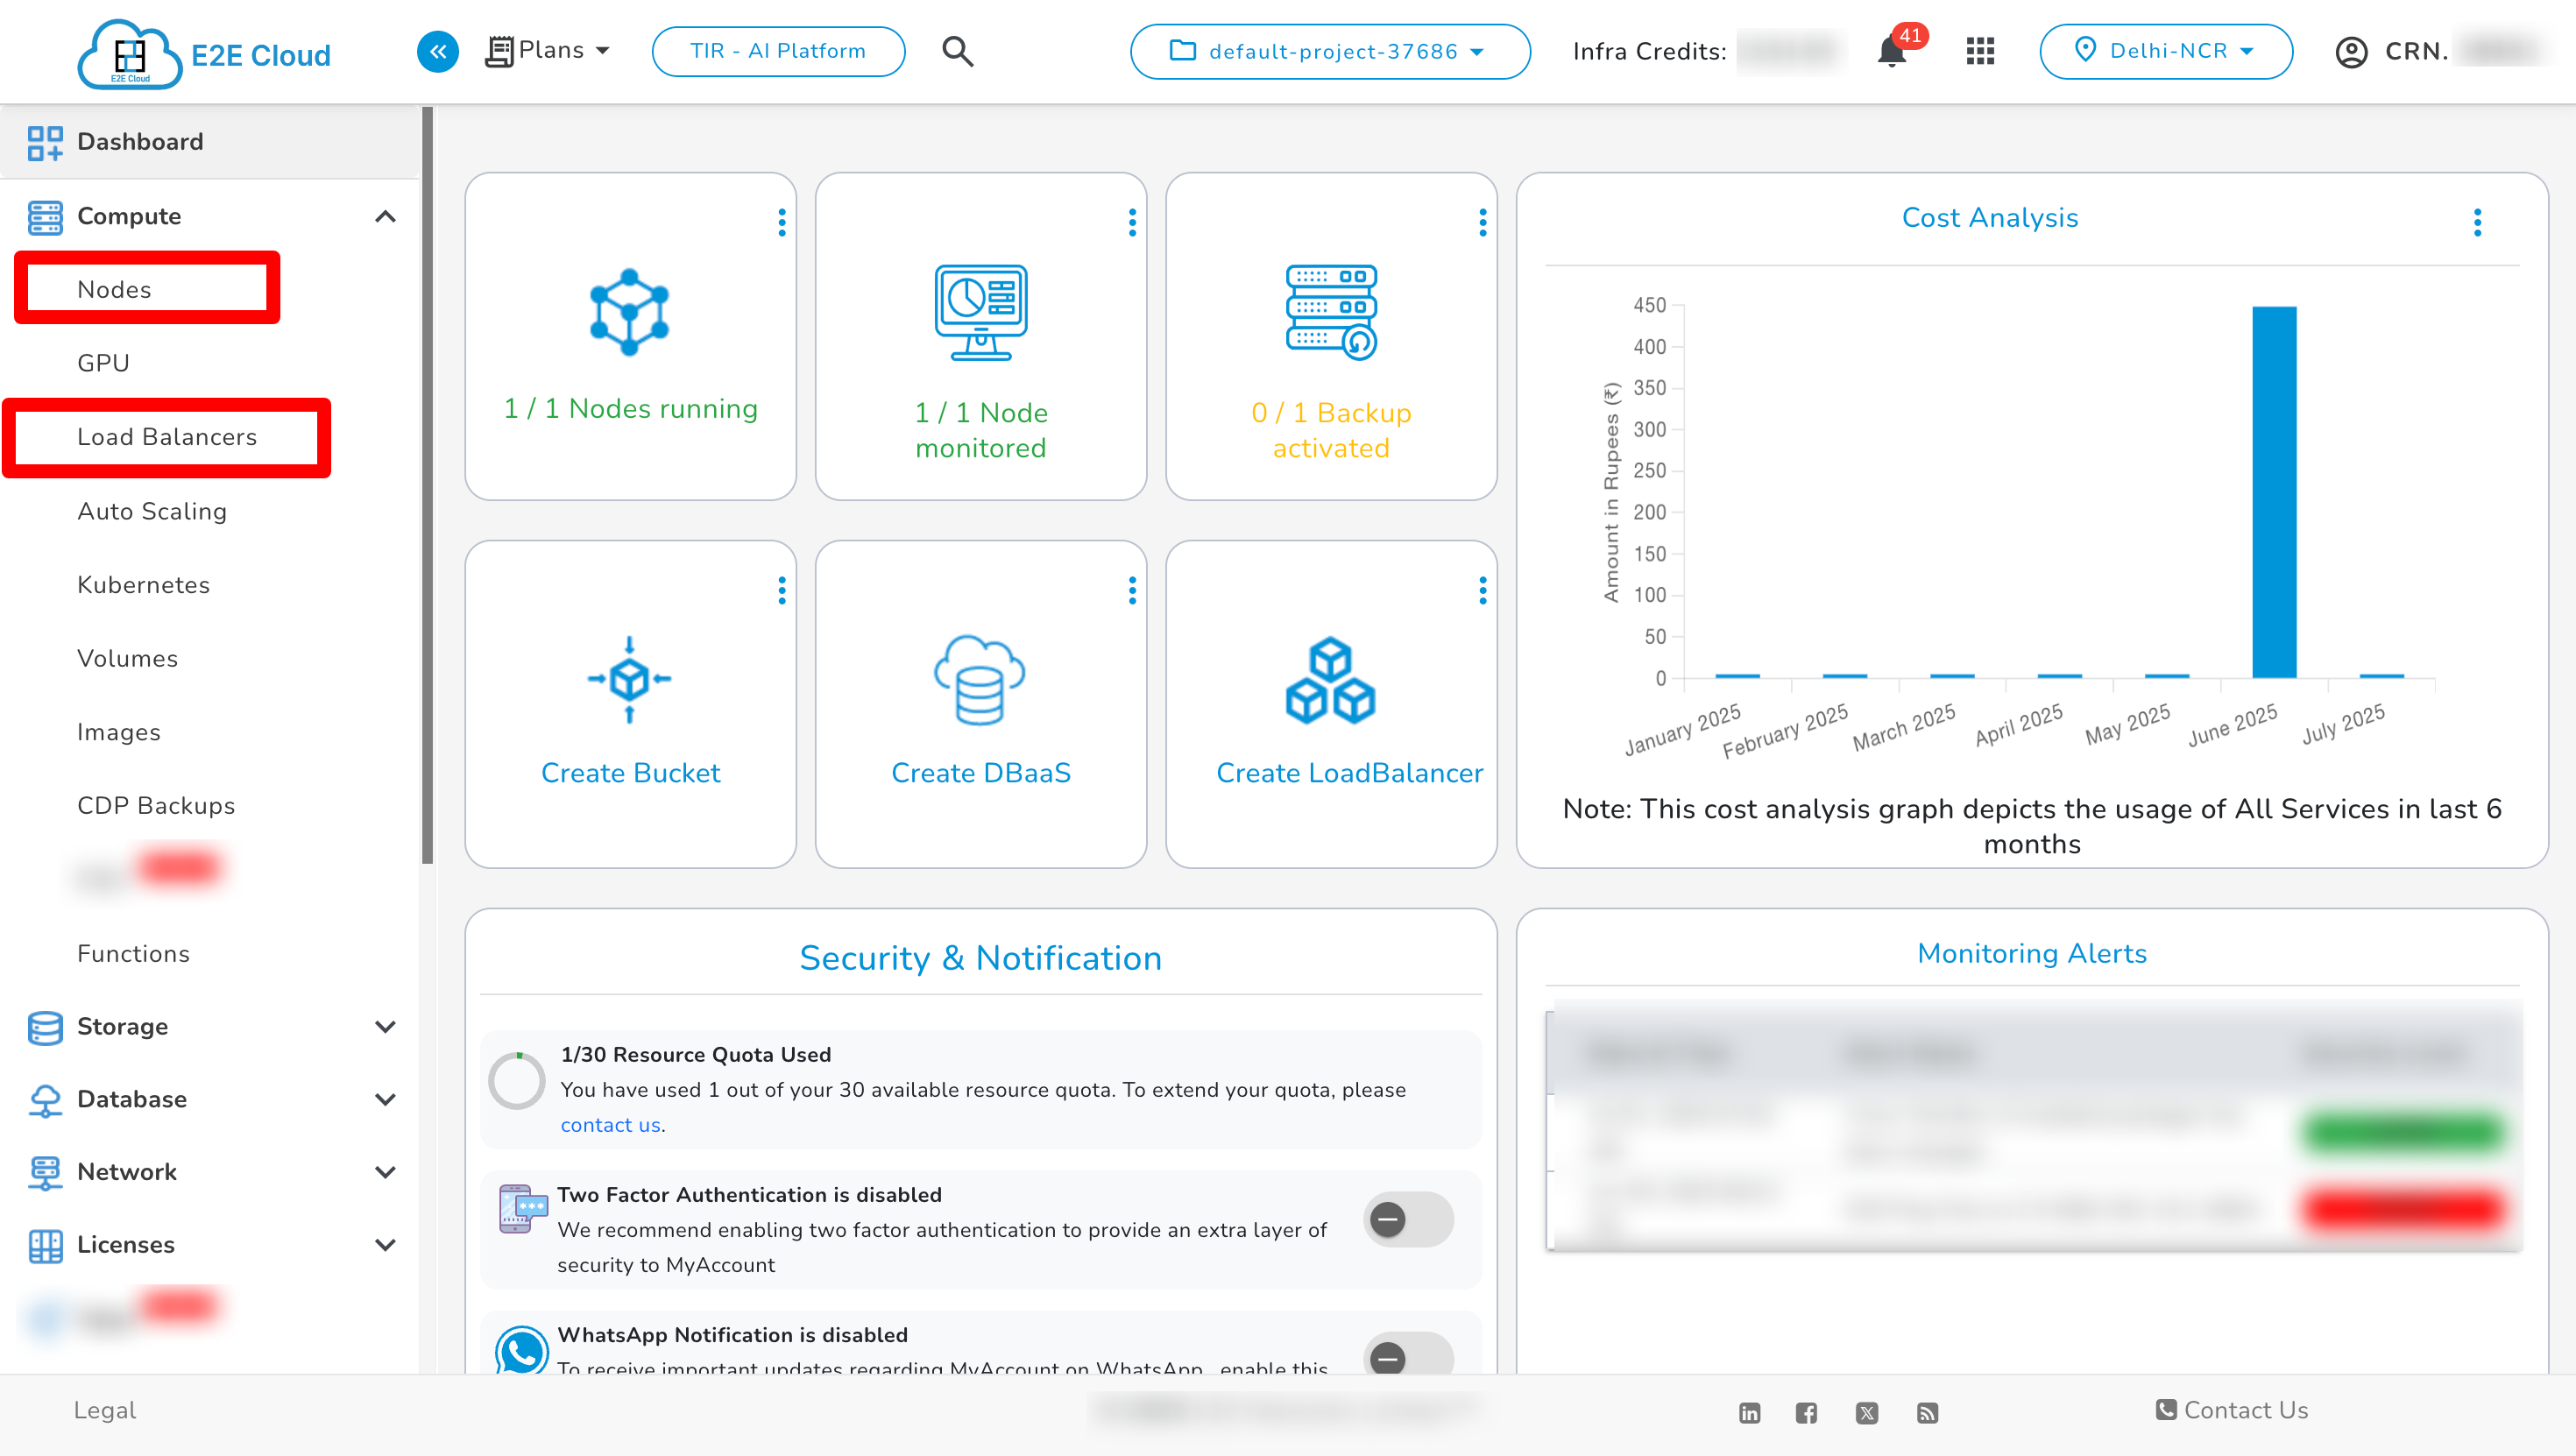
- Clicking on a node redirects you to the 'Manage Node' page. Your running nodes will be listed, and you can create an E2E Node if none exist.
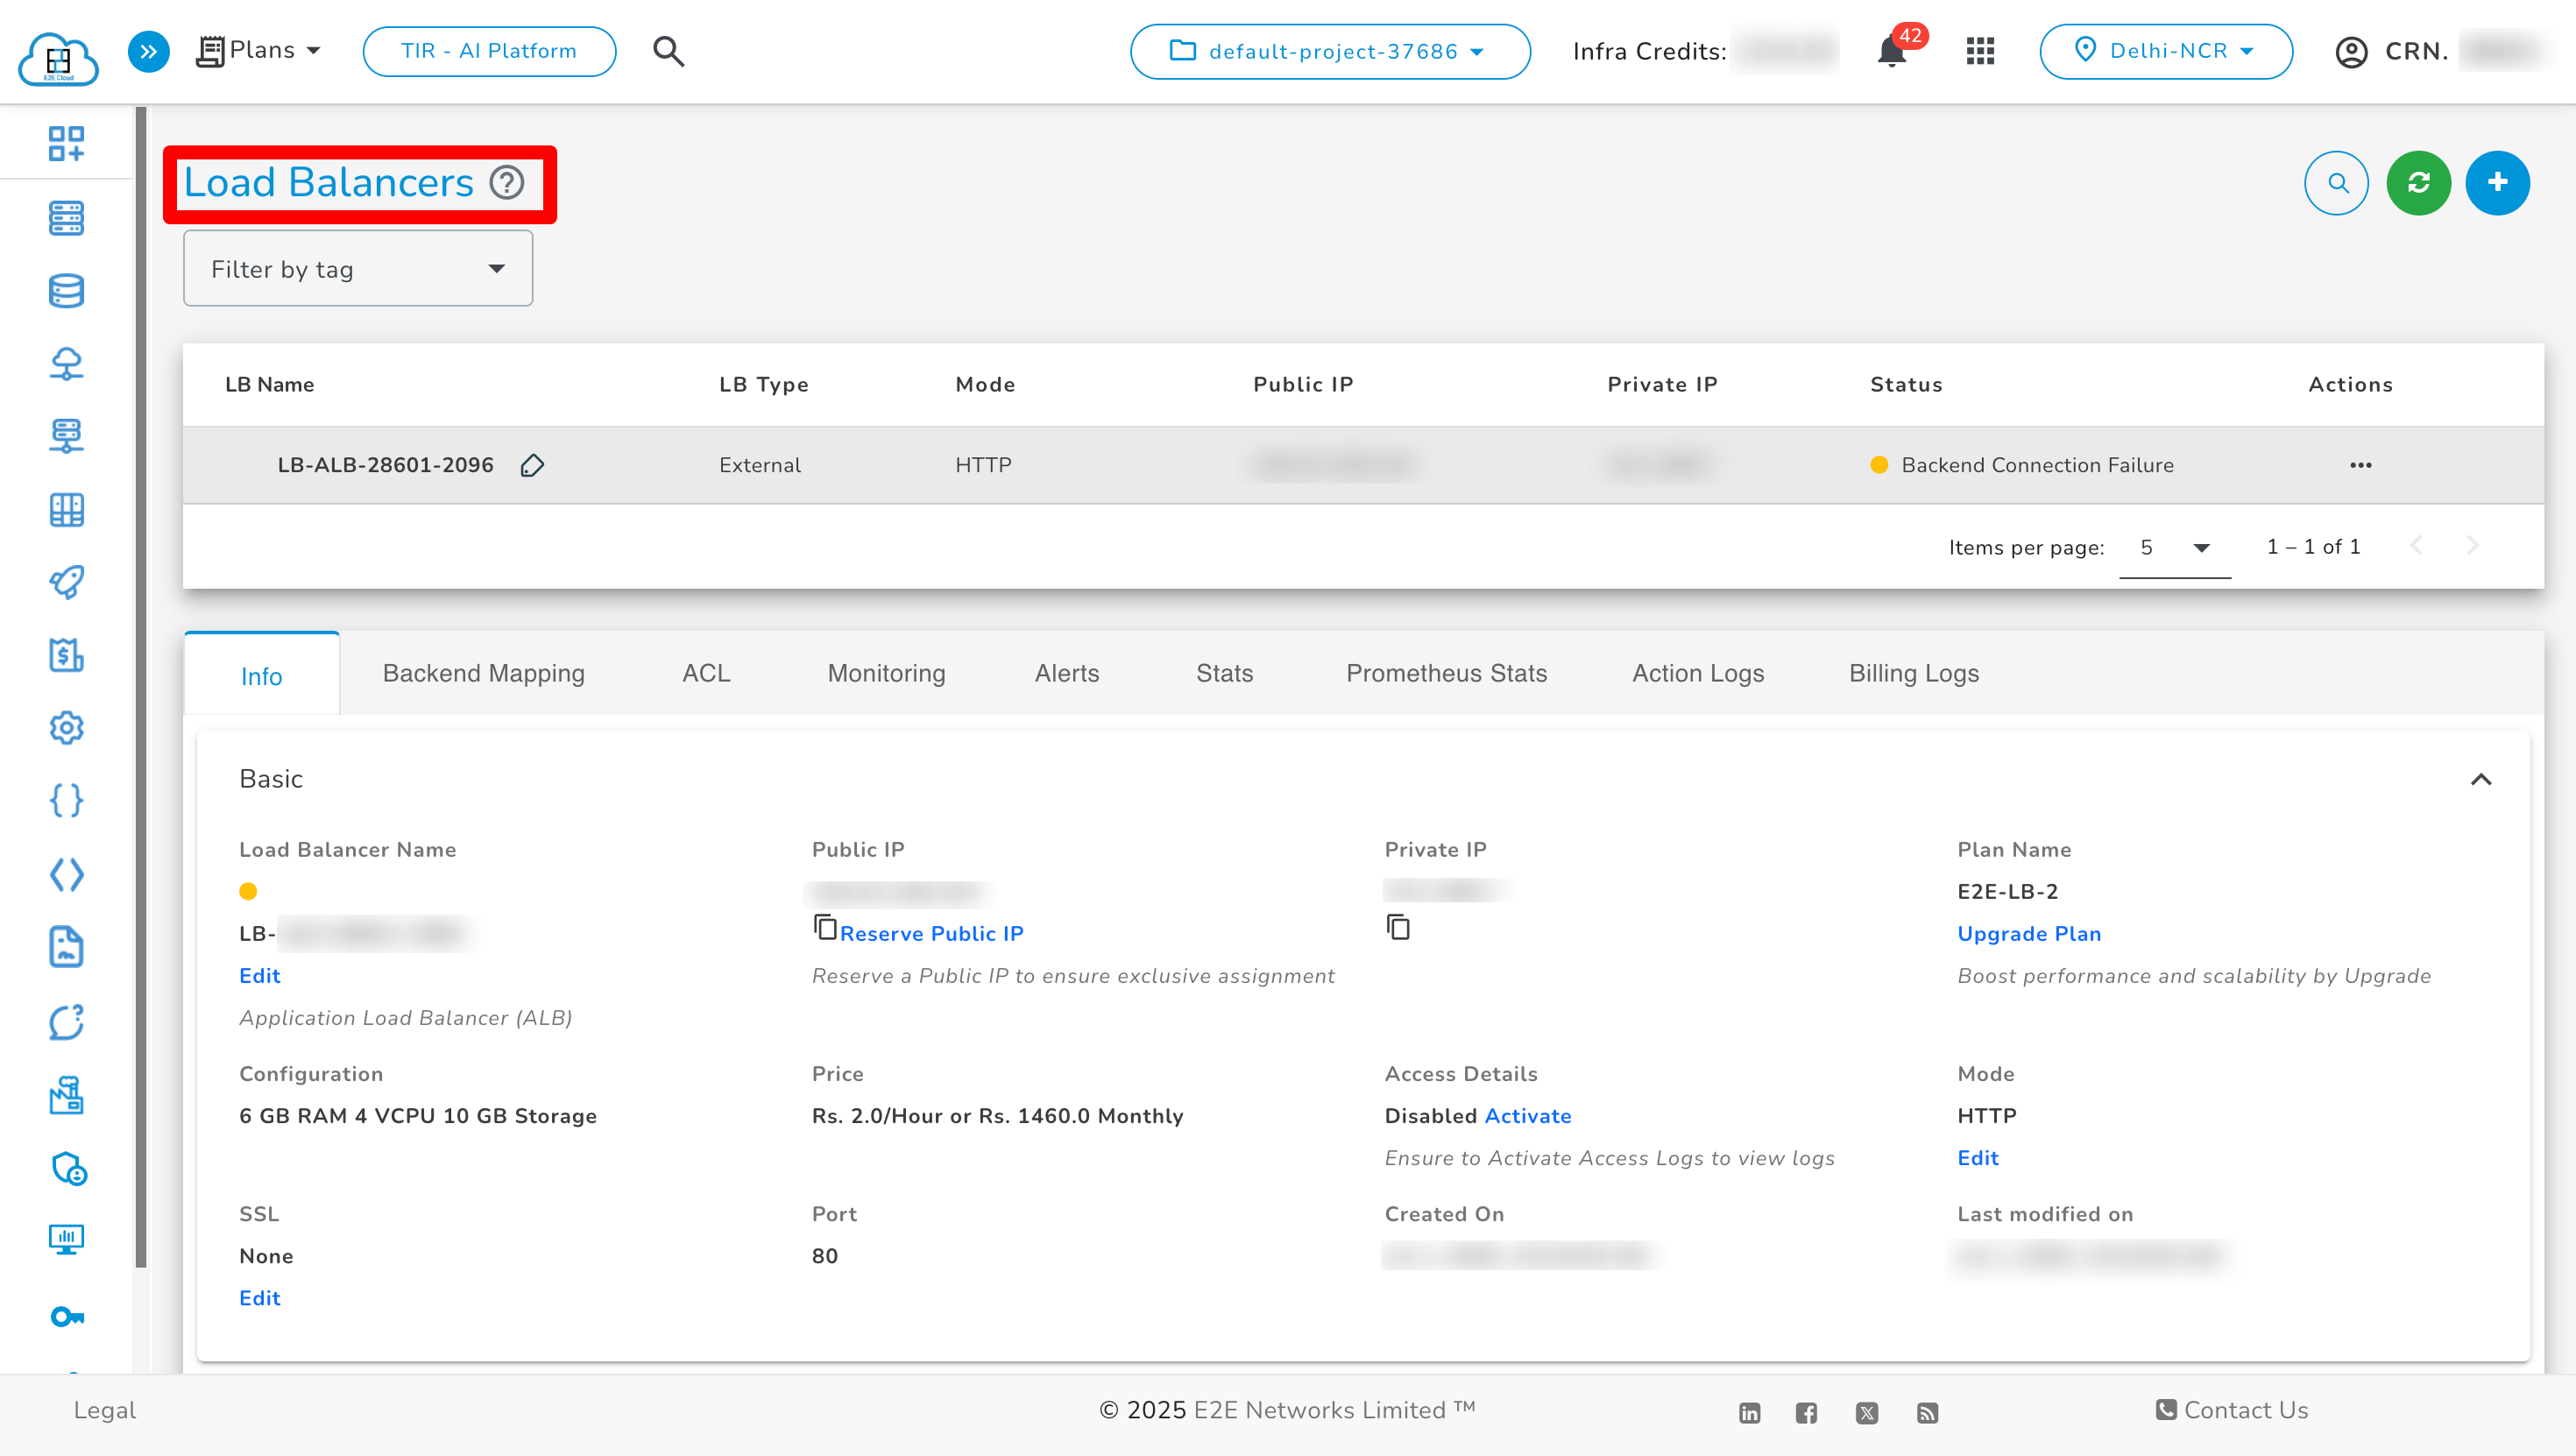
- Clicking on a load balancer redirects you to the 'Manage Load Balancer' page. Your running load balancers will be listed, and you can create an E2E load balancer if none exist.
Monitoring Graphs
Server health monitoring is a free service that provides insights into resource usage across your infrastructure. Different display metrics help track the operational health of your infrastructure. Select the node or load balancer to view the metrics.
General Information
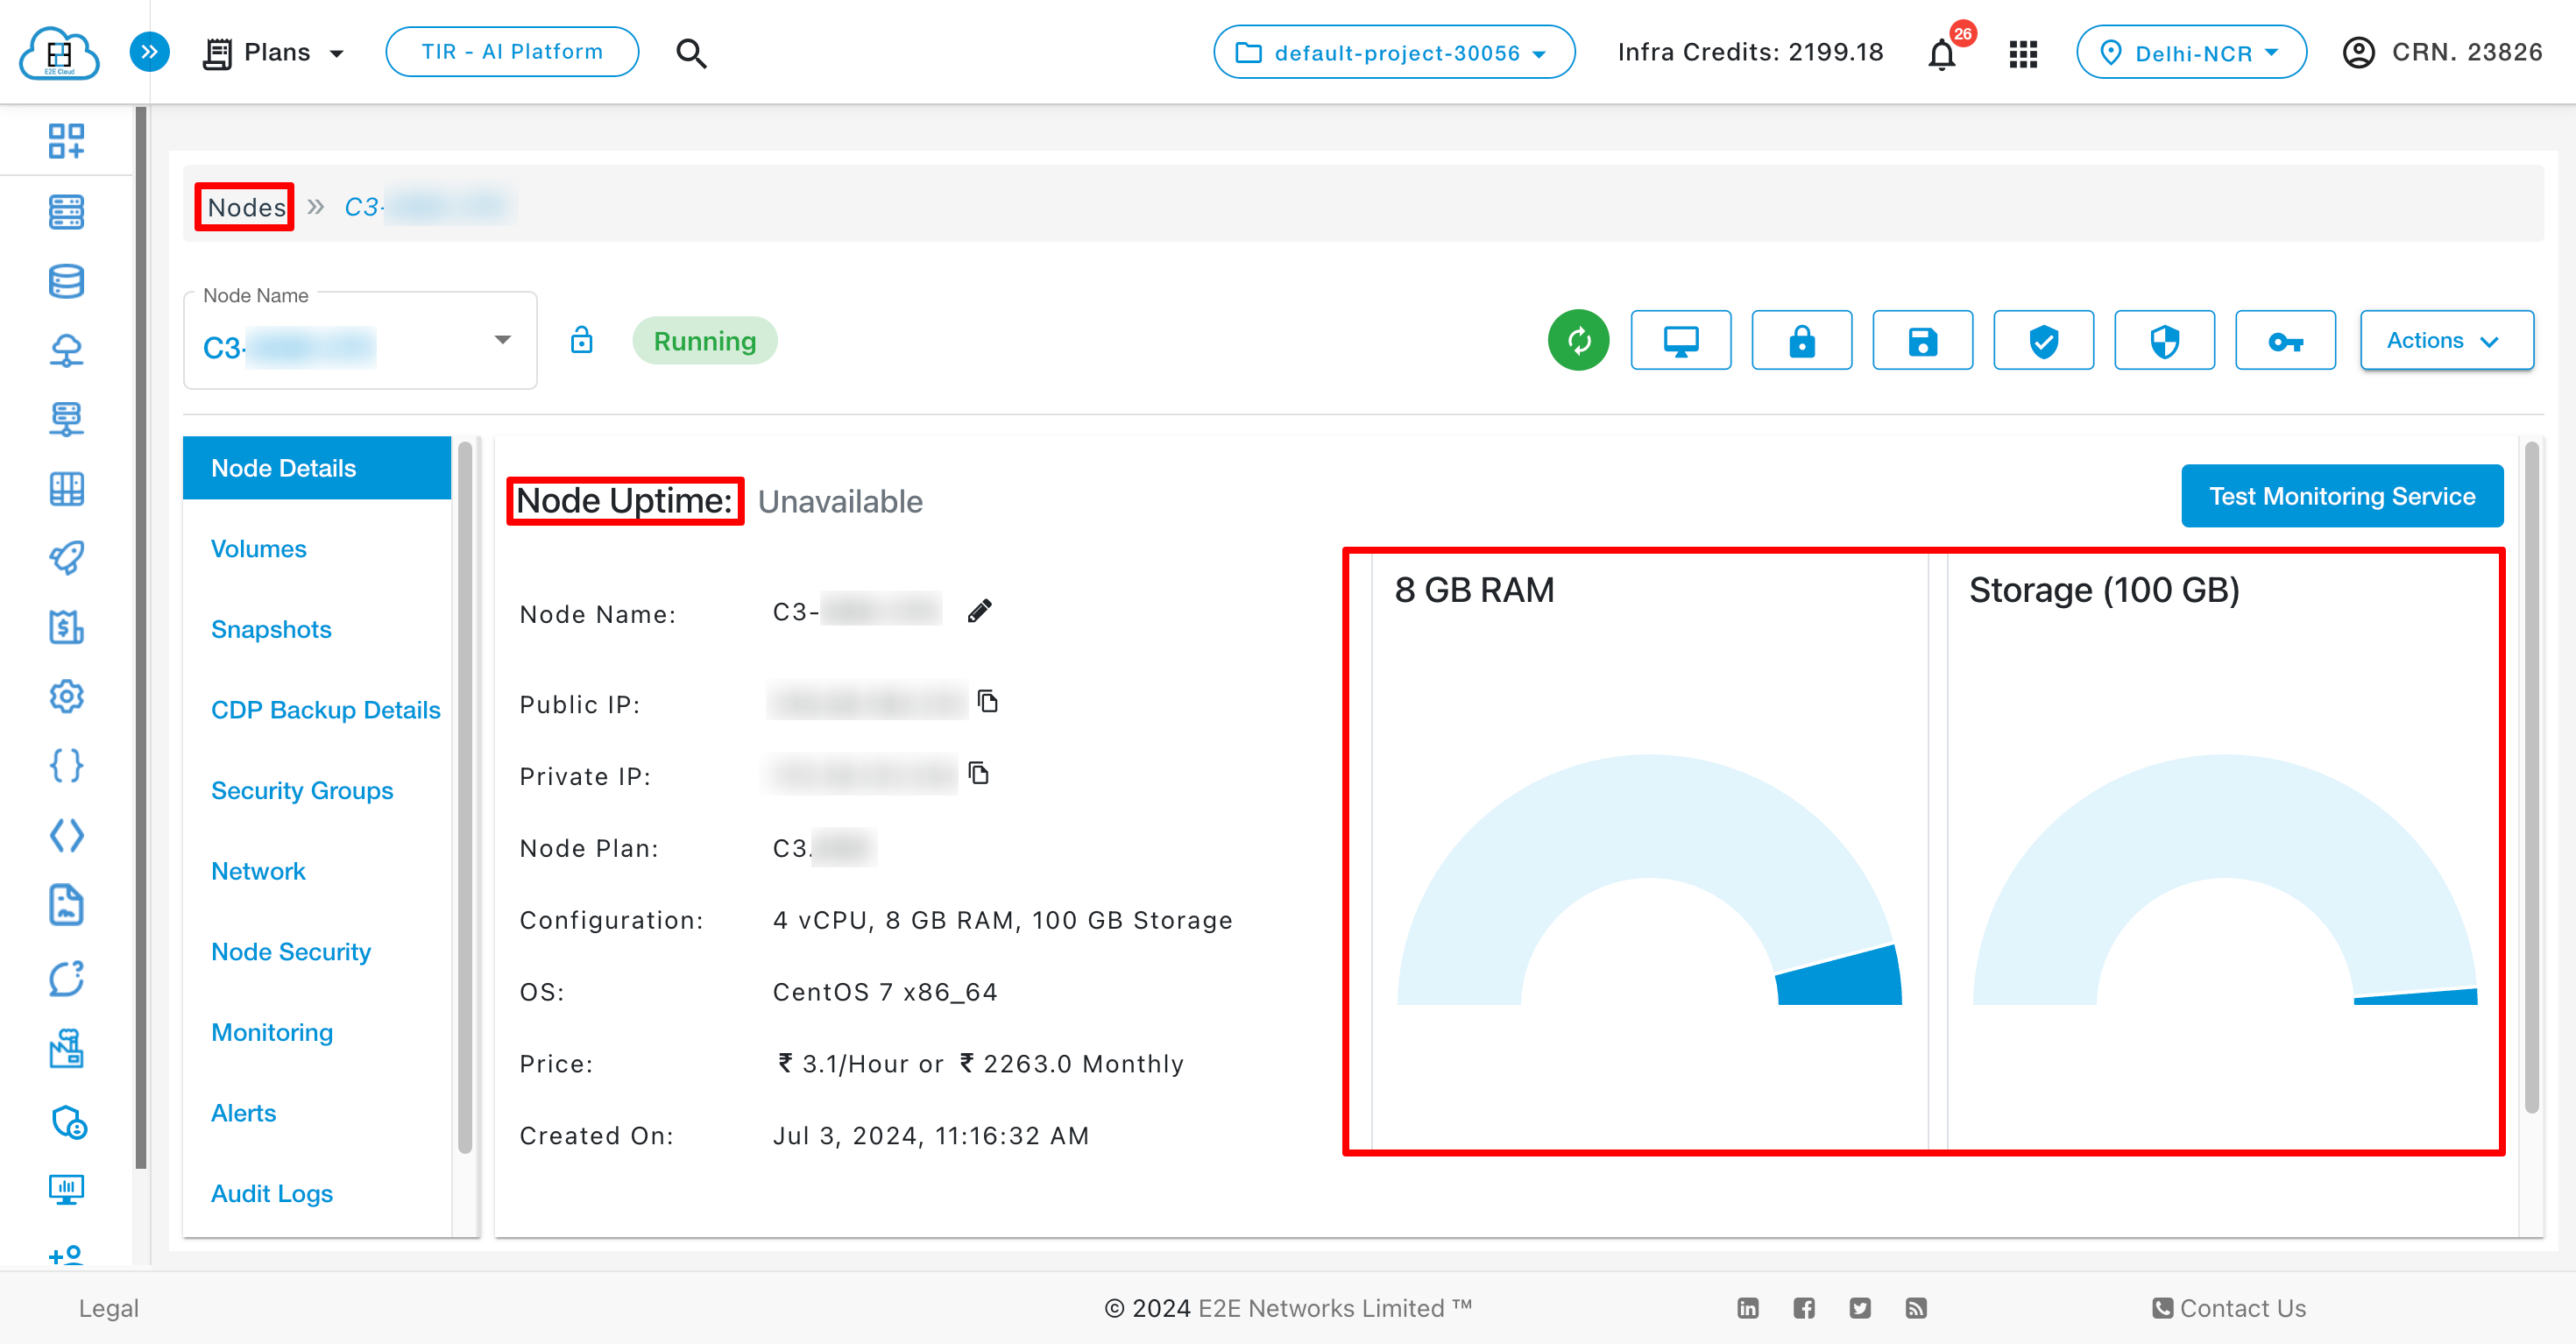
Check Disk and RAM information in the “Node Details” or “Load Balancer Detail” tab.
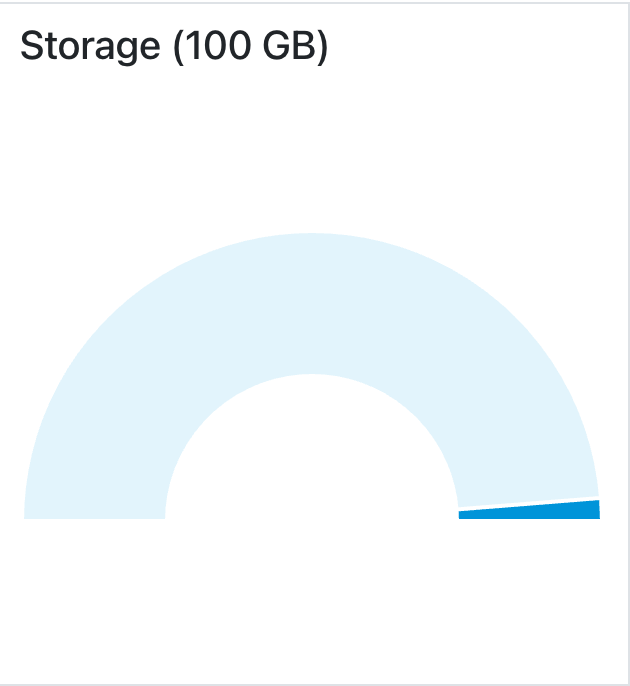
Disk Space
Monitor the used and free space on your disk.
Memory Usage
Monitor the overall used and free RAM.
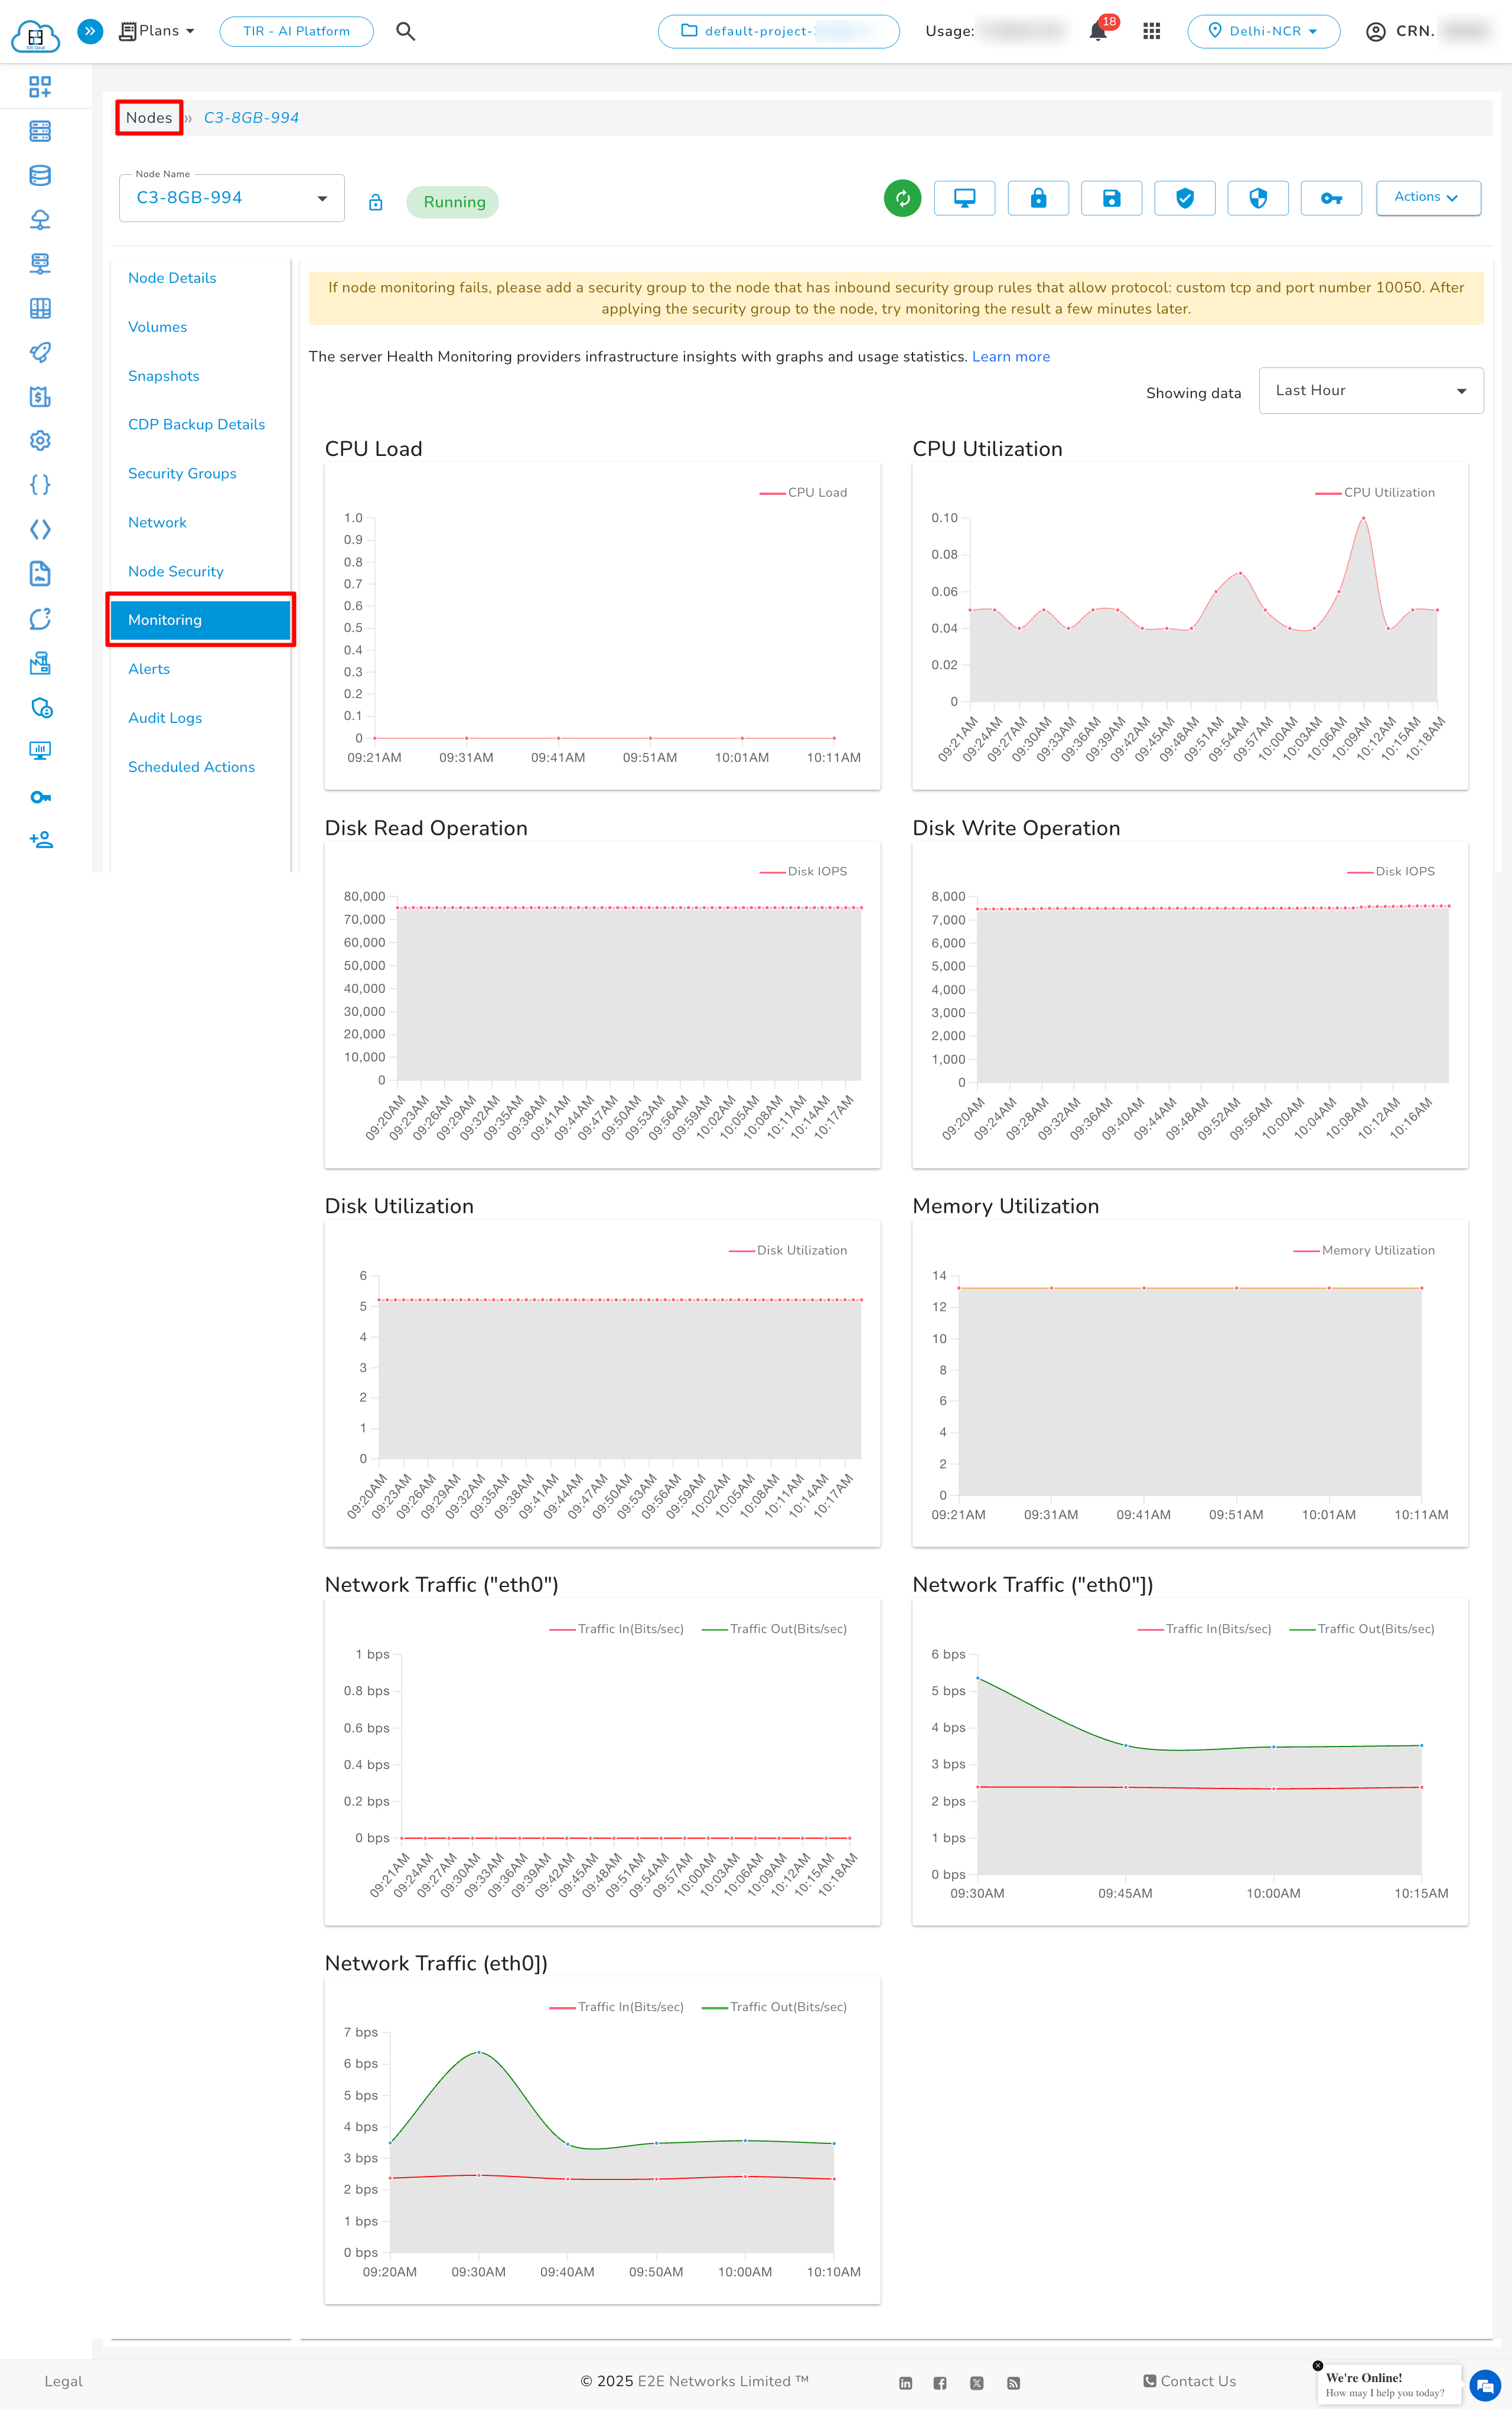
- Click on the ‘Monitoring’ tab to check CPU performance, disk read/write operations, and network traffic statistics.
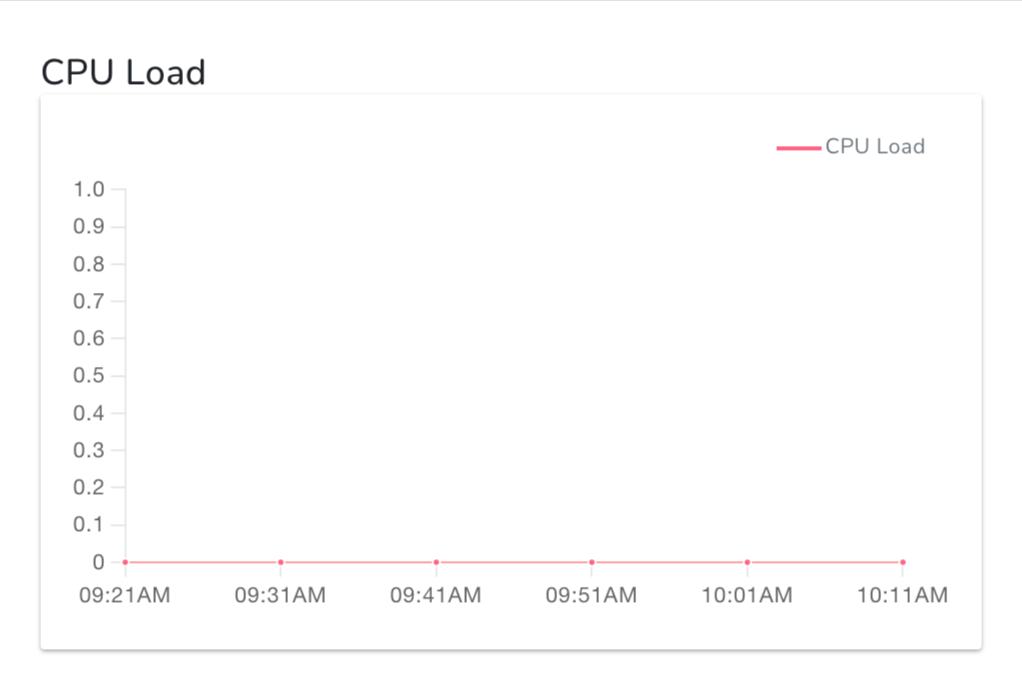
CPU Load
CPU Load expresses how many processes are waiting in the queue to access the computer processor—used to estimate system performance. It can vary according to the type and amount of computing task because some tasks require substantial CPU time which causes slow performance, errors, and increased load while others require less CPU time.
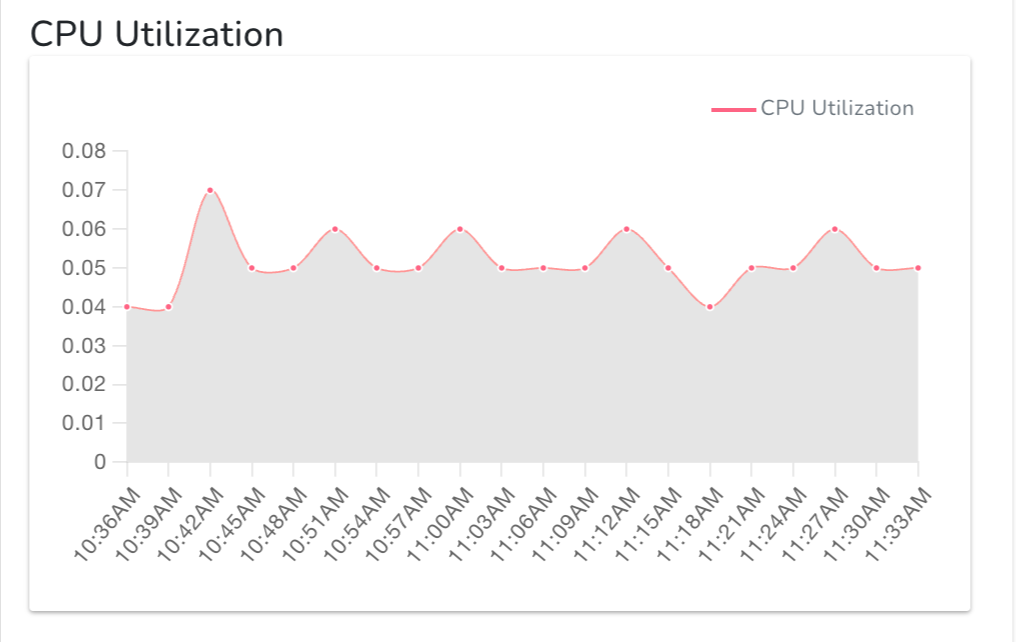
CPU Utilization
CPU Utilization indicates the percentage of total processing power currently in use by your resource. It helps assess how efficiently the CPU is being used and can reveal performance bottlenecks caused by high or consistently maxed-out usage.
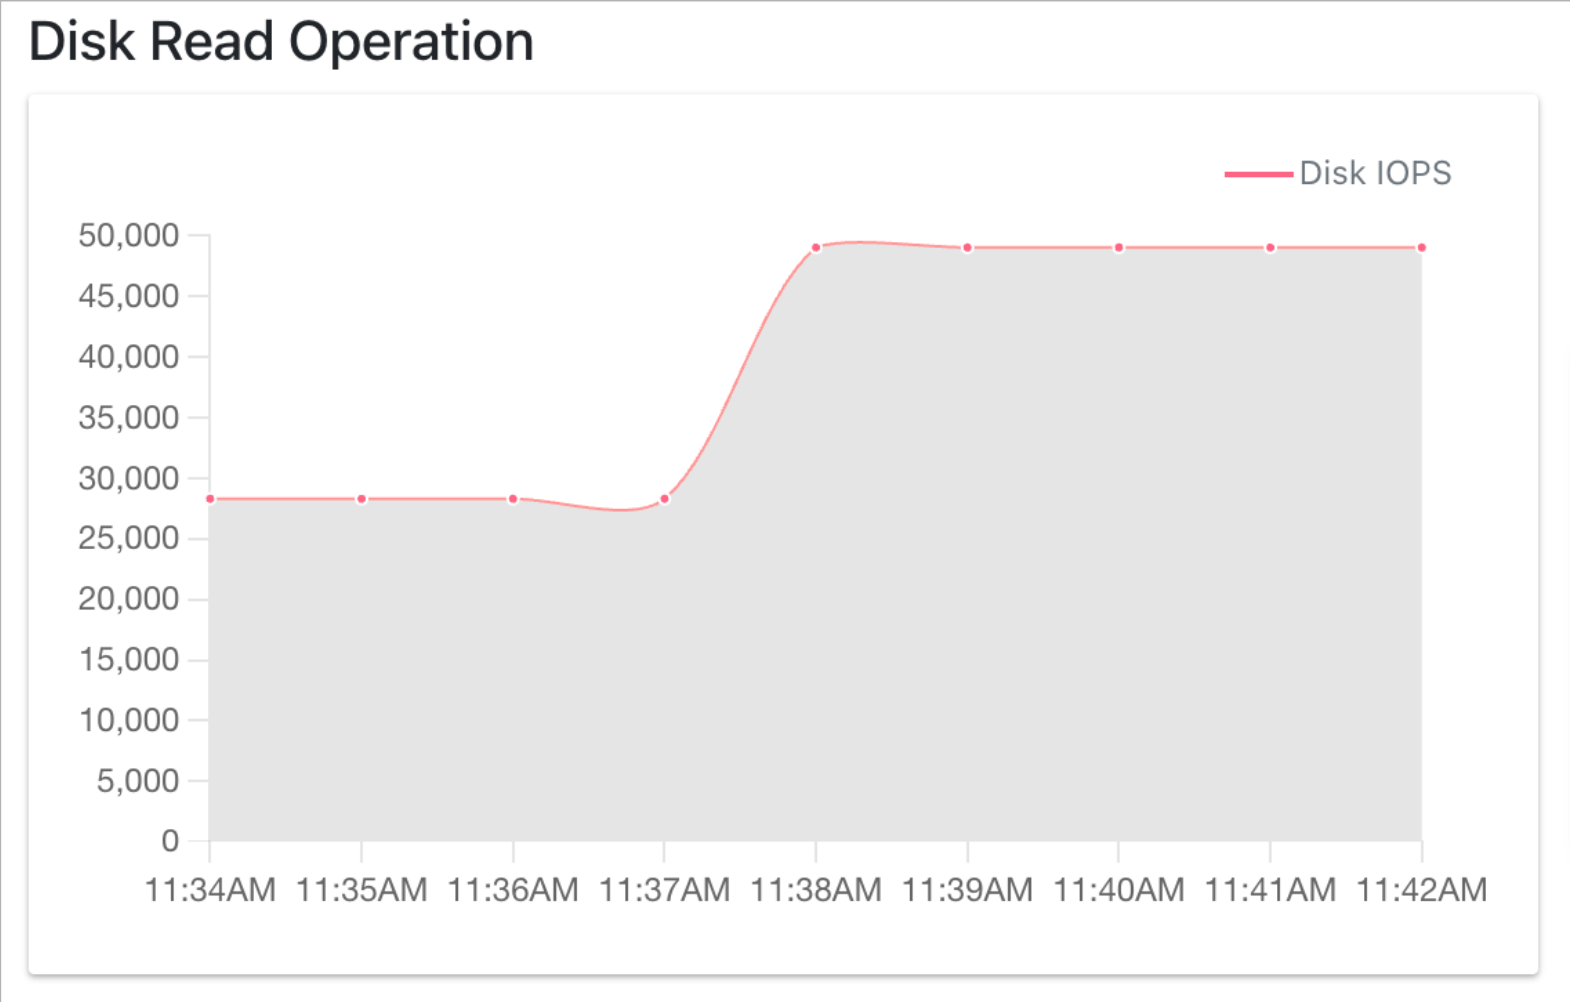
Disk Read Operation
Monitor the IOPS of disk read operation on your resource.
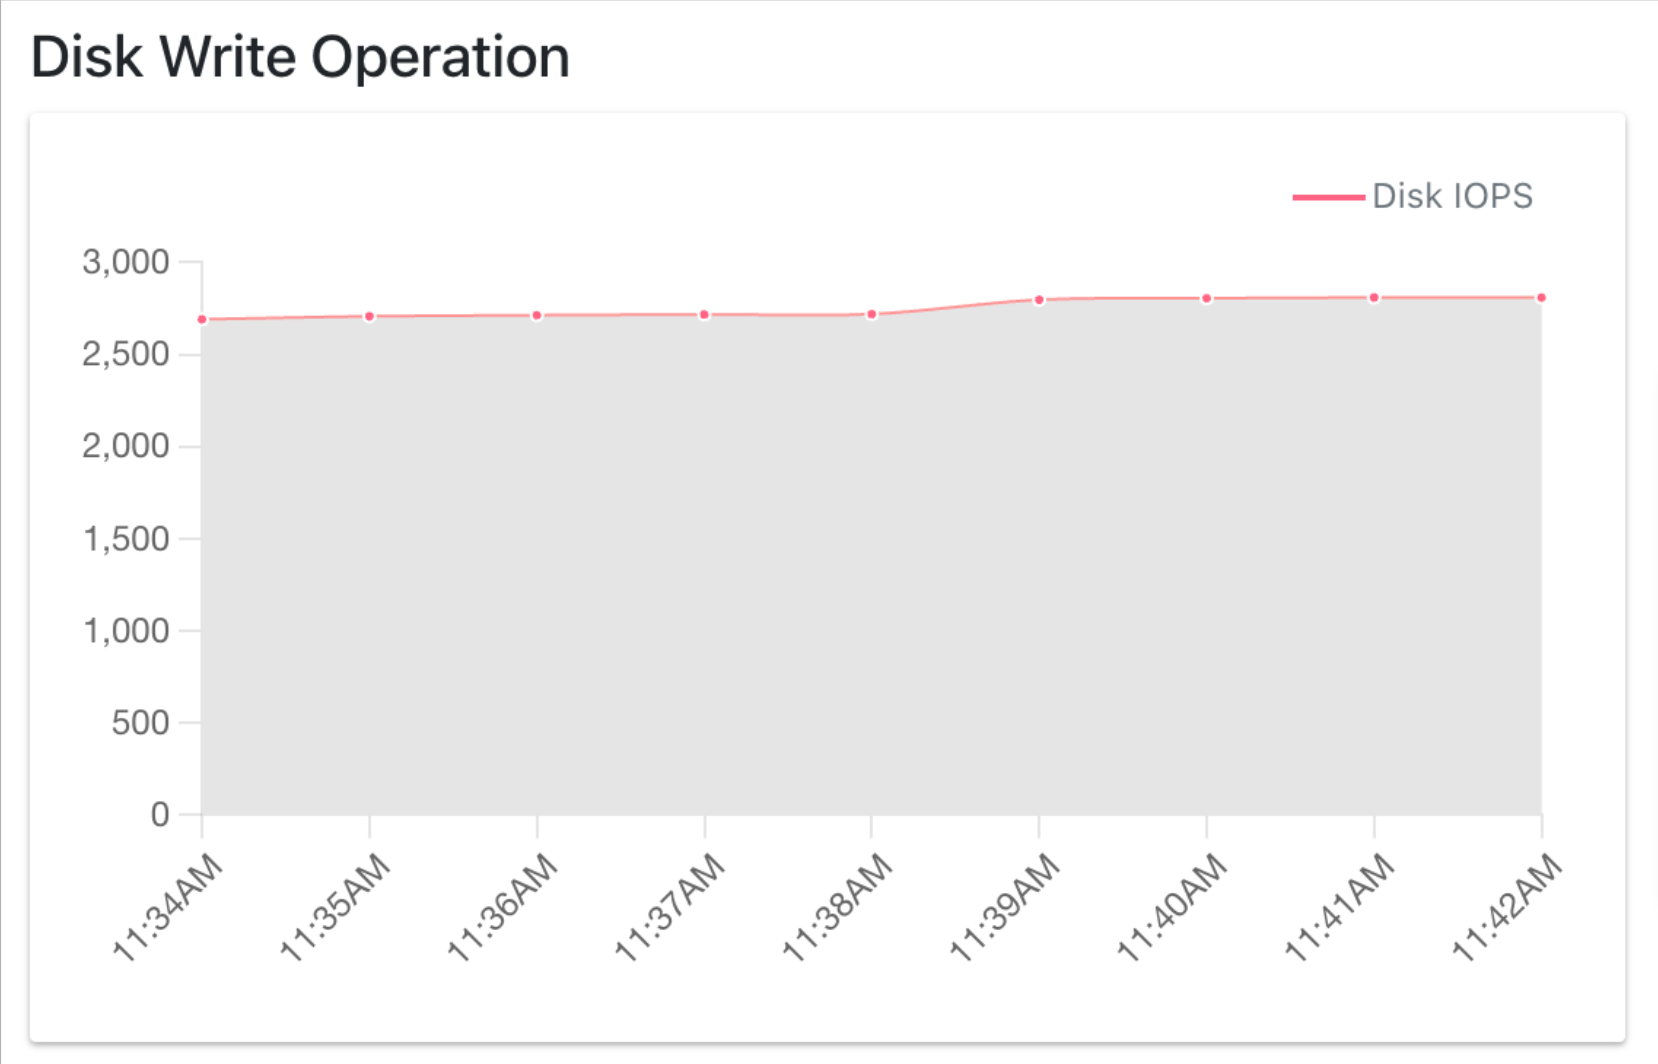
Disk Write Operation
Monitor the IOPS of disk write operation on your resource.
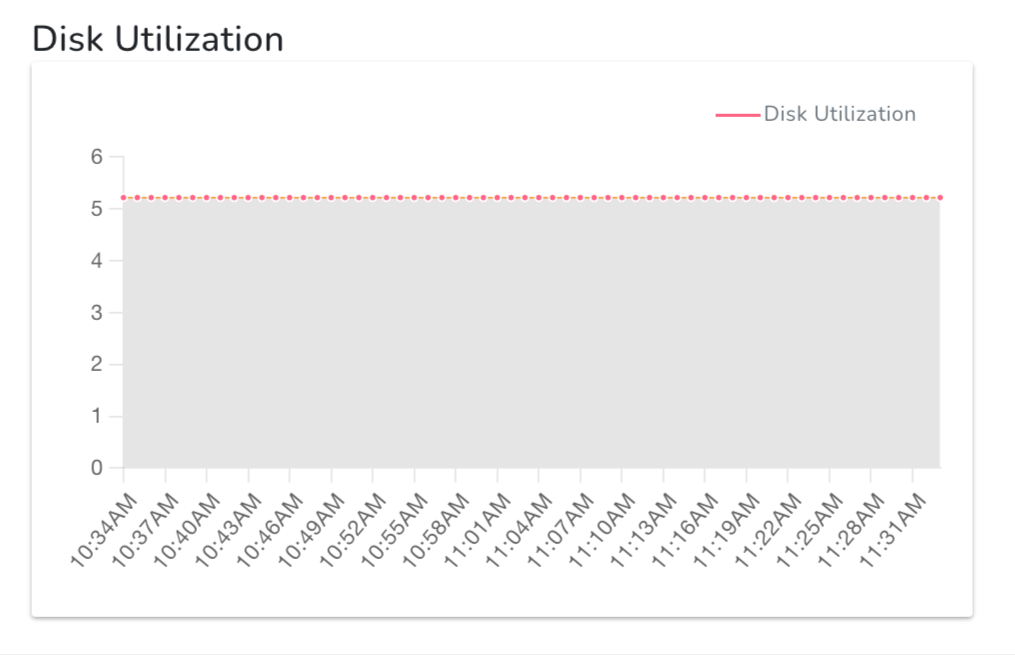
Disk Utilization
Monitor the overall disk utilization of your resource, indicating the percentage of time the disk is actively processing read or write operations.
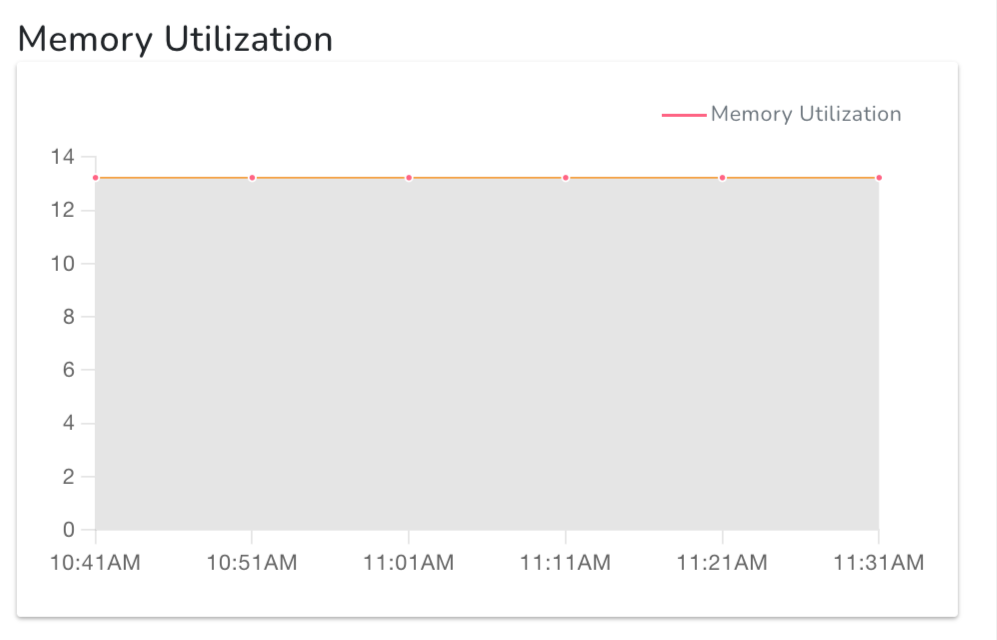
Memory Utilization
Memory Utilization shows the percentage of RAM currently in use by your resource. High memory usage may indicate resource-intensive applications or processes running on the system, and can impact performance if usage approaches the total available memory.
Monitoring Alerts
Server Health Alerts give you the ability to create triggers about your server's performance and resource utilization metrics, which timely notifies you about any subsequent behavior changes. For this, you need to specify the rules to receive notifications or invoke actions when there is any metric change to the underlying infrastructure. The alerting system works by sending automatic response notifications to a user-defined email list when the value of the metric relative to a preset threshold level changes. Server health alerts are created by default for your newly created virtual node or load balancer using the following recommended parameters. You can also set up new alerts by defining trigger parameters as per your use case.
Types of Trigger Parameters:
-
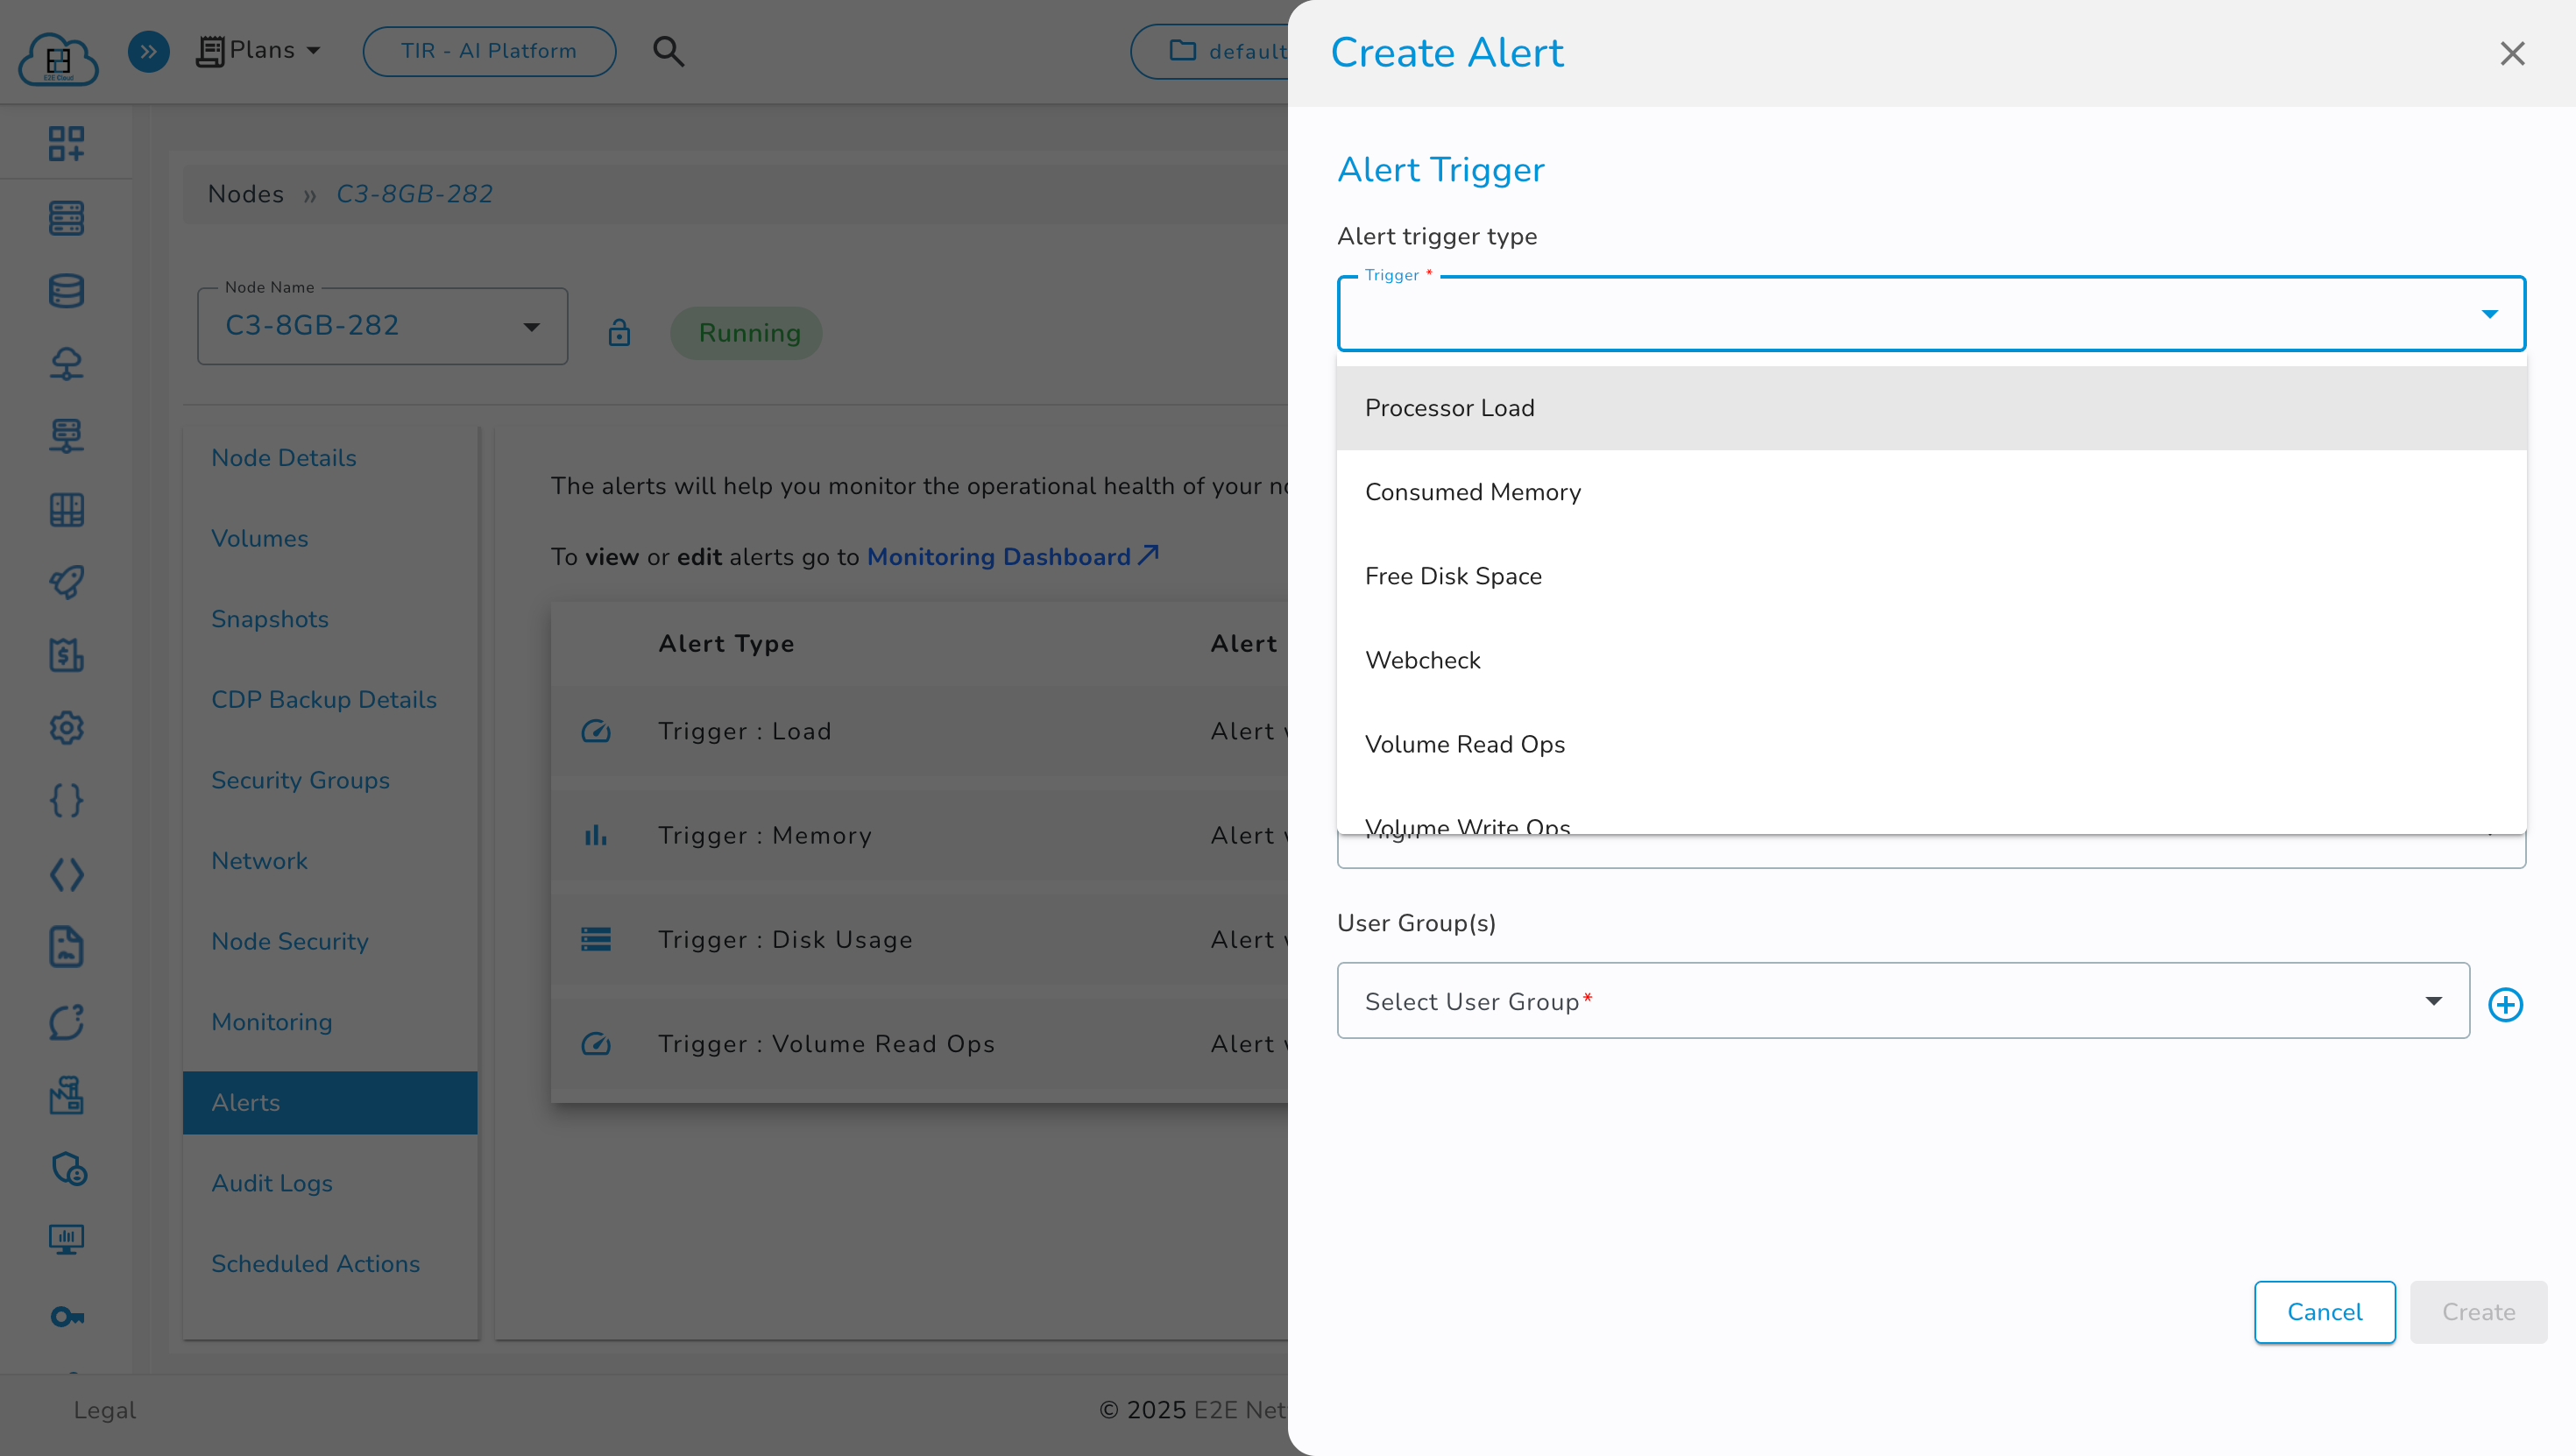
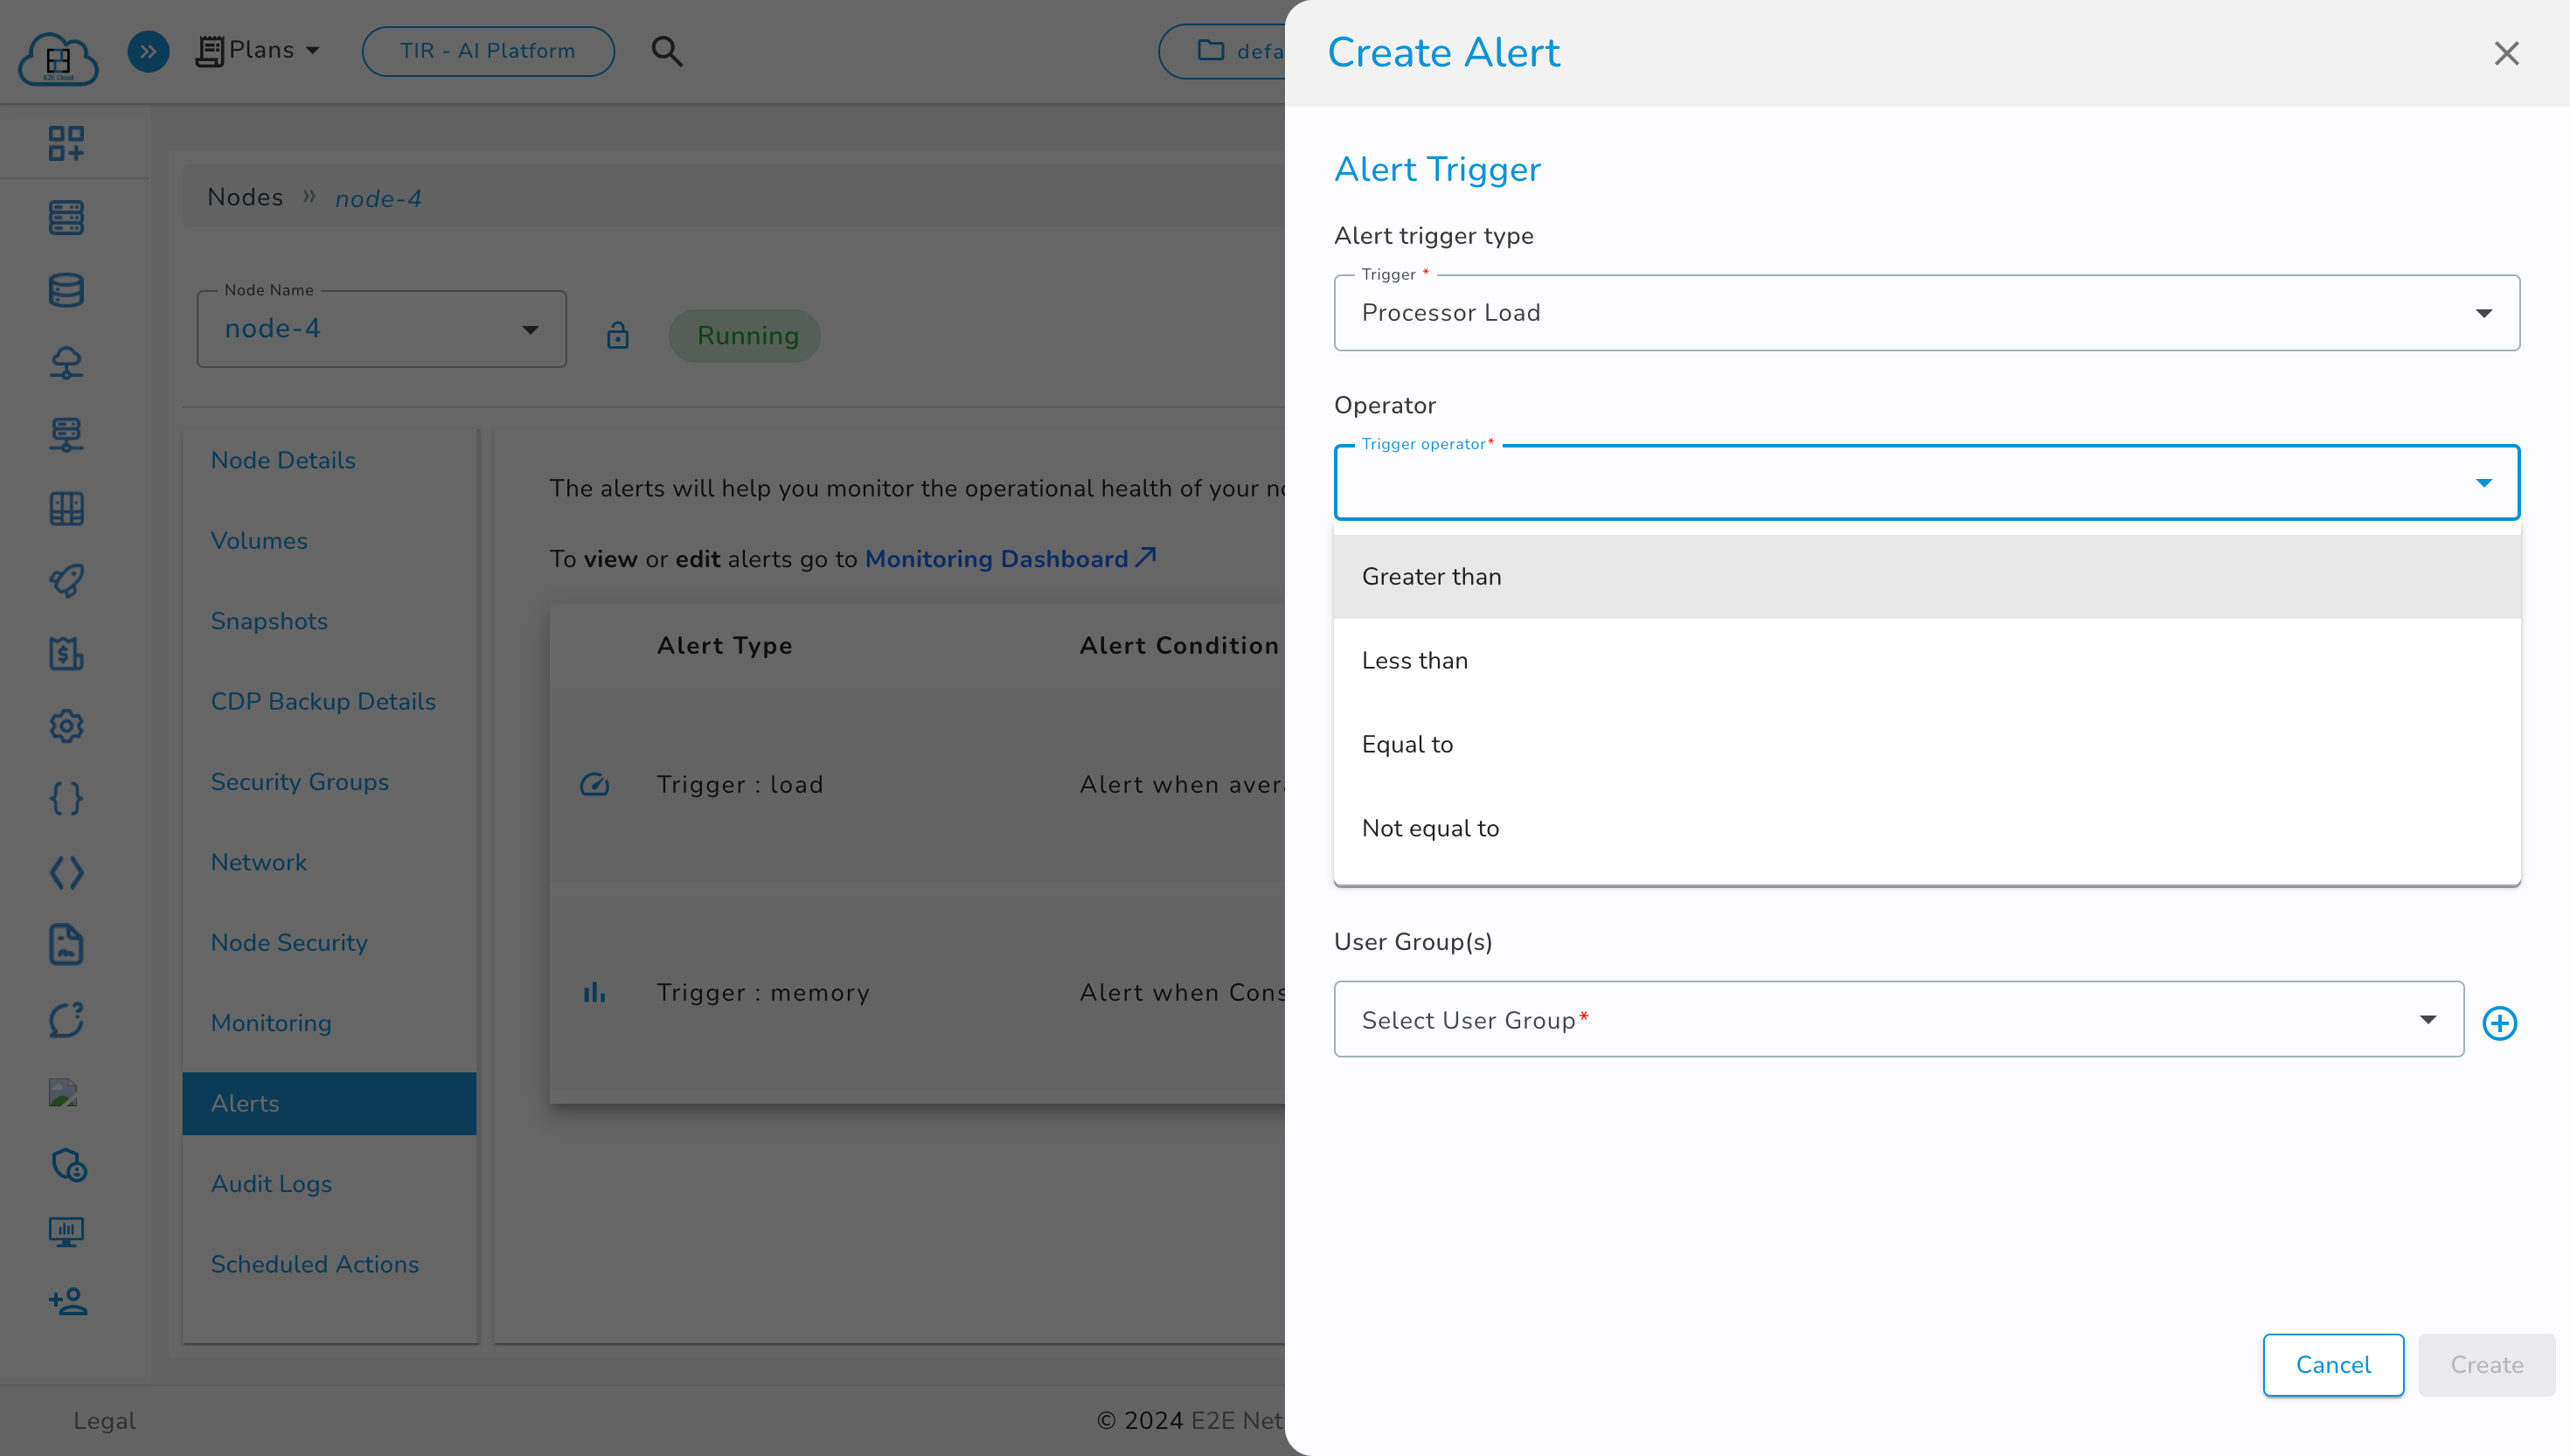
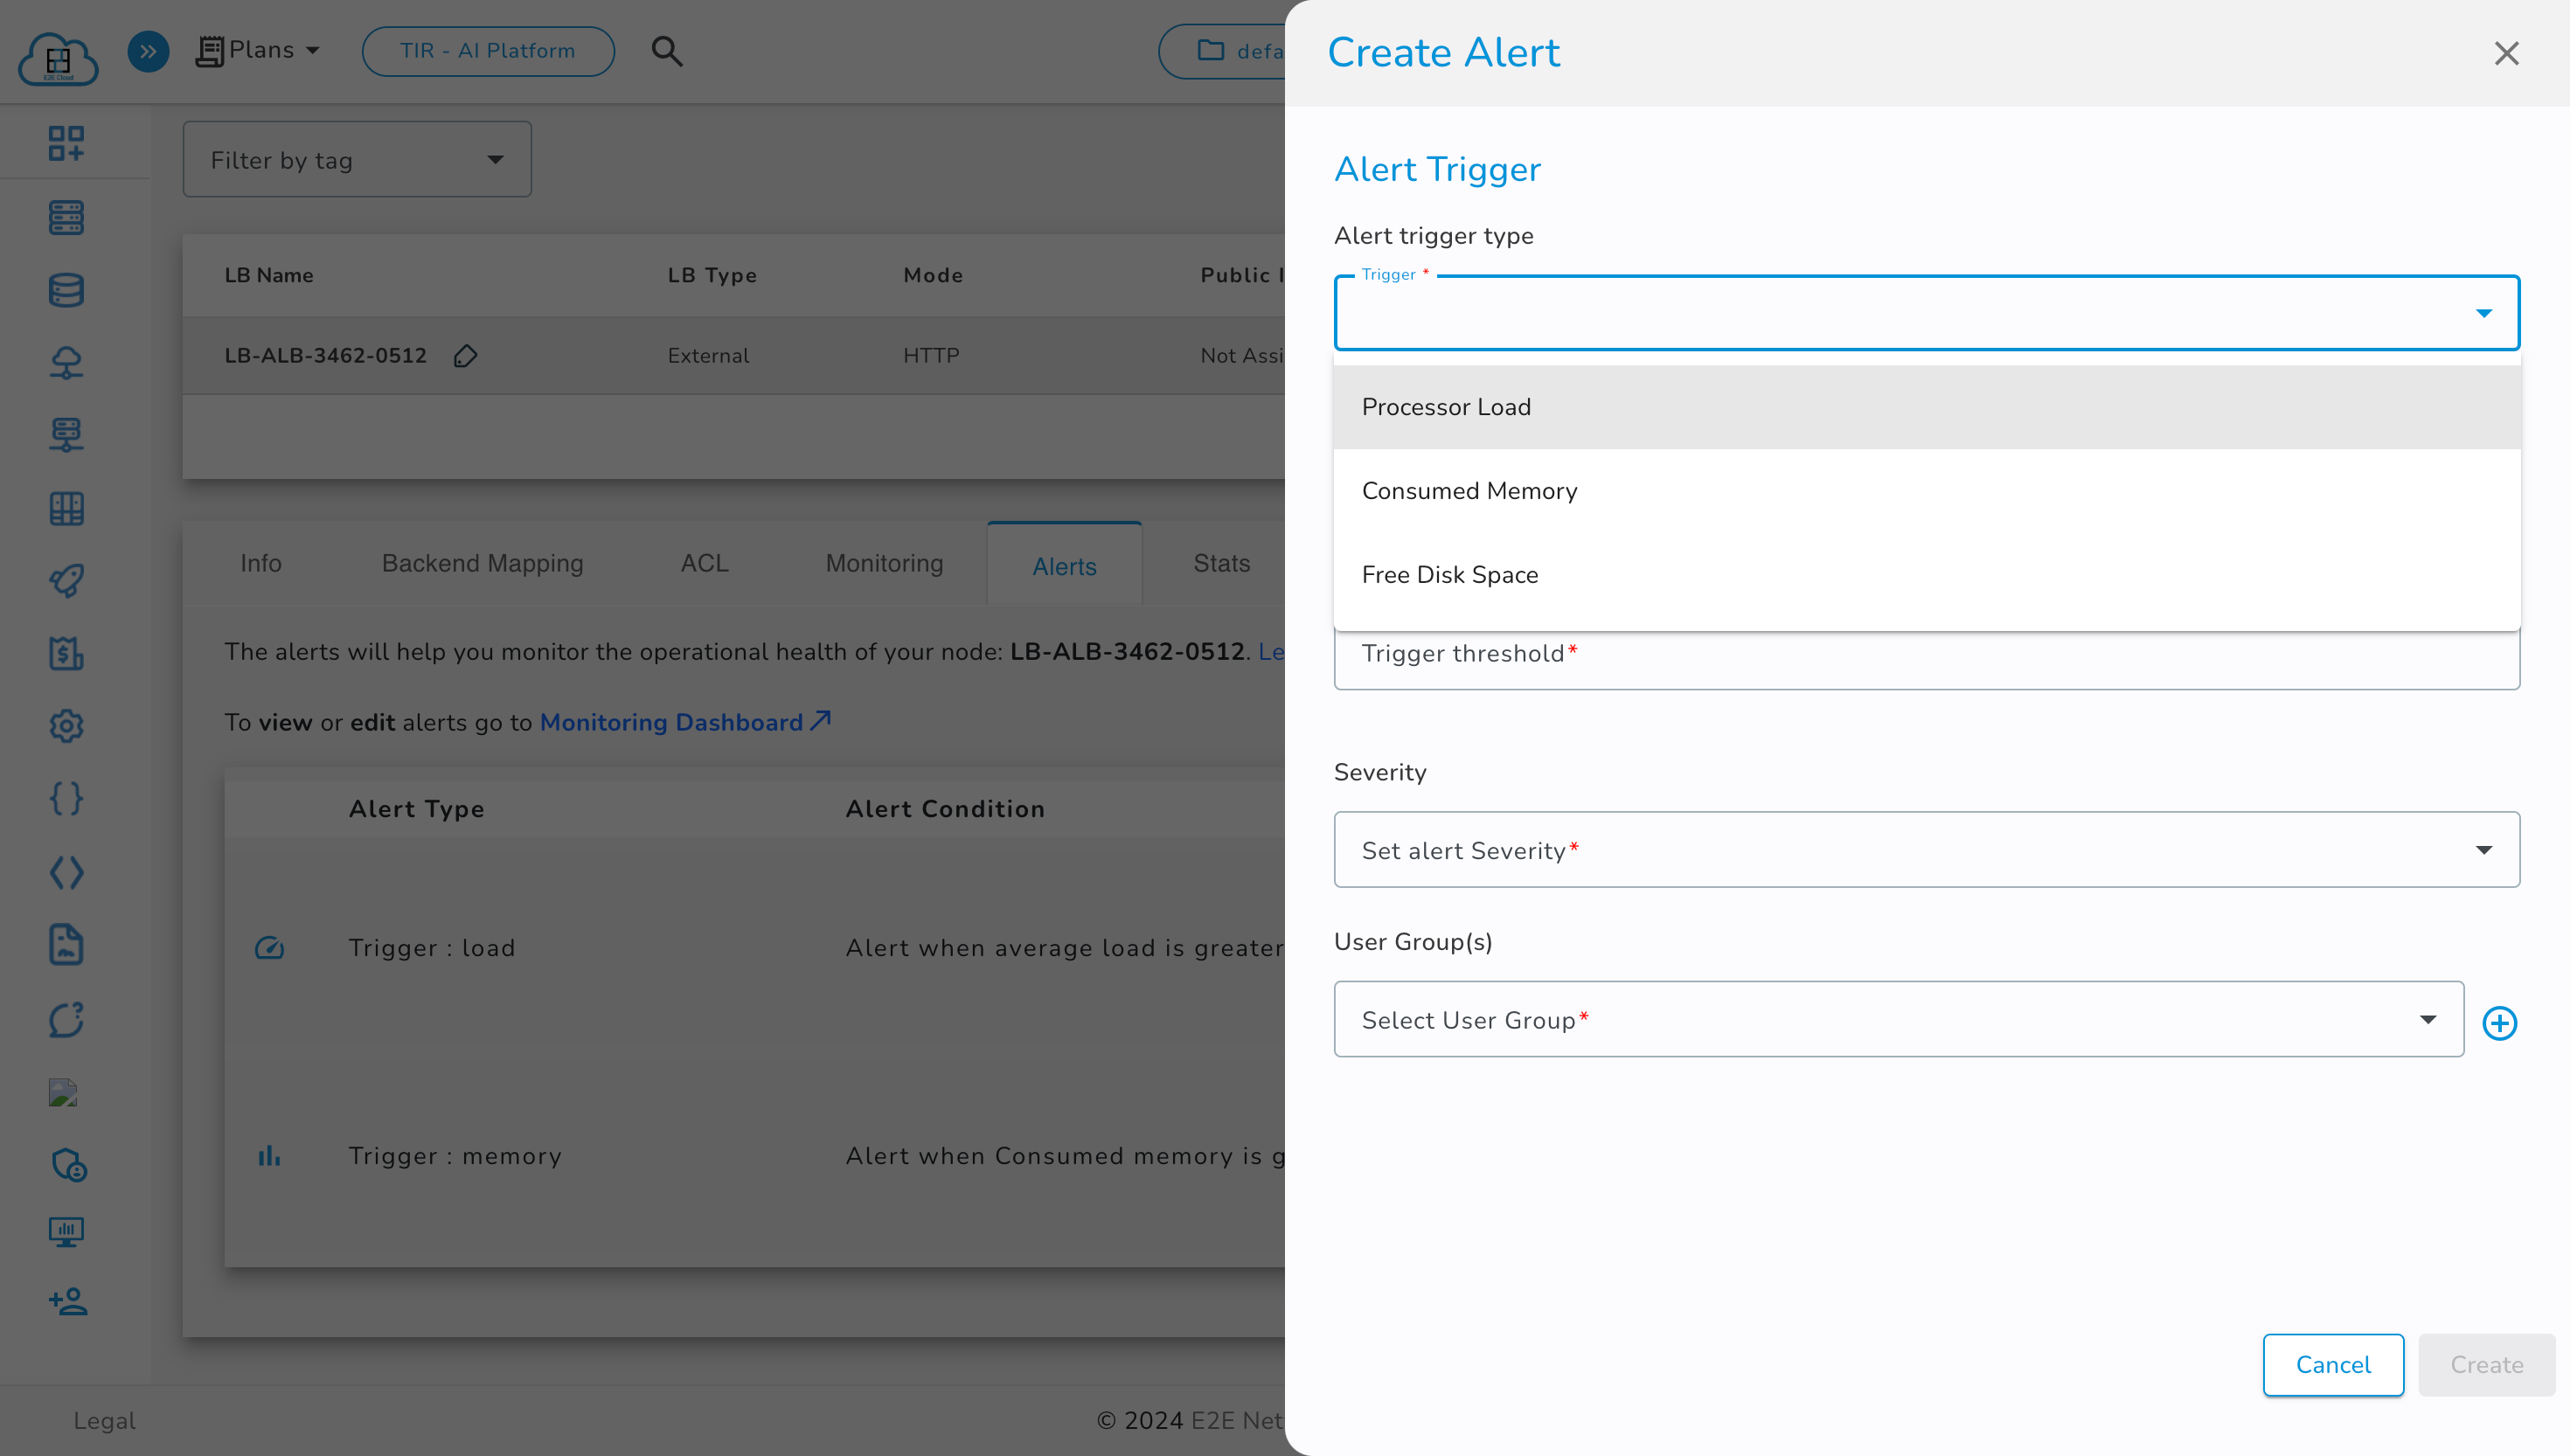
Processor Load: Set the Processor load threshold value (we recommend >10). The alert compares the actual processor load of the node to this threshold and sends notifications when conditions are met (e.g., higher than, less than, equal to, or not equal to the defined value).
-
Consumed Memory: Set the memory utilization level (we recommend <15%). The alert compares actual free and memory utilization of the node against this threshold to decide when to notify.
-
Percentage Free Disk Space: Set the disk space utilization level (we recommend <15%). Notifications are triggered when actual disk space utilization meets the set conditions.
-
Web Check: A web URL monitoring tool that creates alerts on the following conditions:
- Success Code 200: The request was fulfilled.
- Text Match: Web Check crawls a given URL and verifies text. Notifications are sent if differences from the standard text are detected.
- Max Web Check Limit: 5 URLs.
-
Volume Read Ops
Monitors the number of read operations on a storage volume.Set a threshold to receive alerts when read operations exceed or fall below defined limits useful for detecting performance bottlenecks or unusual activity. -
Volume Write Ops
Tracks the number of write operations on a storage volume.Configure thresholds to get notified when write activity crosses expected bounds helpful for identifying potential I/O spikes or disk usage issues.
Setup Monitoring Alert for Node
-
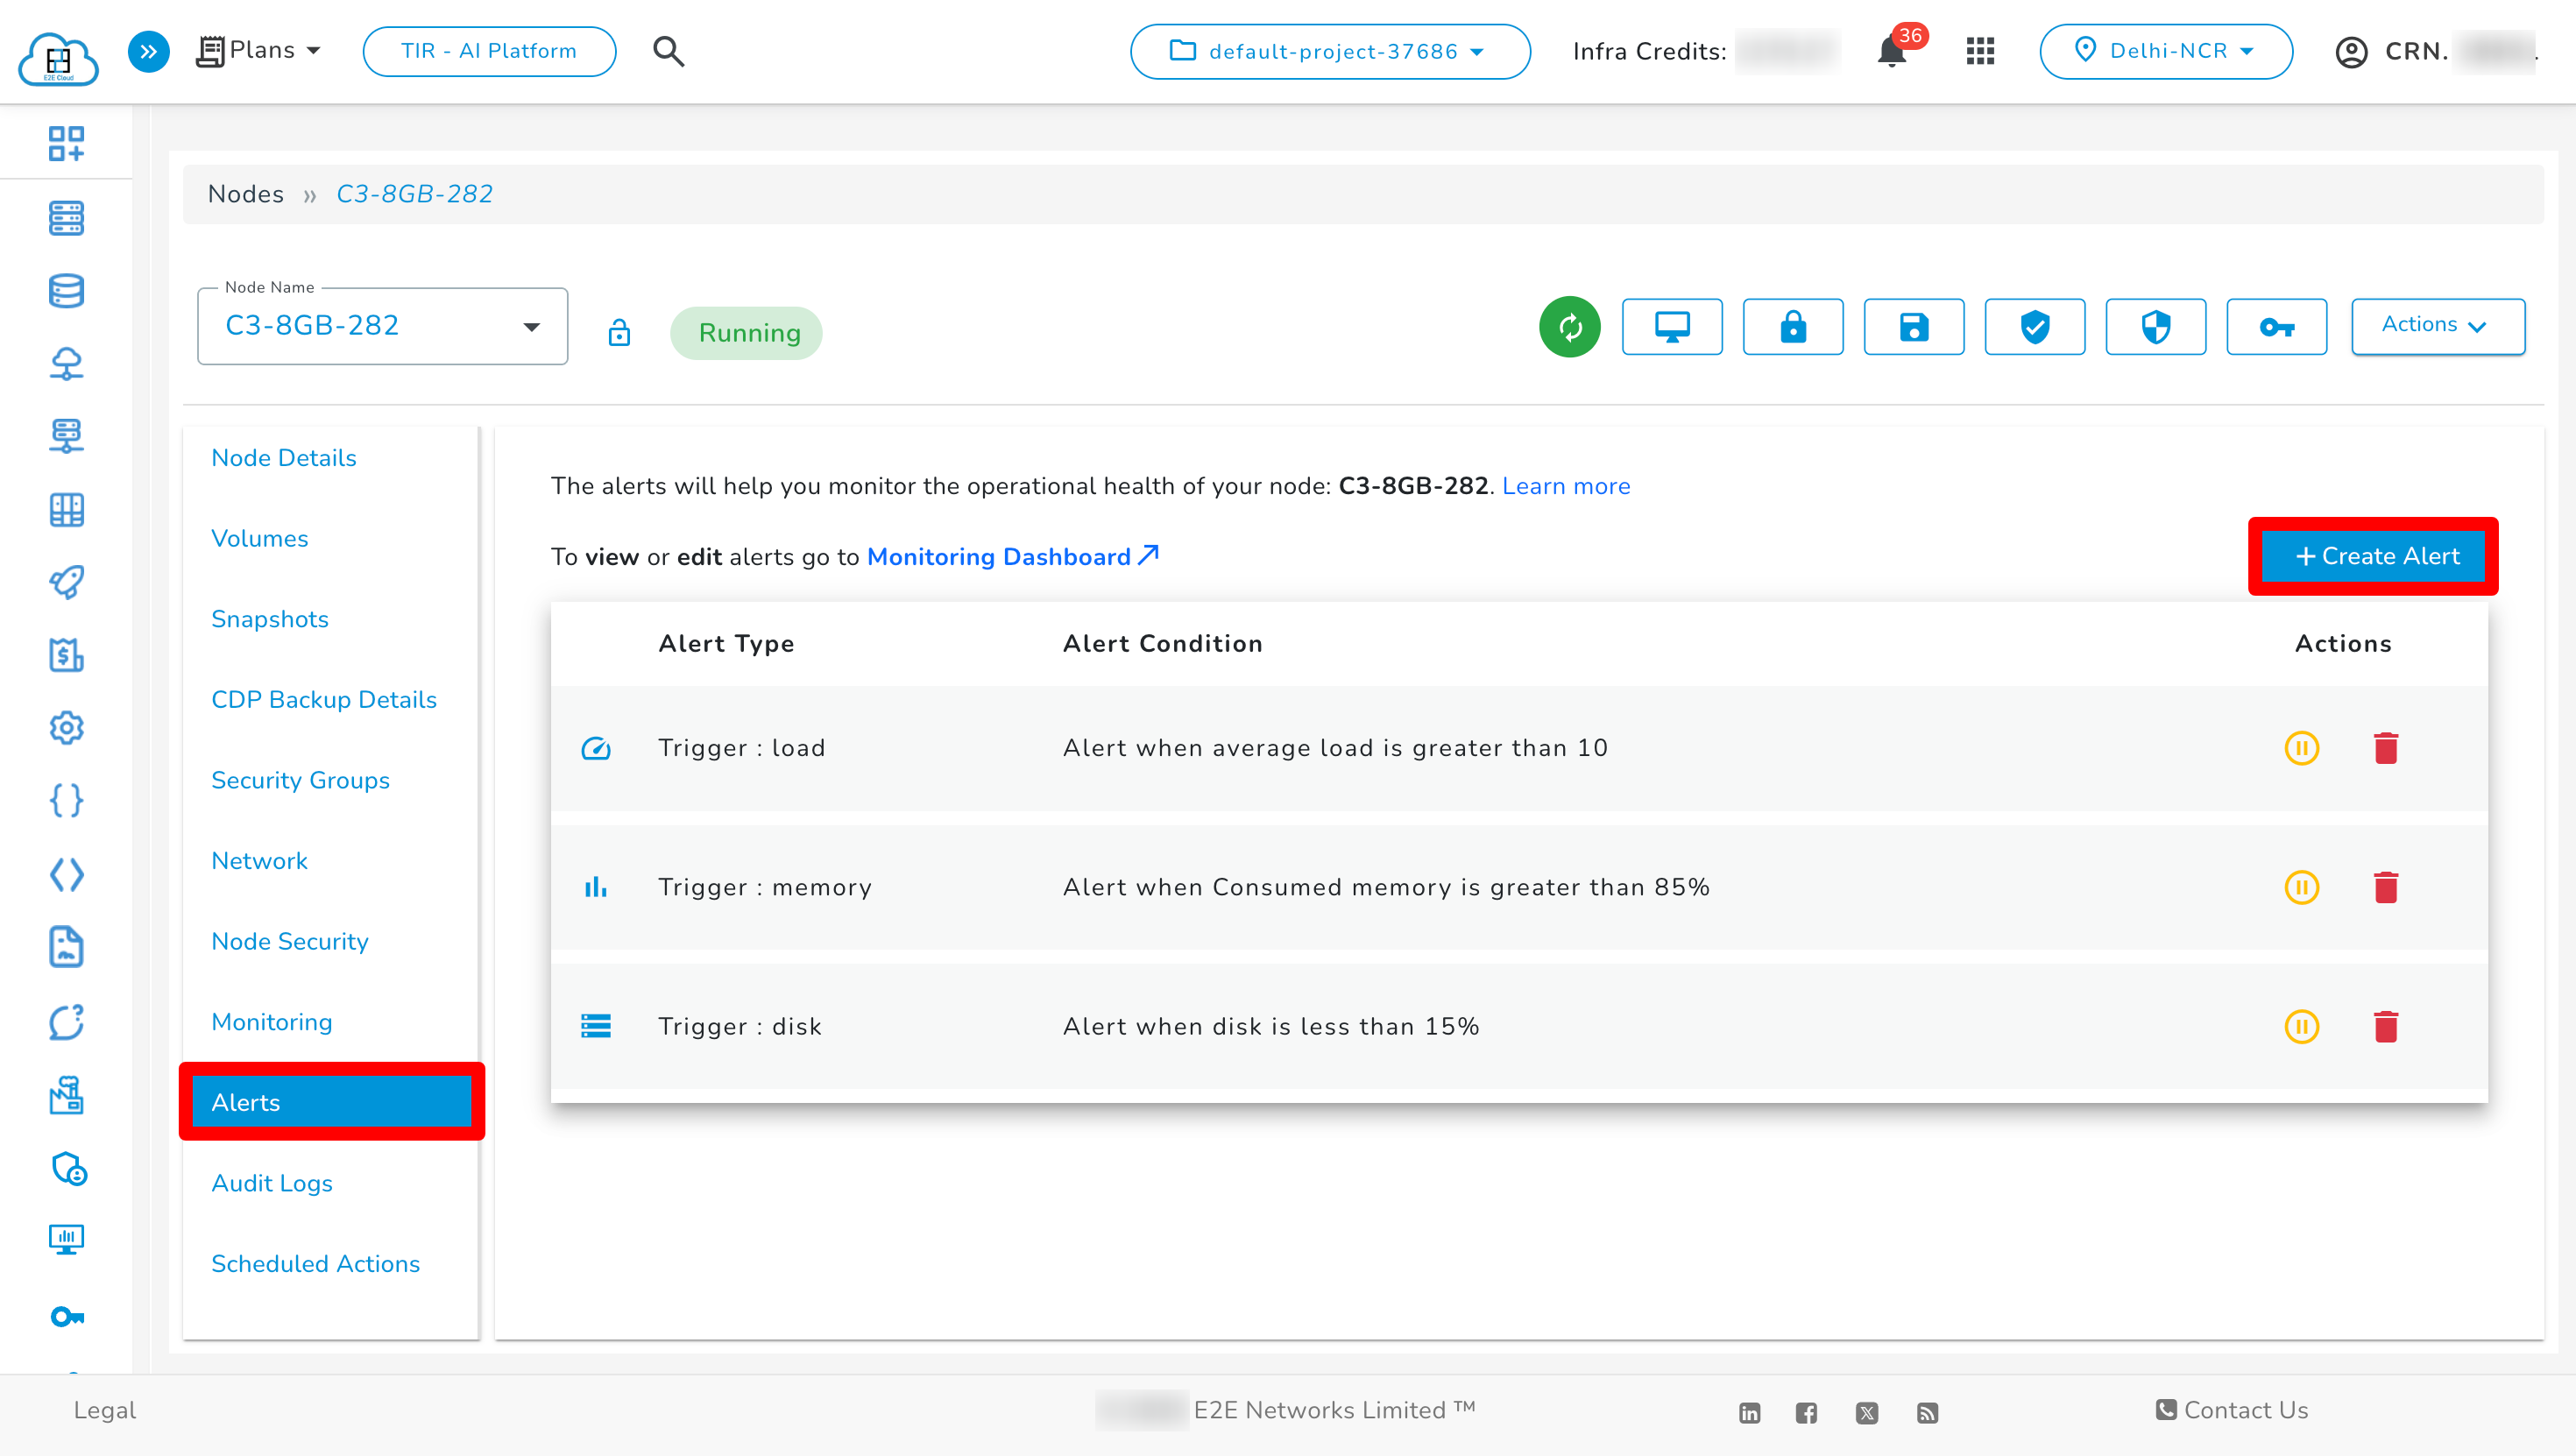
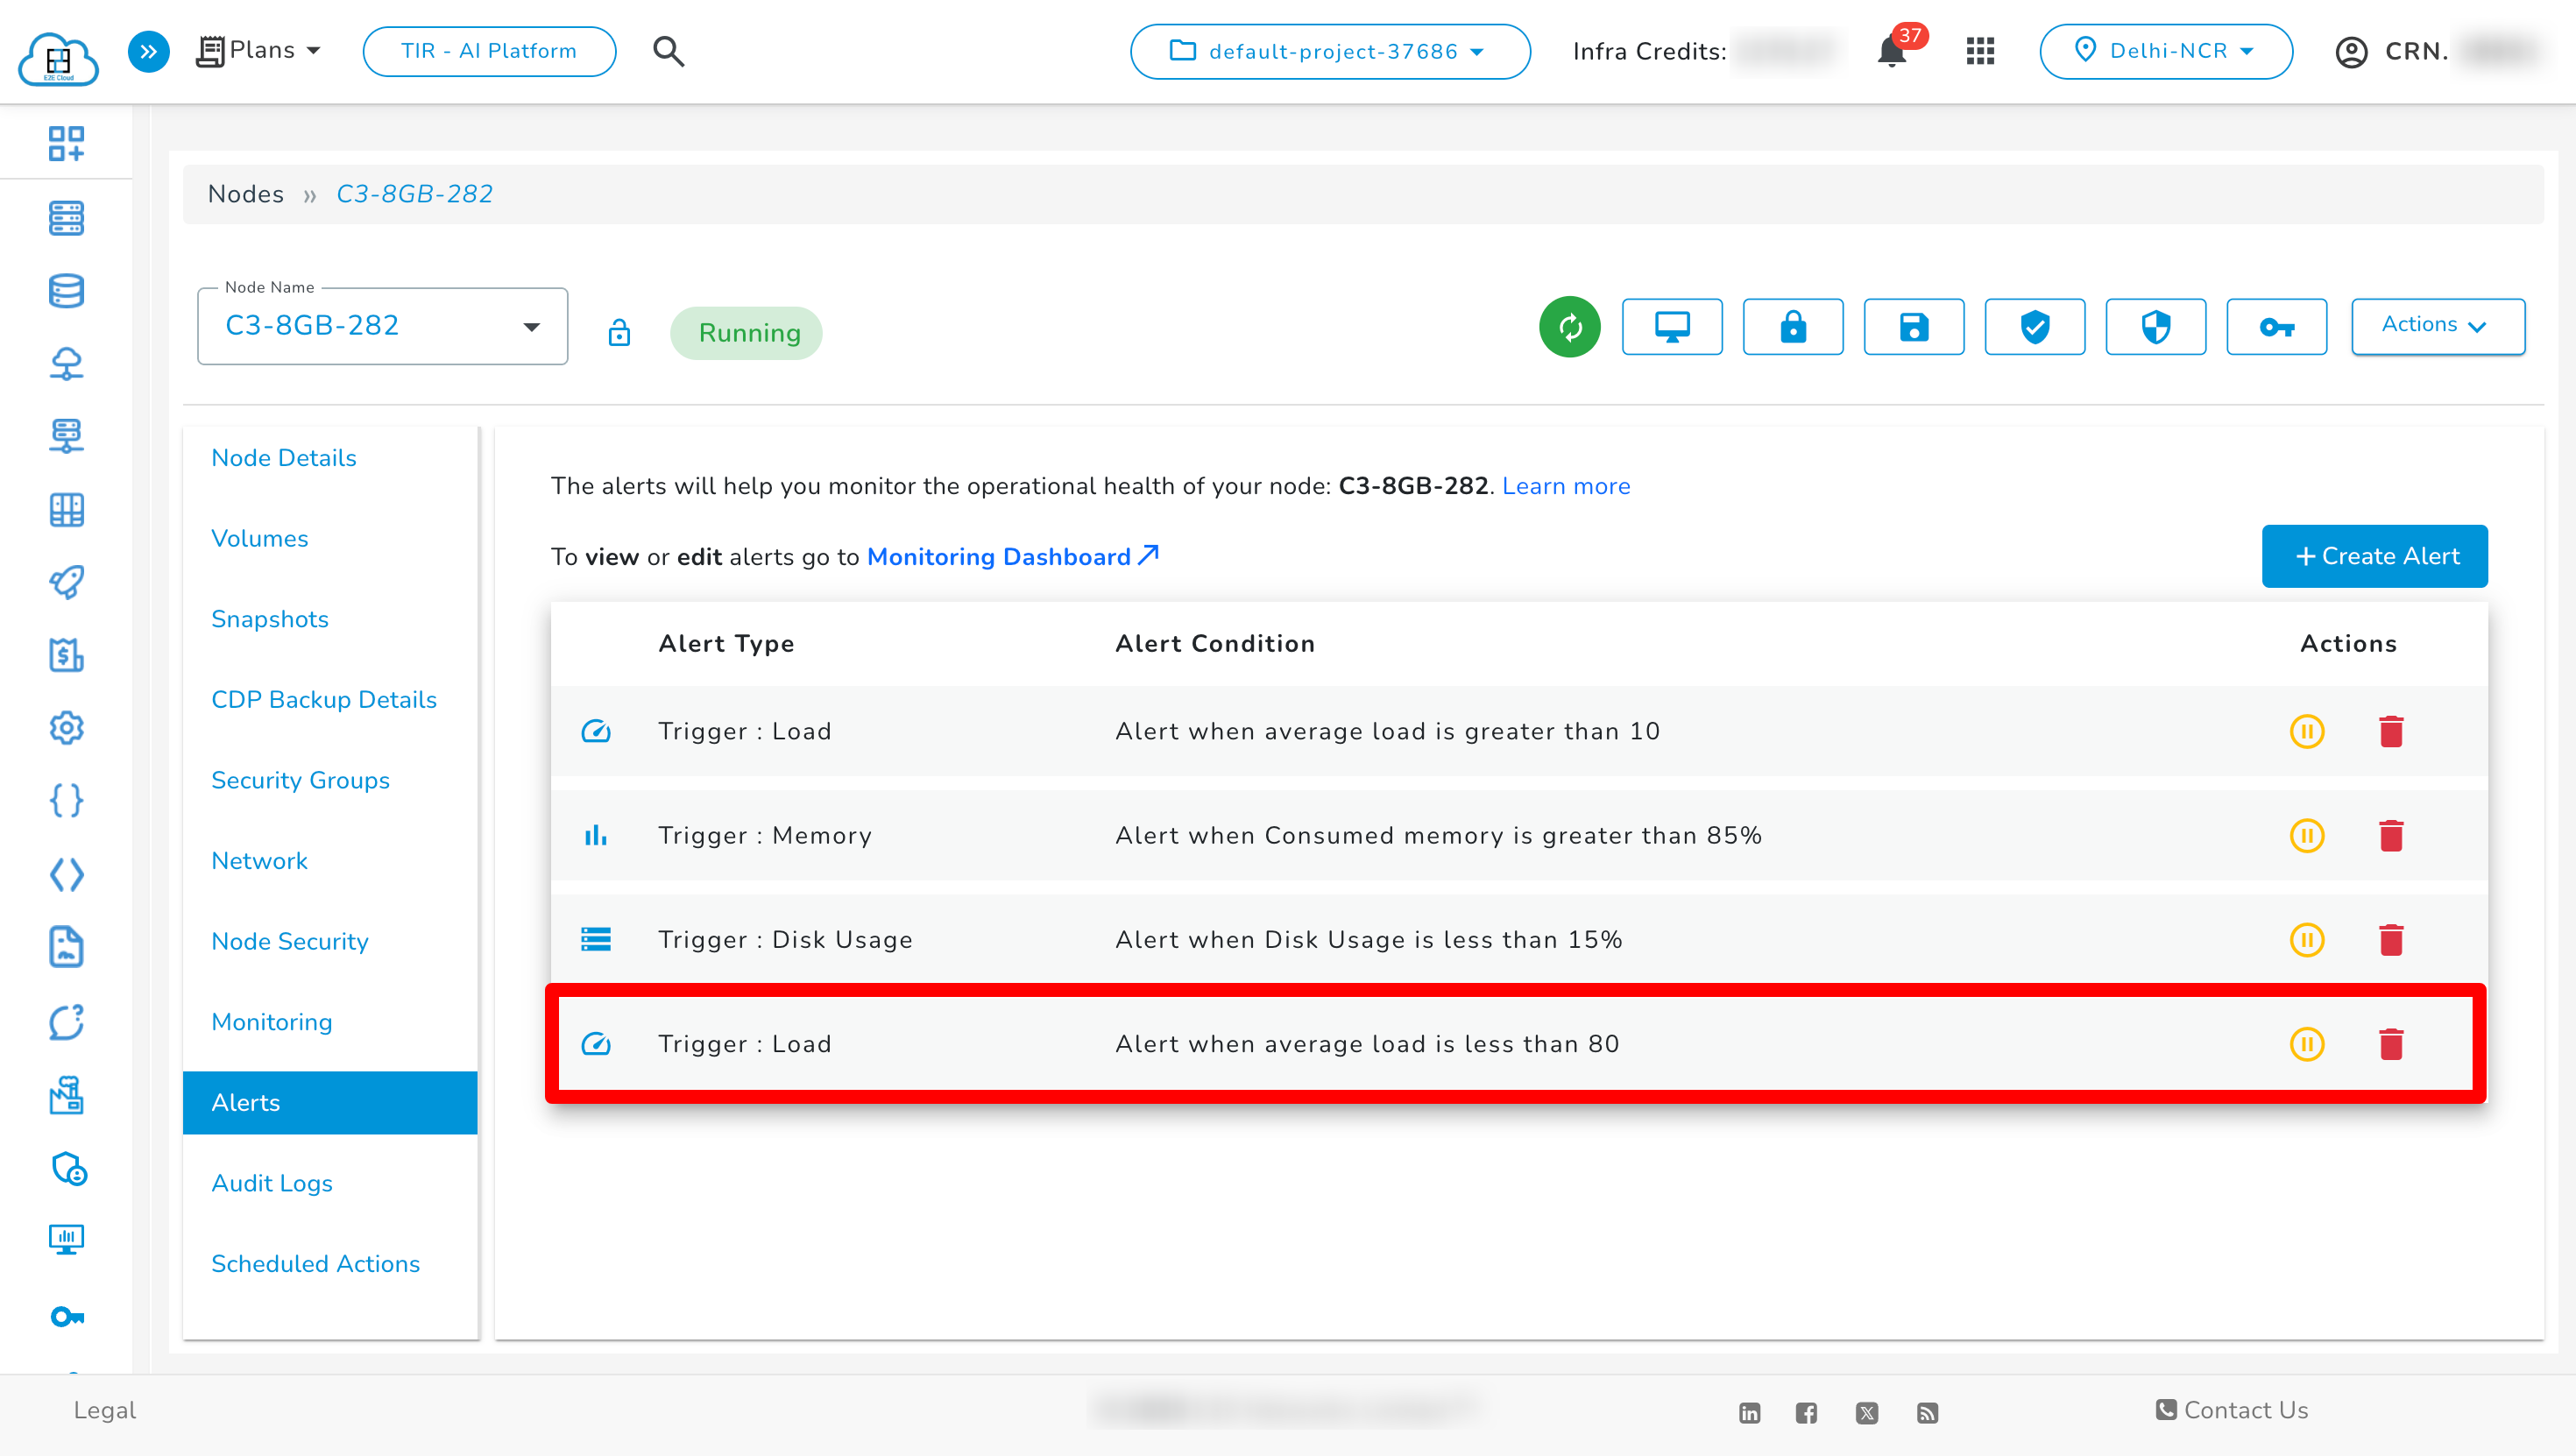
Go to the “ Node” page and navigate to the node details section for the desired node. Click on the ‘Alerts’ tab.
-
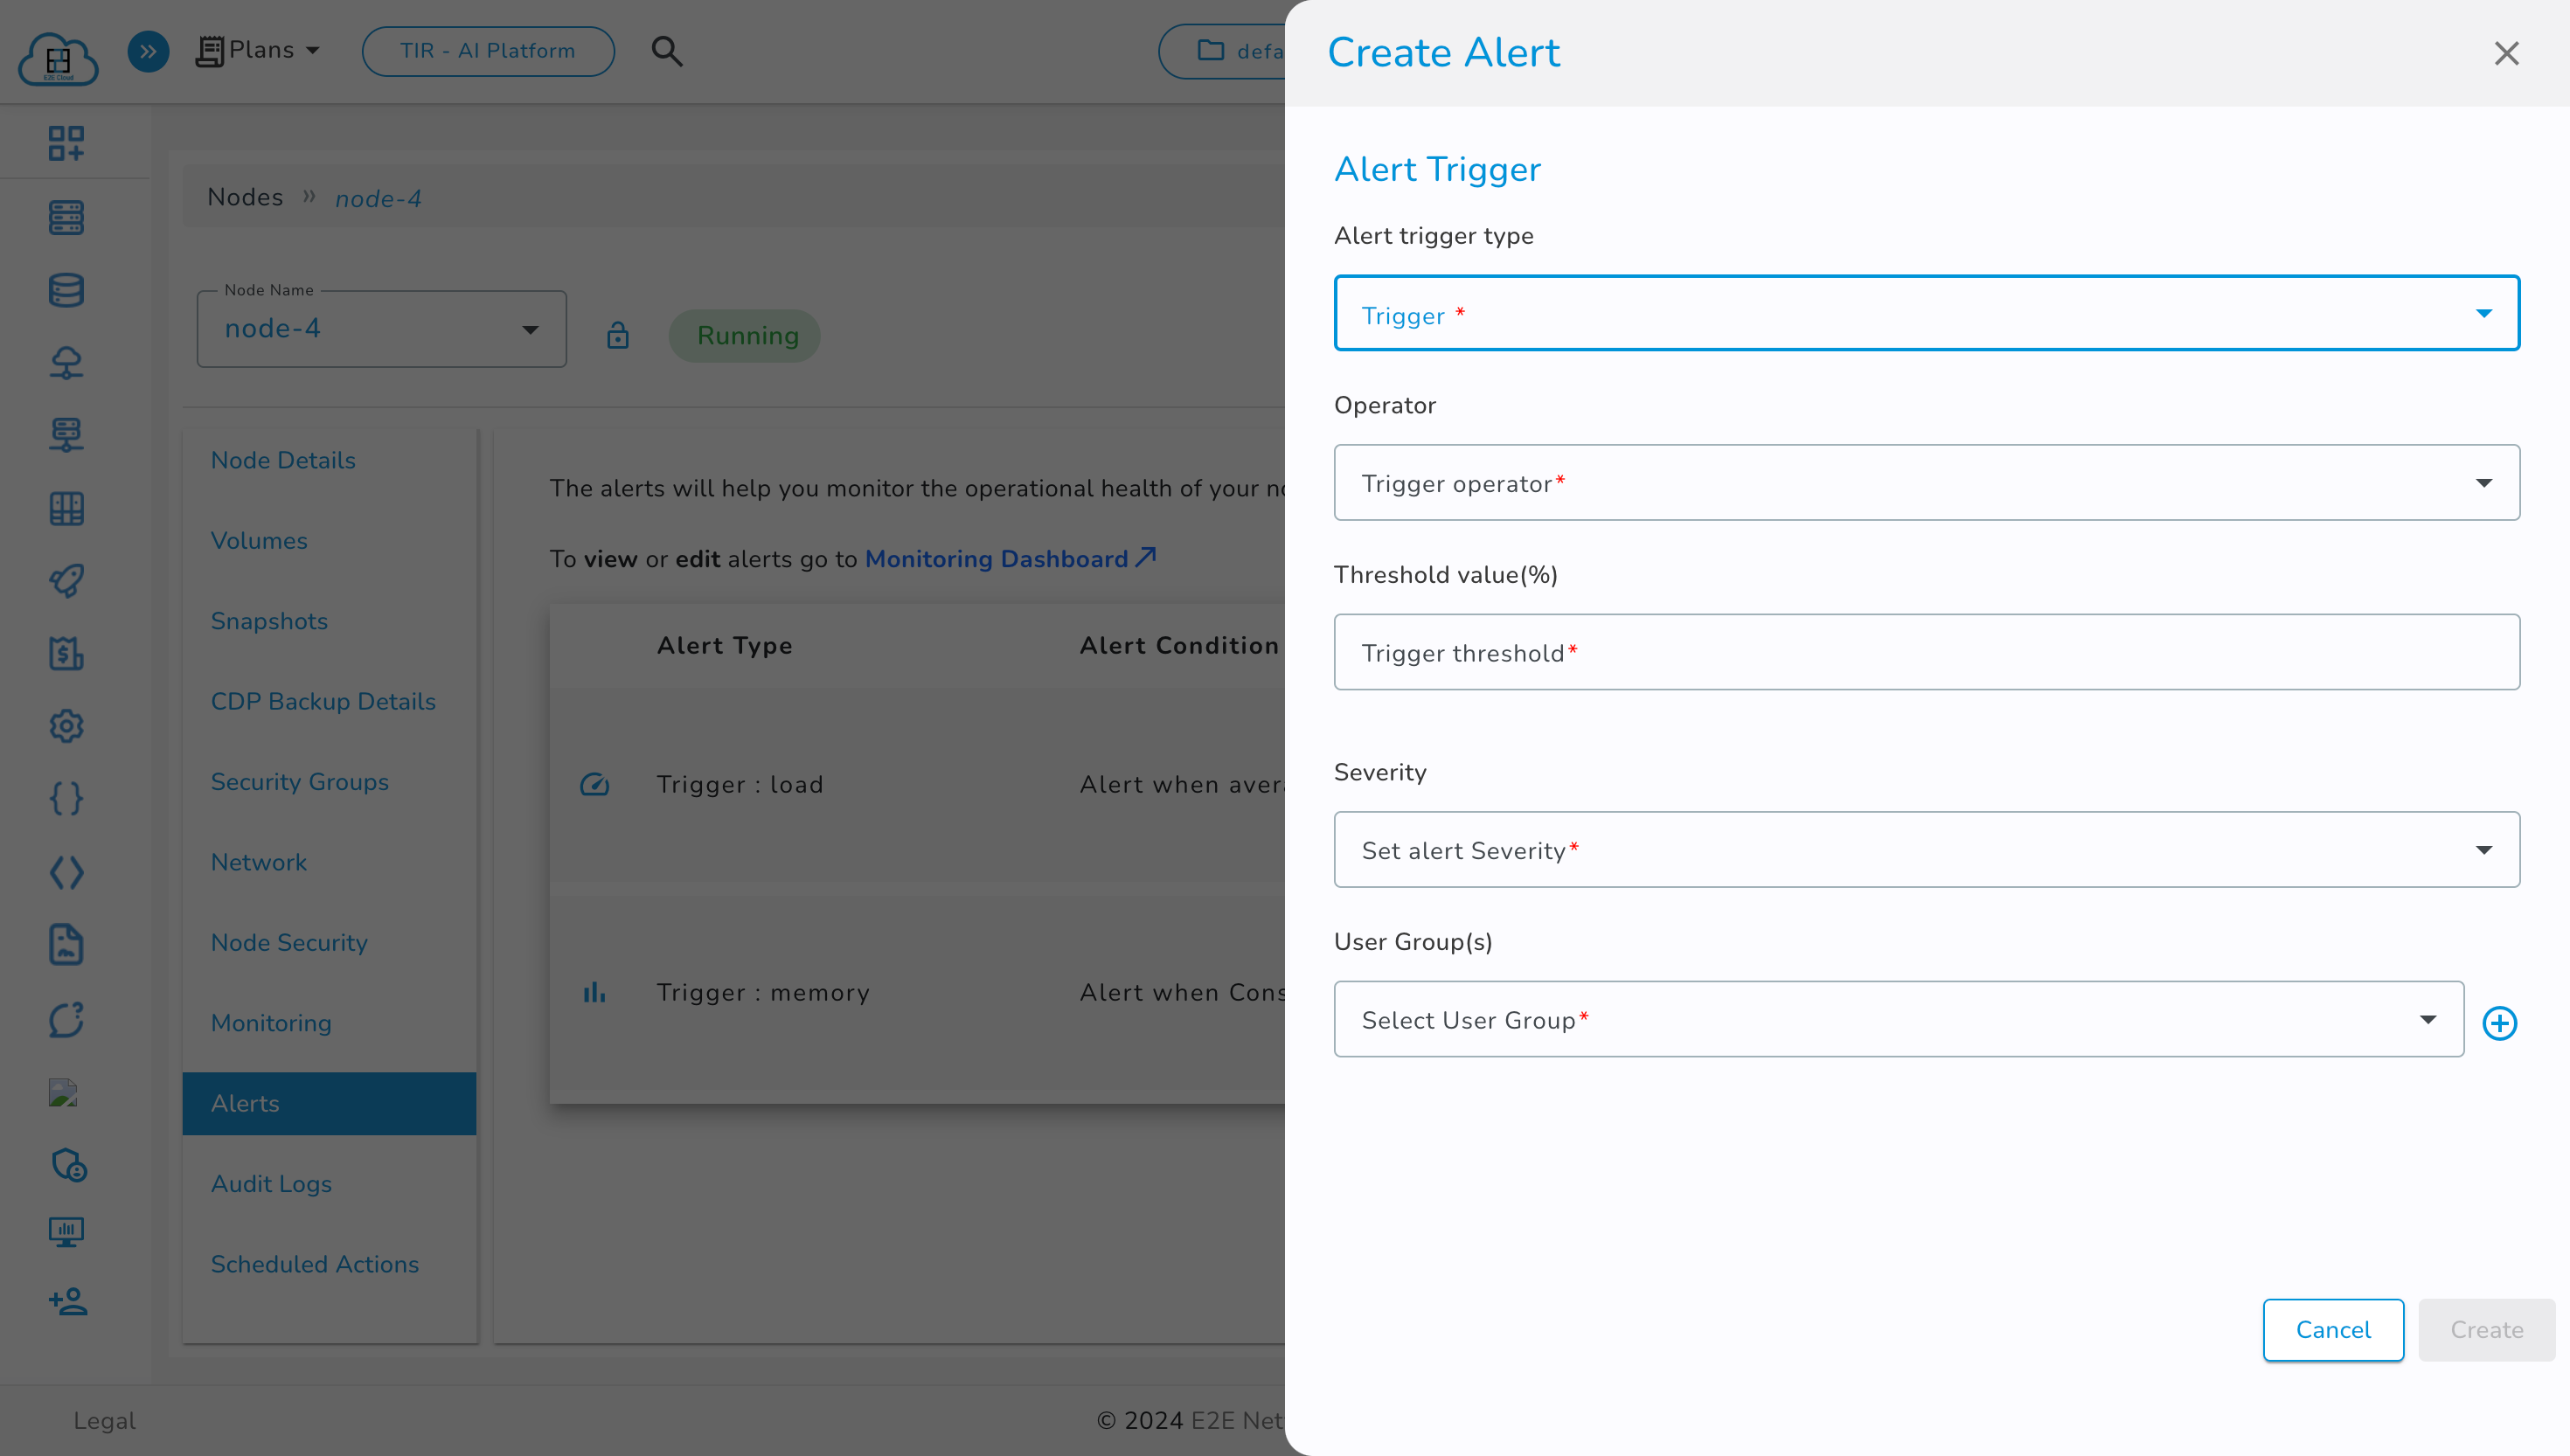
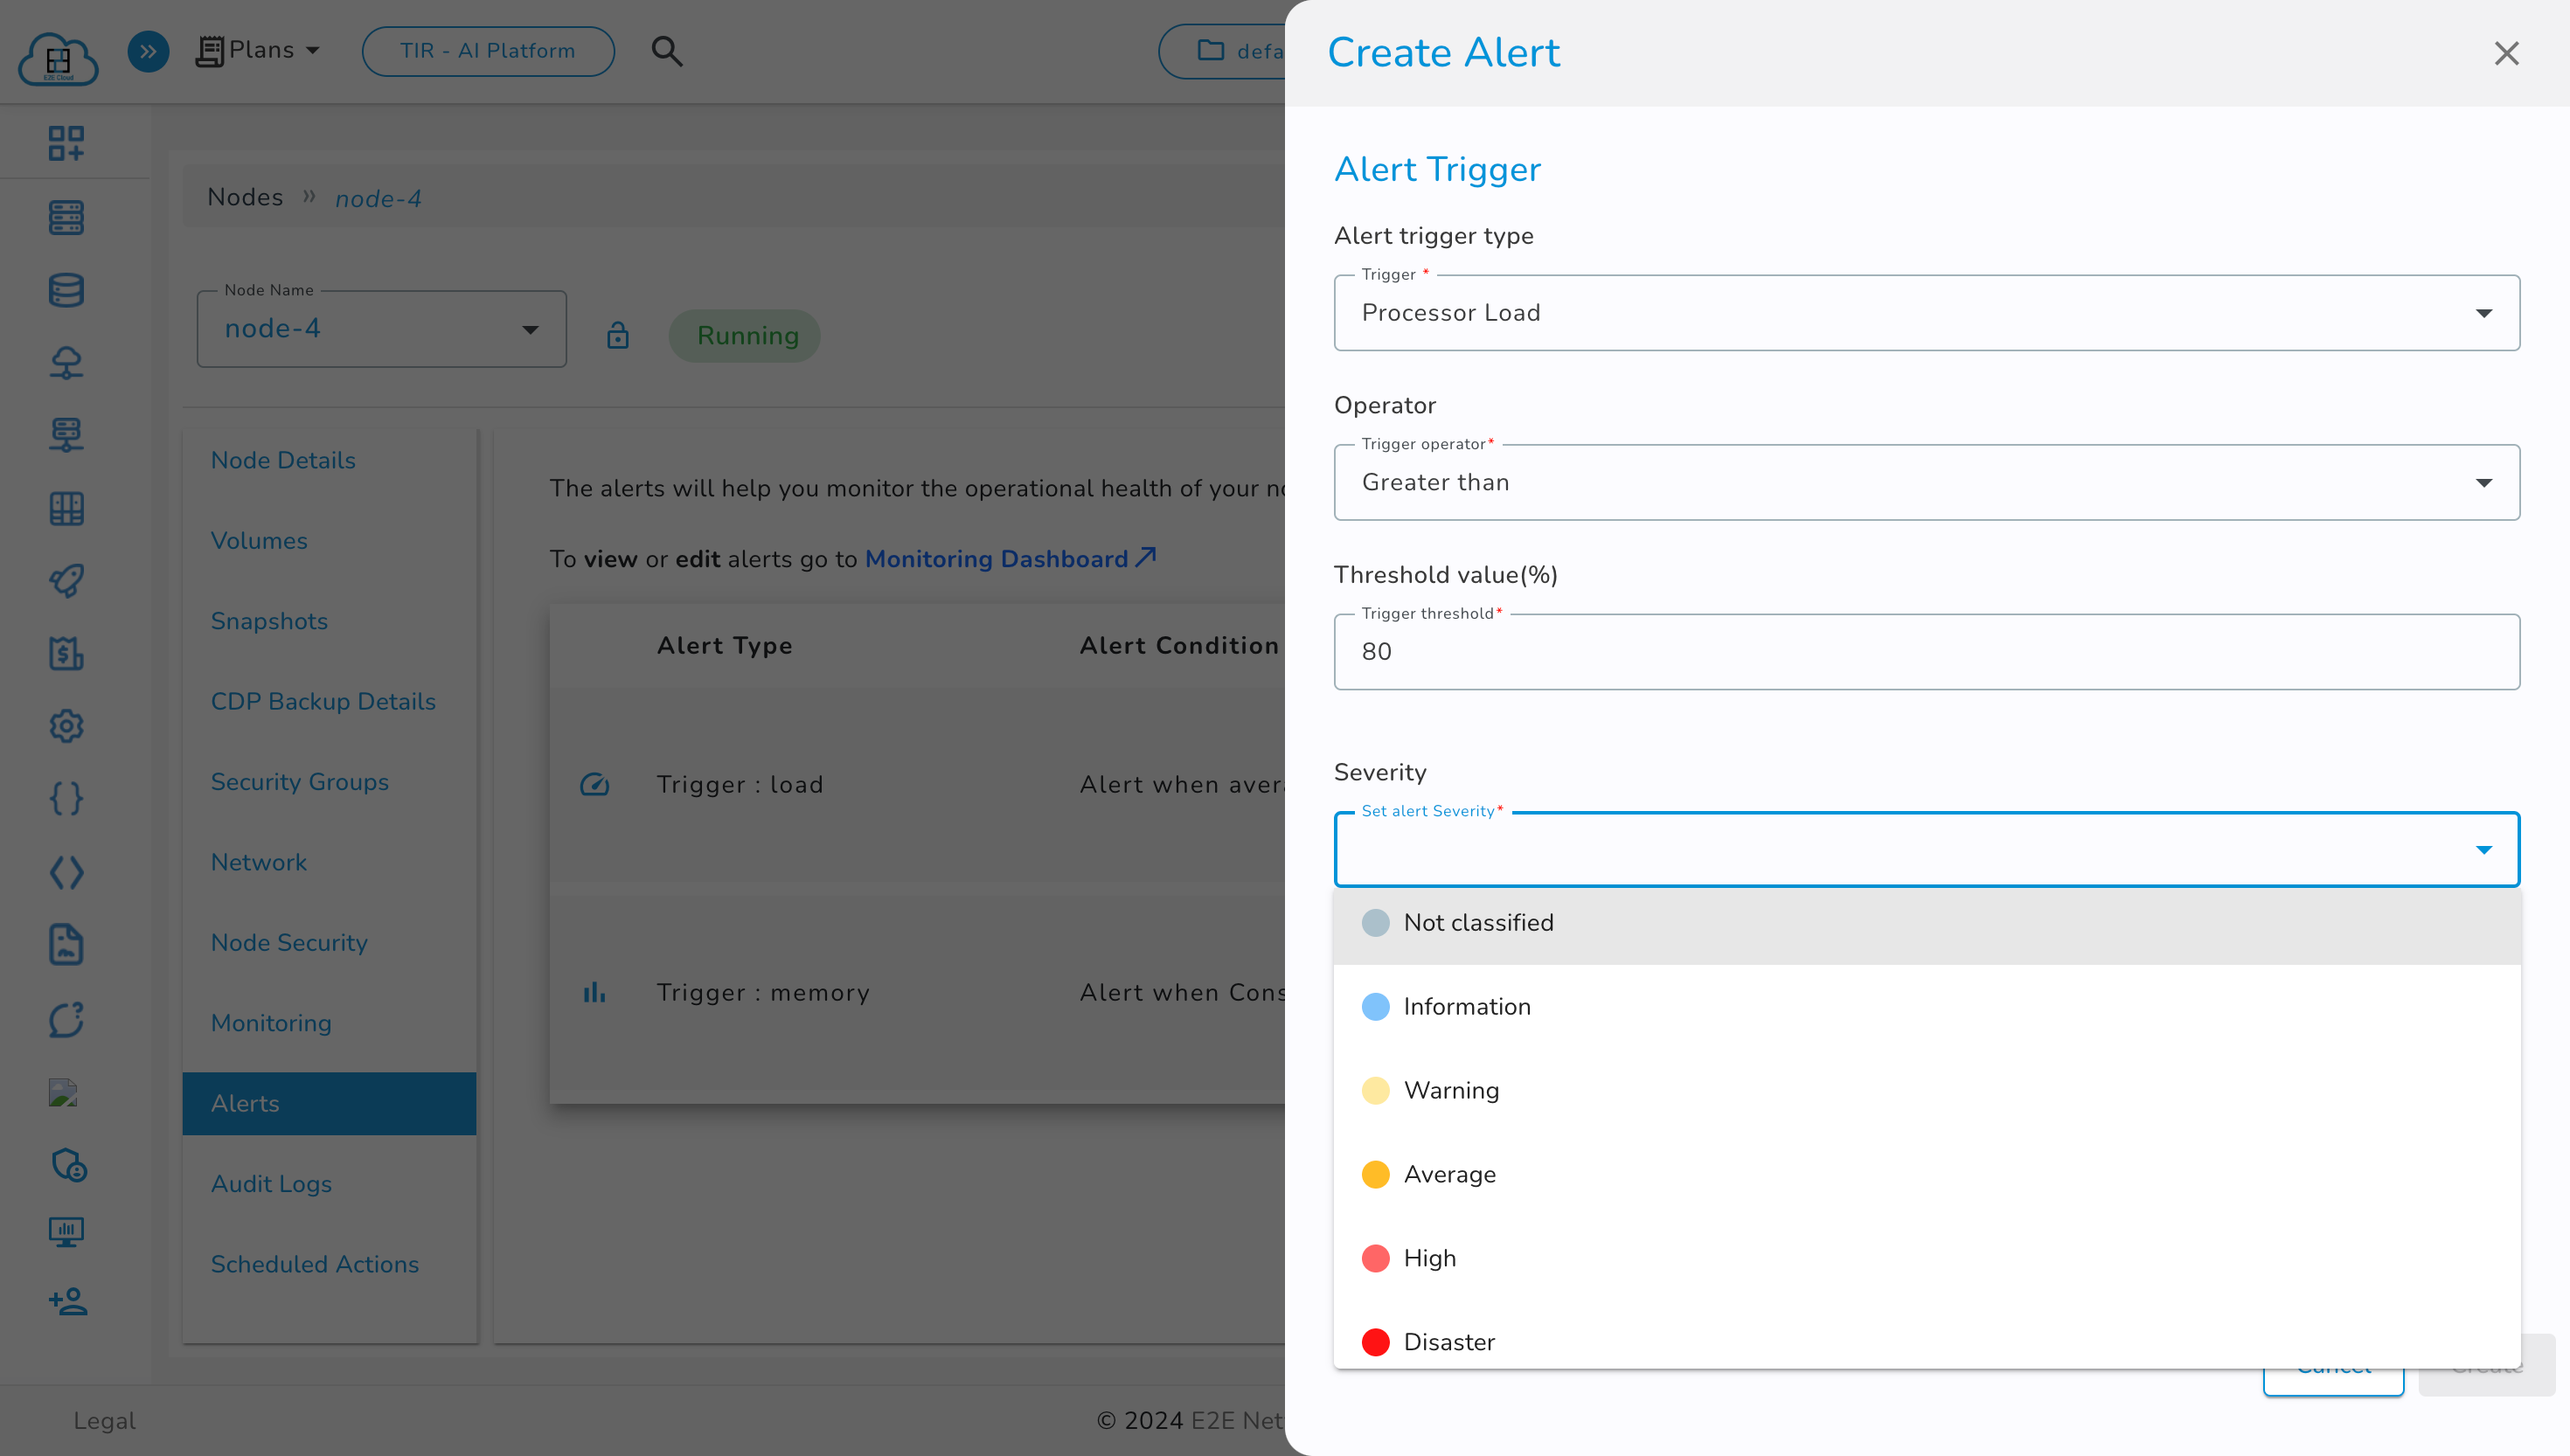
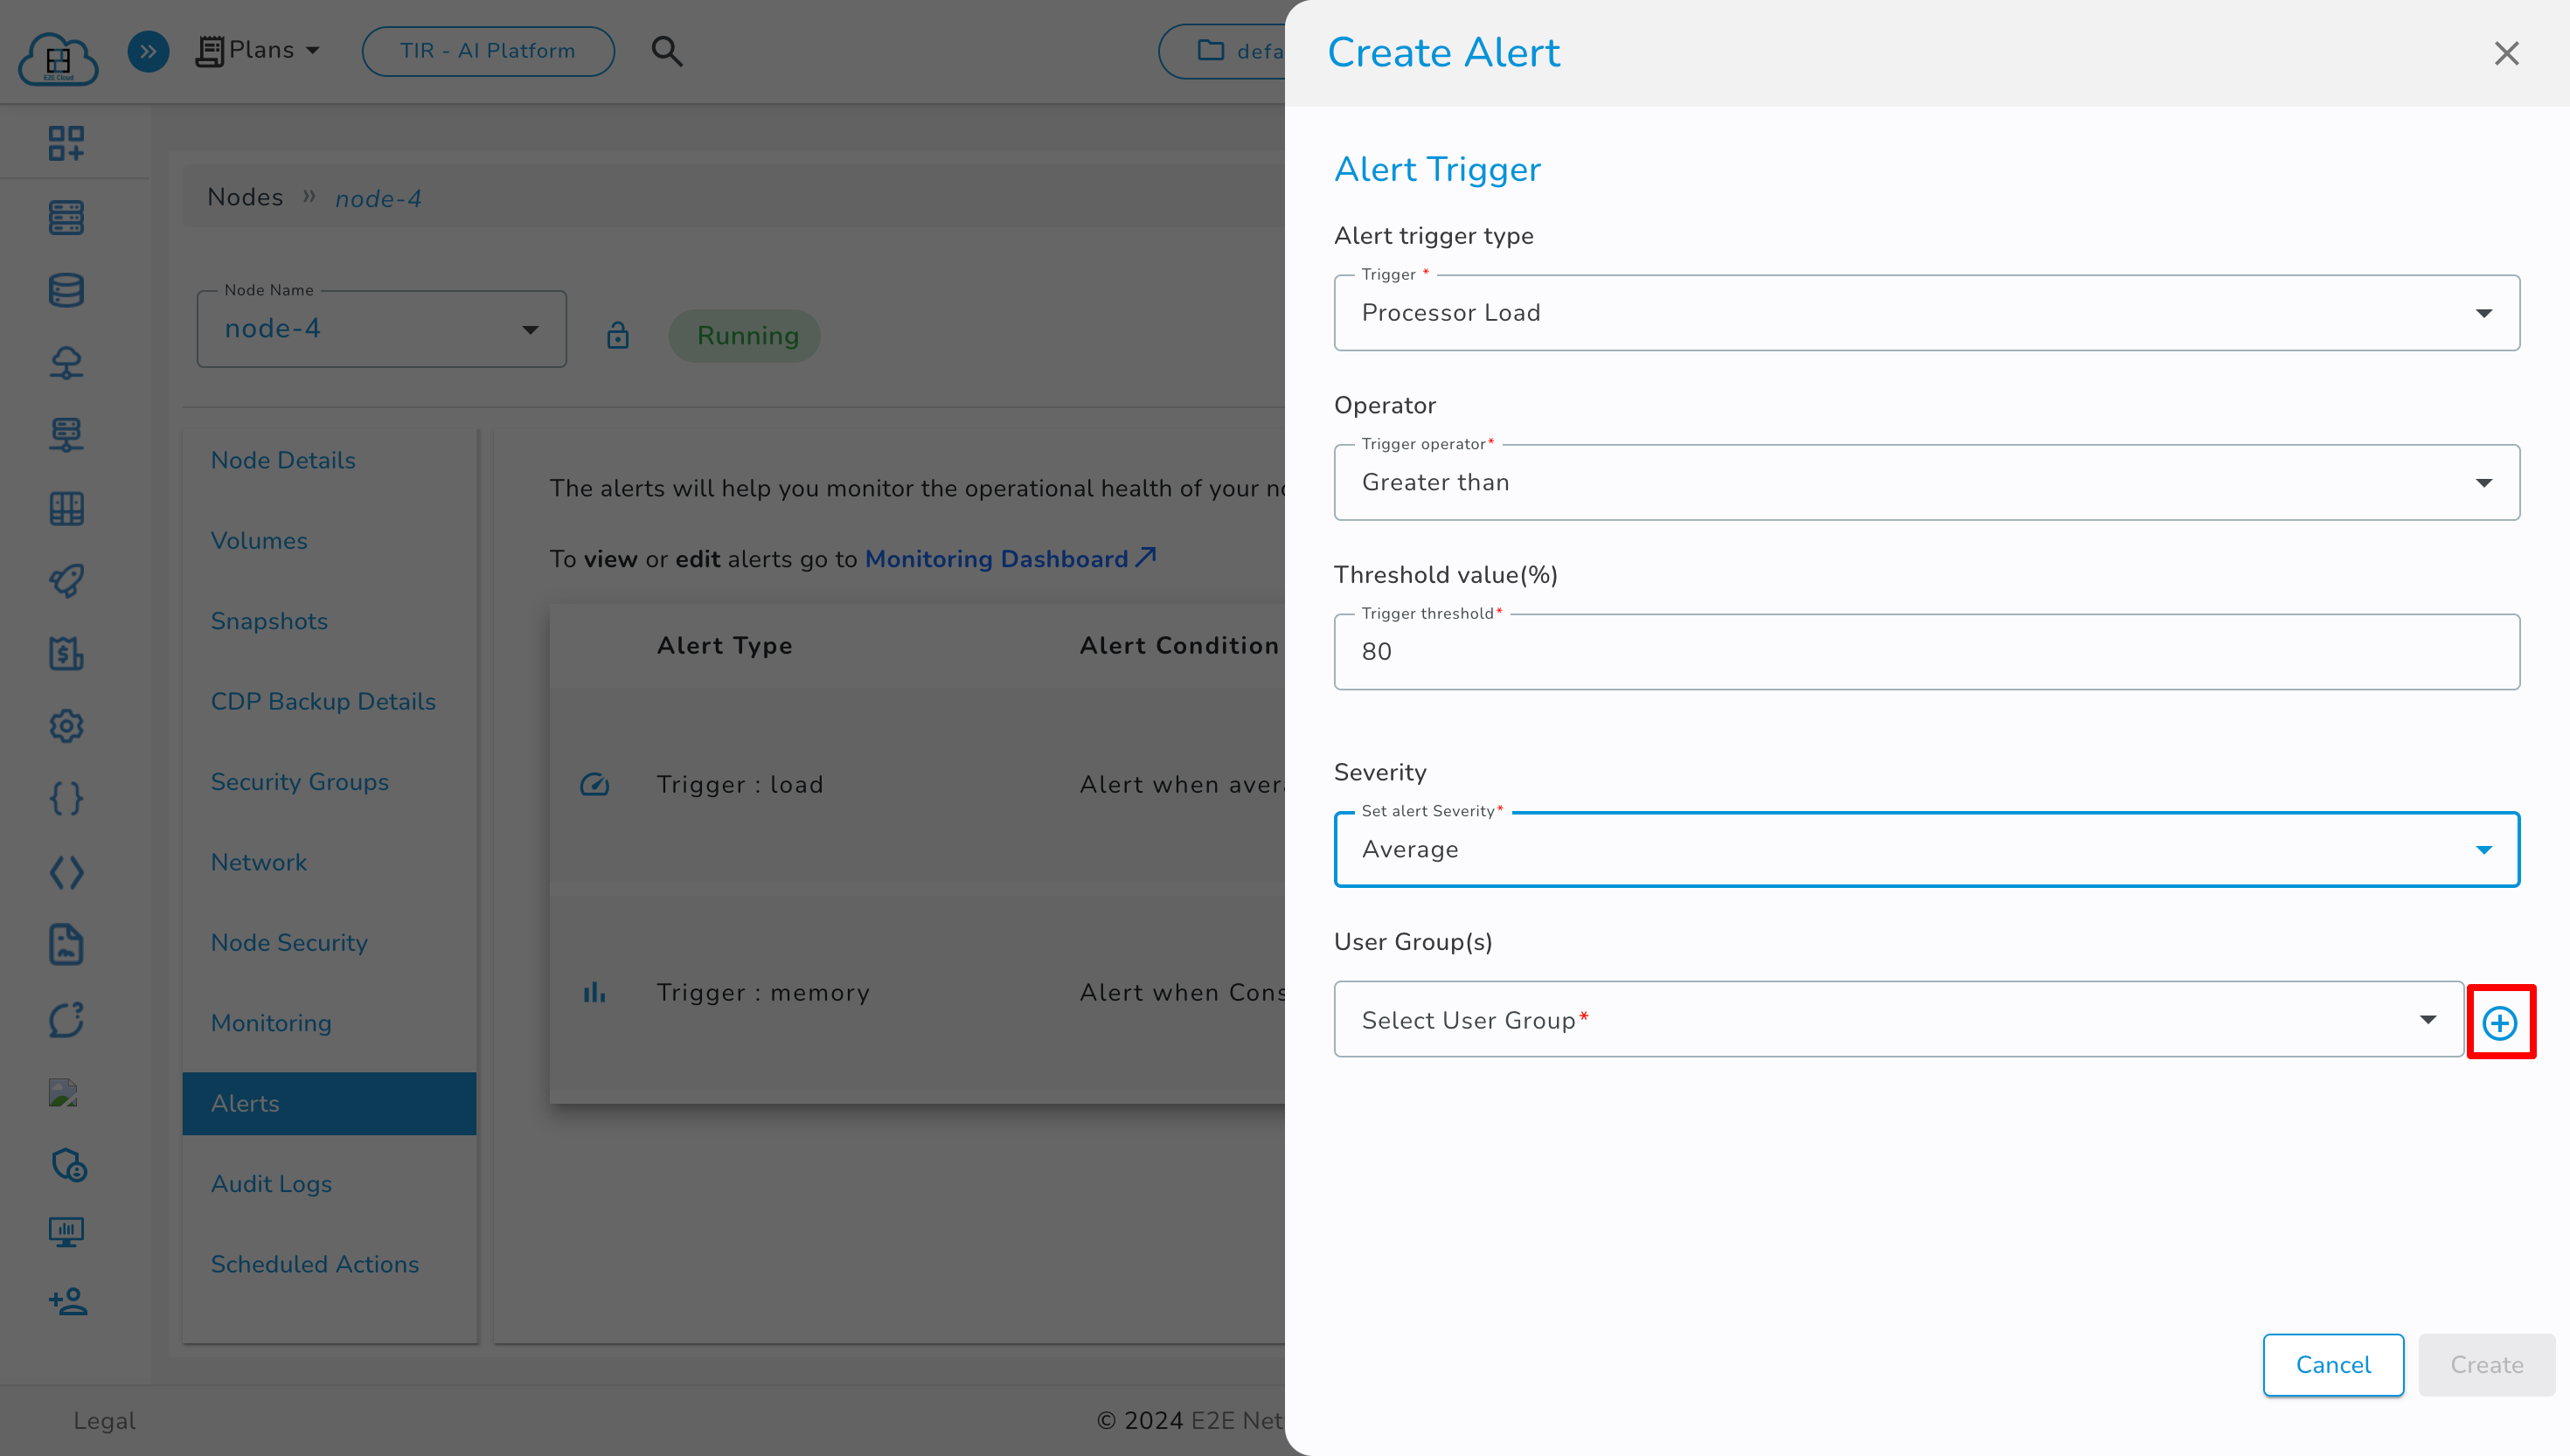
Click the ‘Create Alert’ button to open the Create Alert window.
-
Select Trigger Type.
-
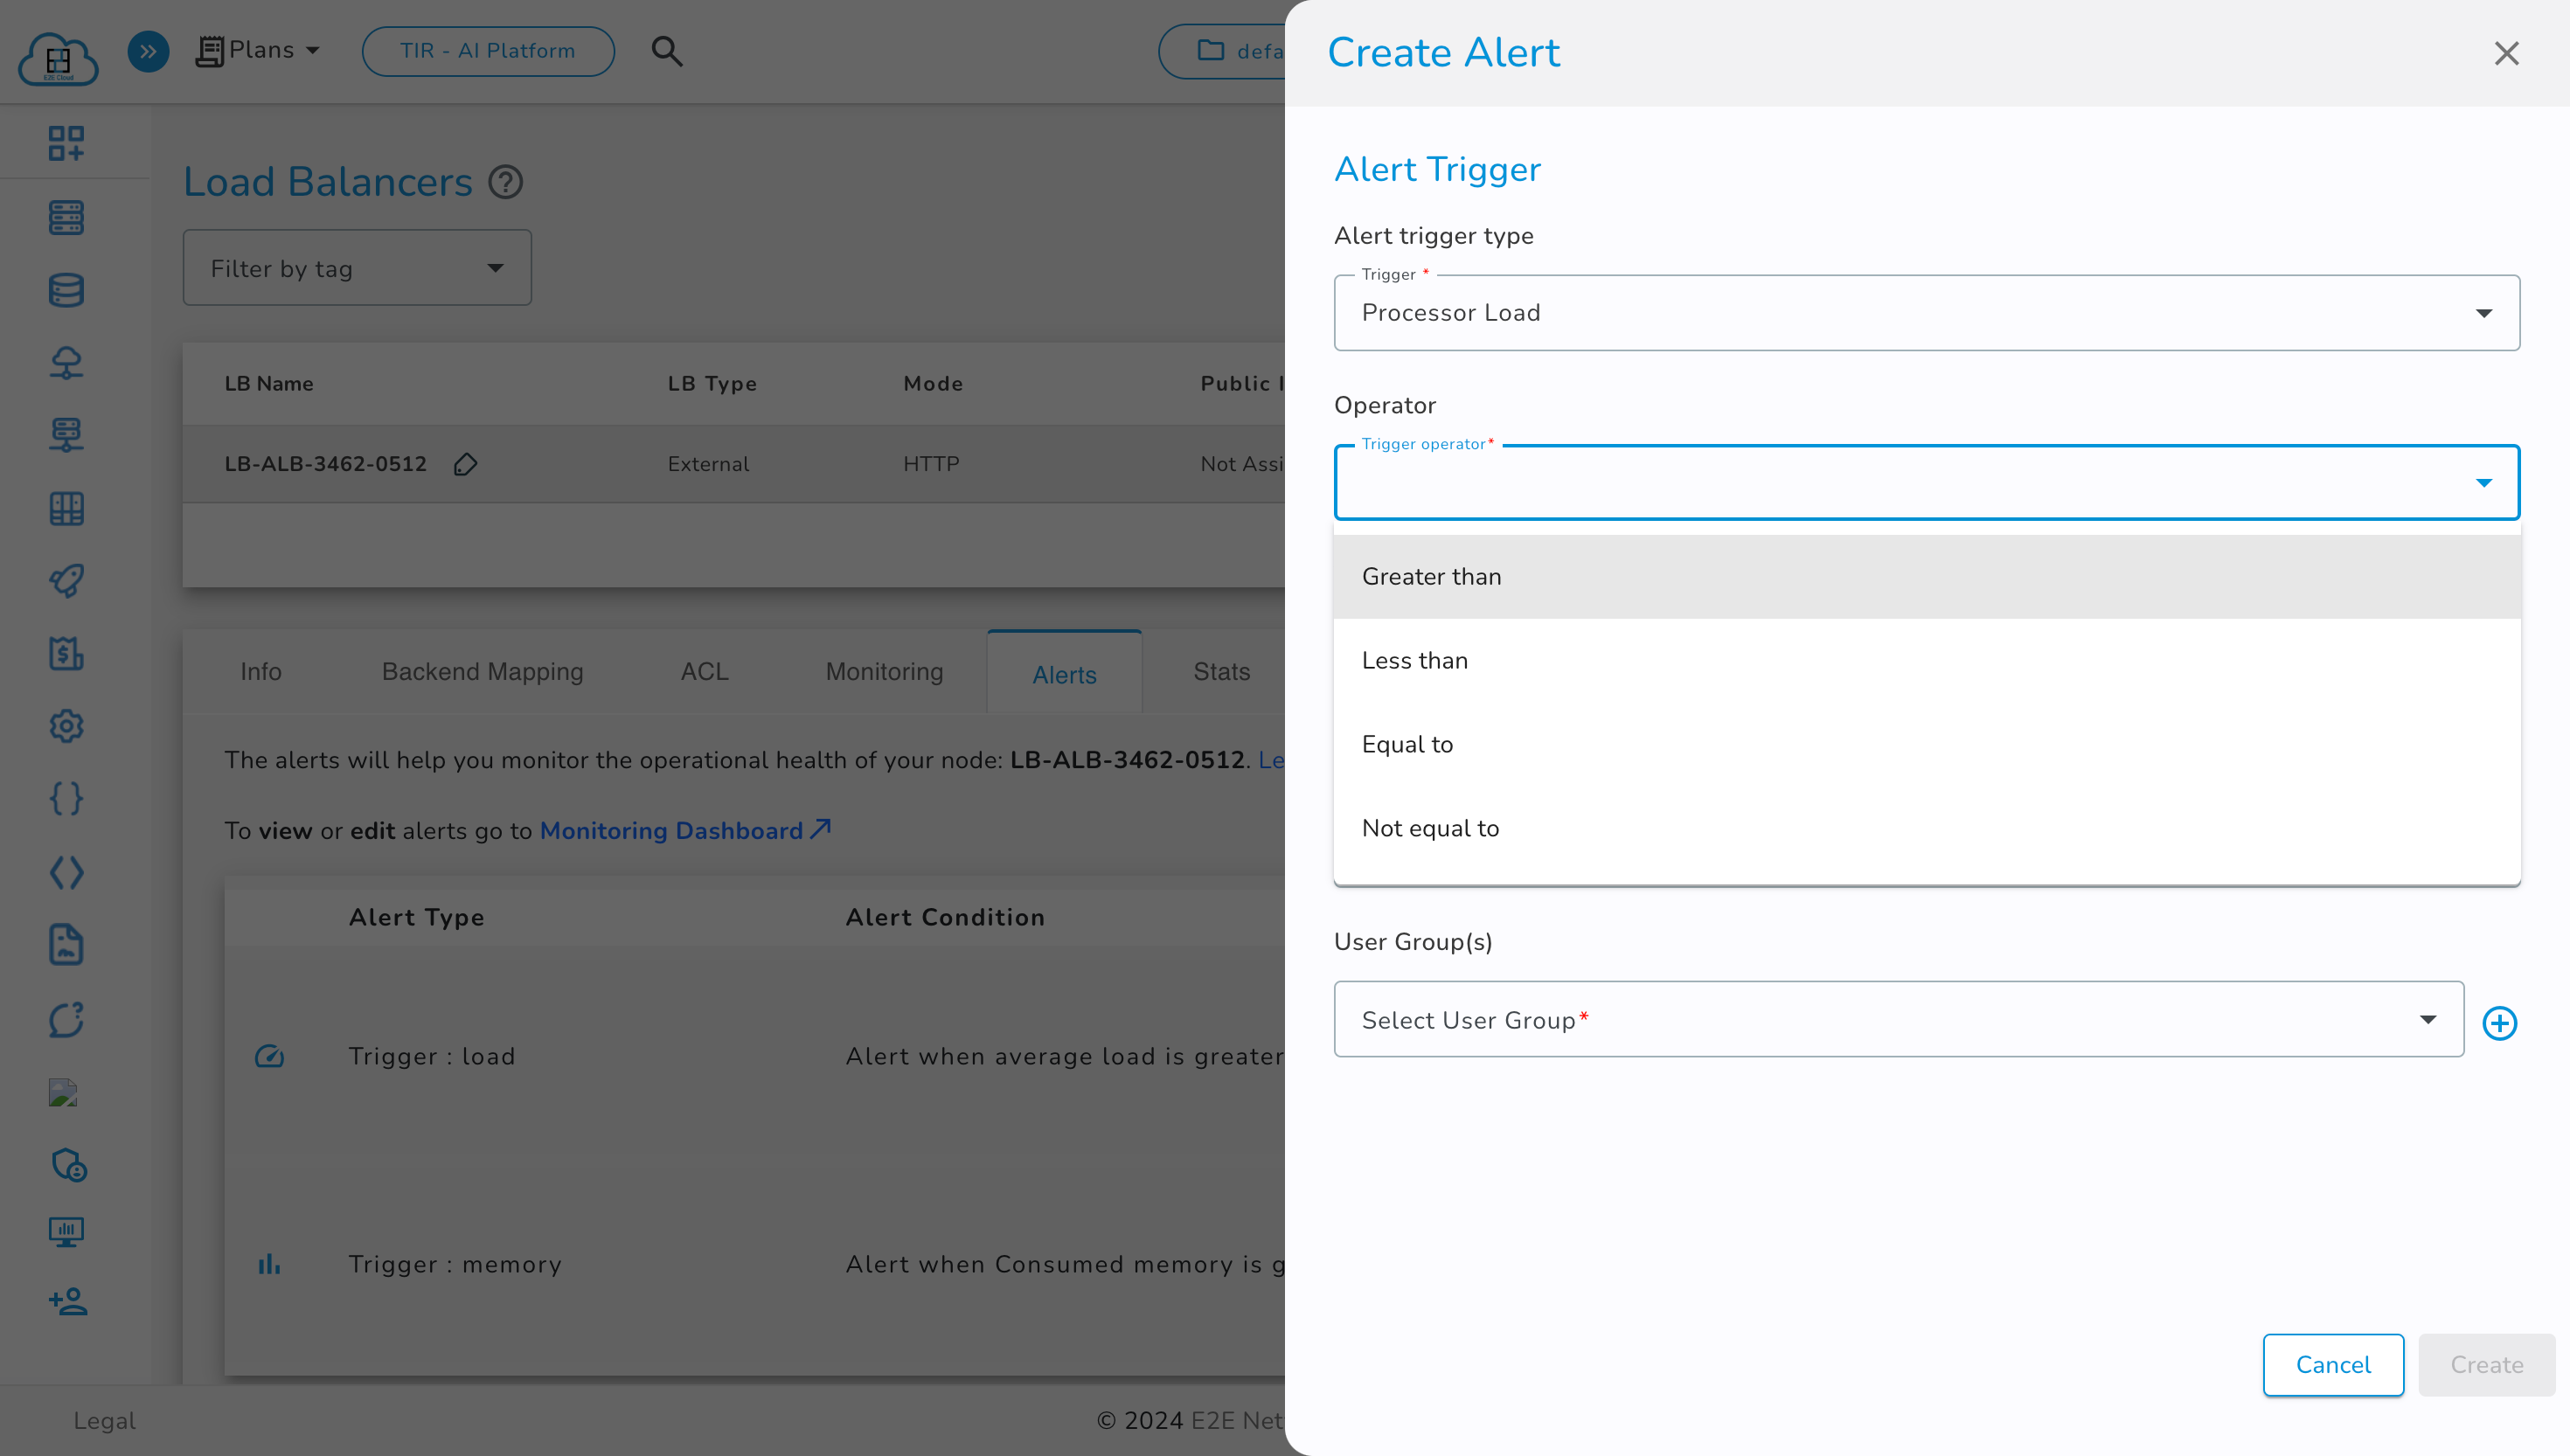
Select Trigger Operator.
-
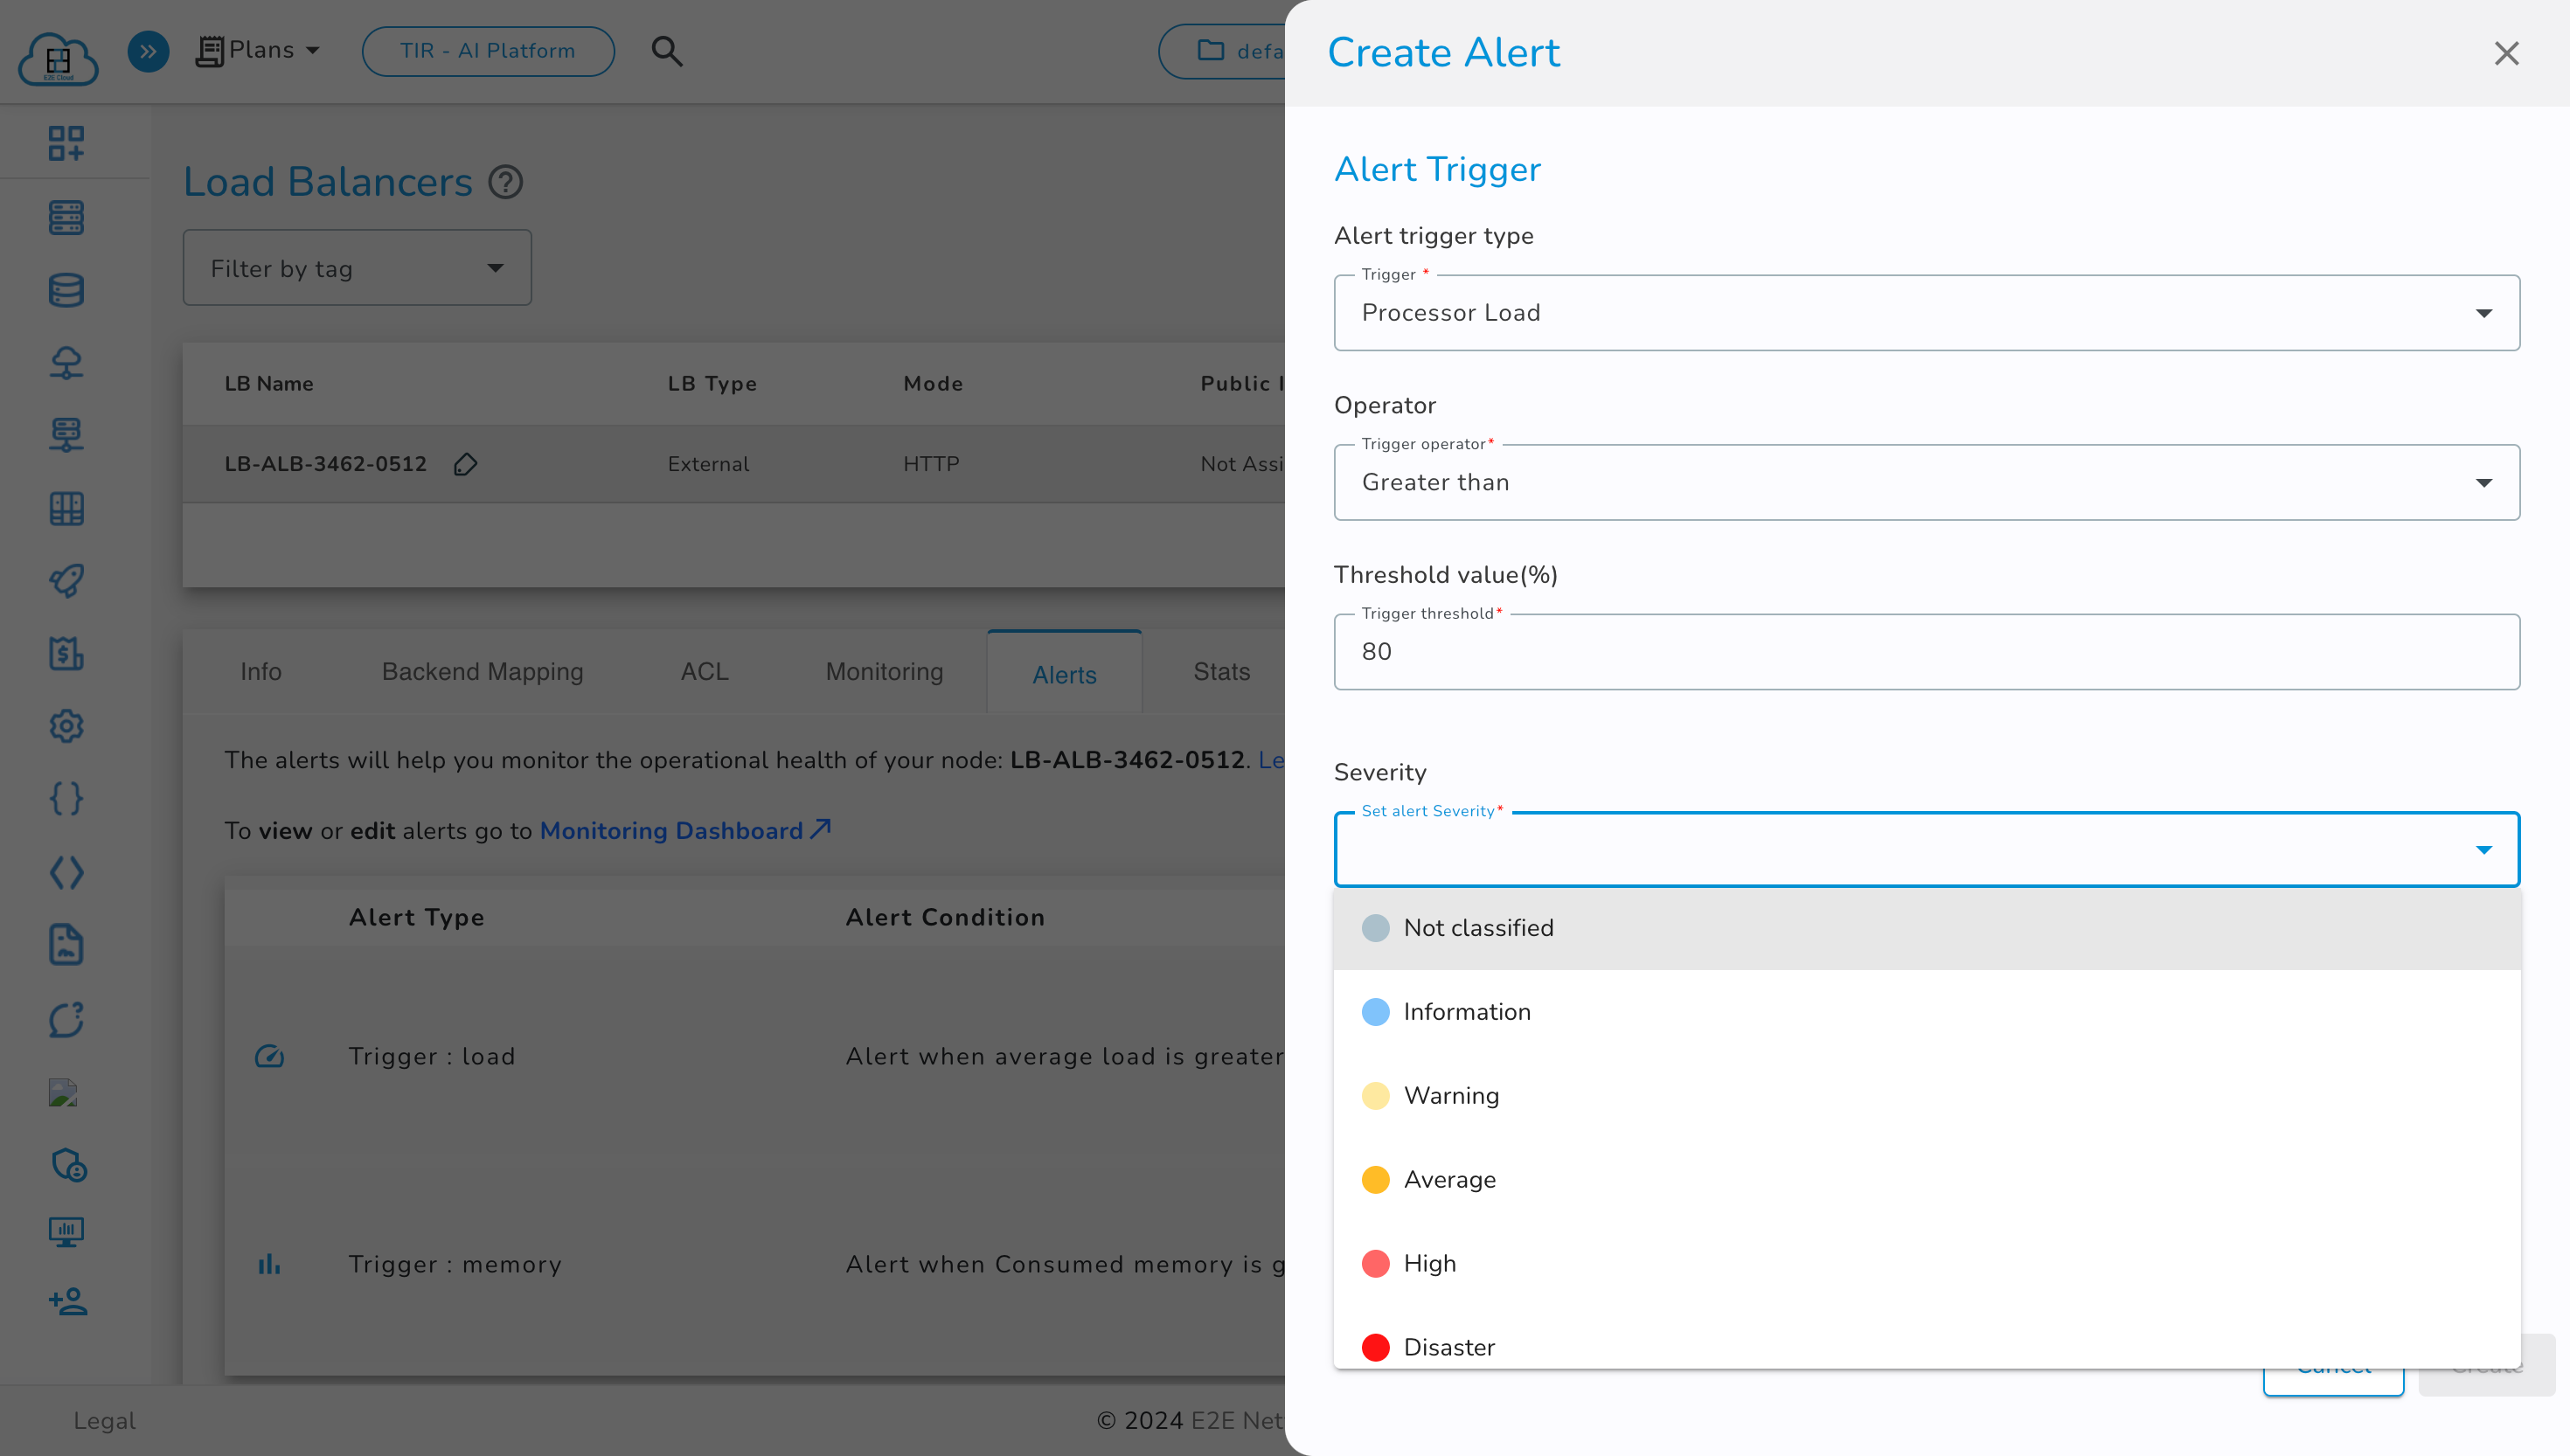
Define the Threshold Value (%). Notifications are triggered when conditions are met.
-
Select Severity.
-
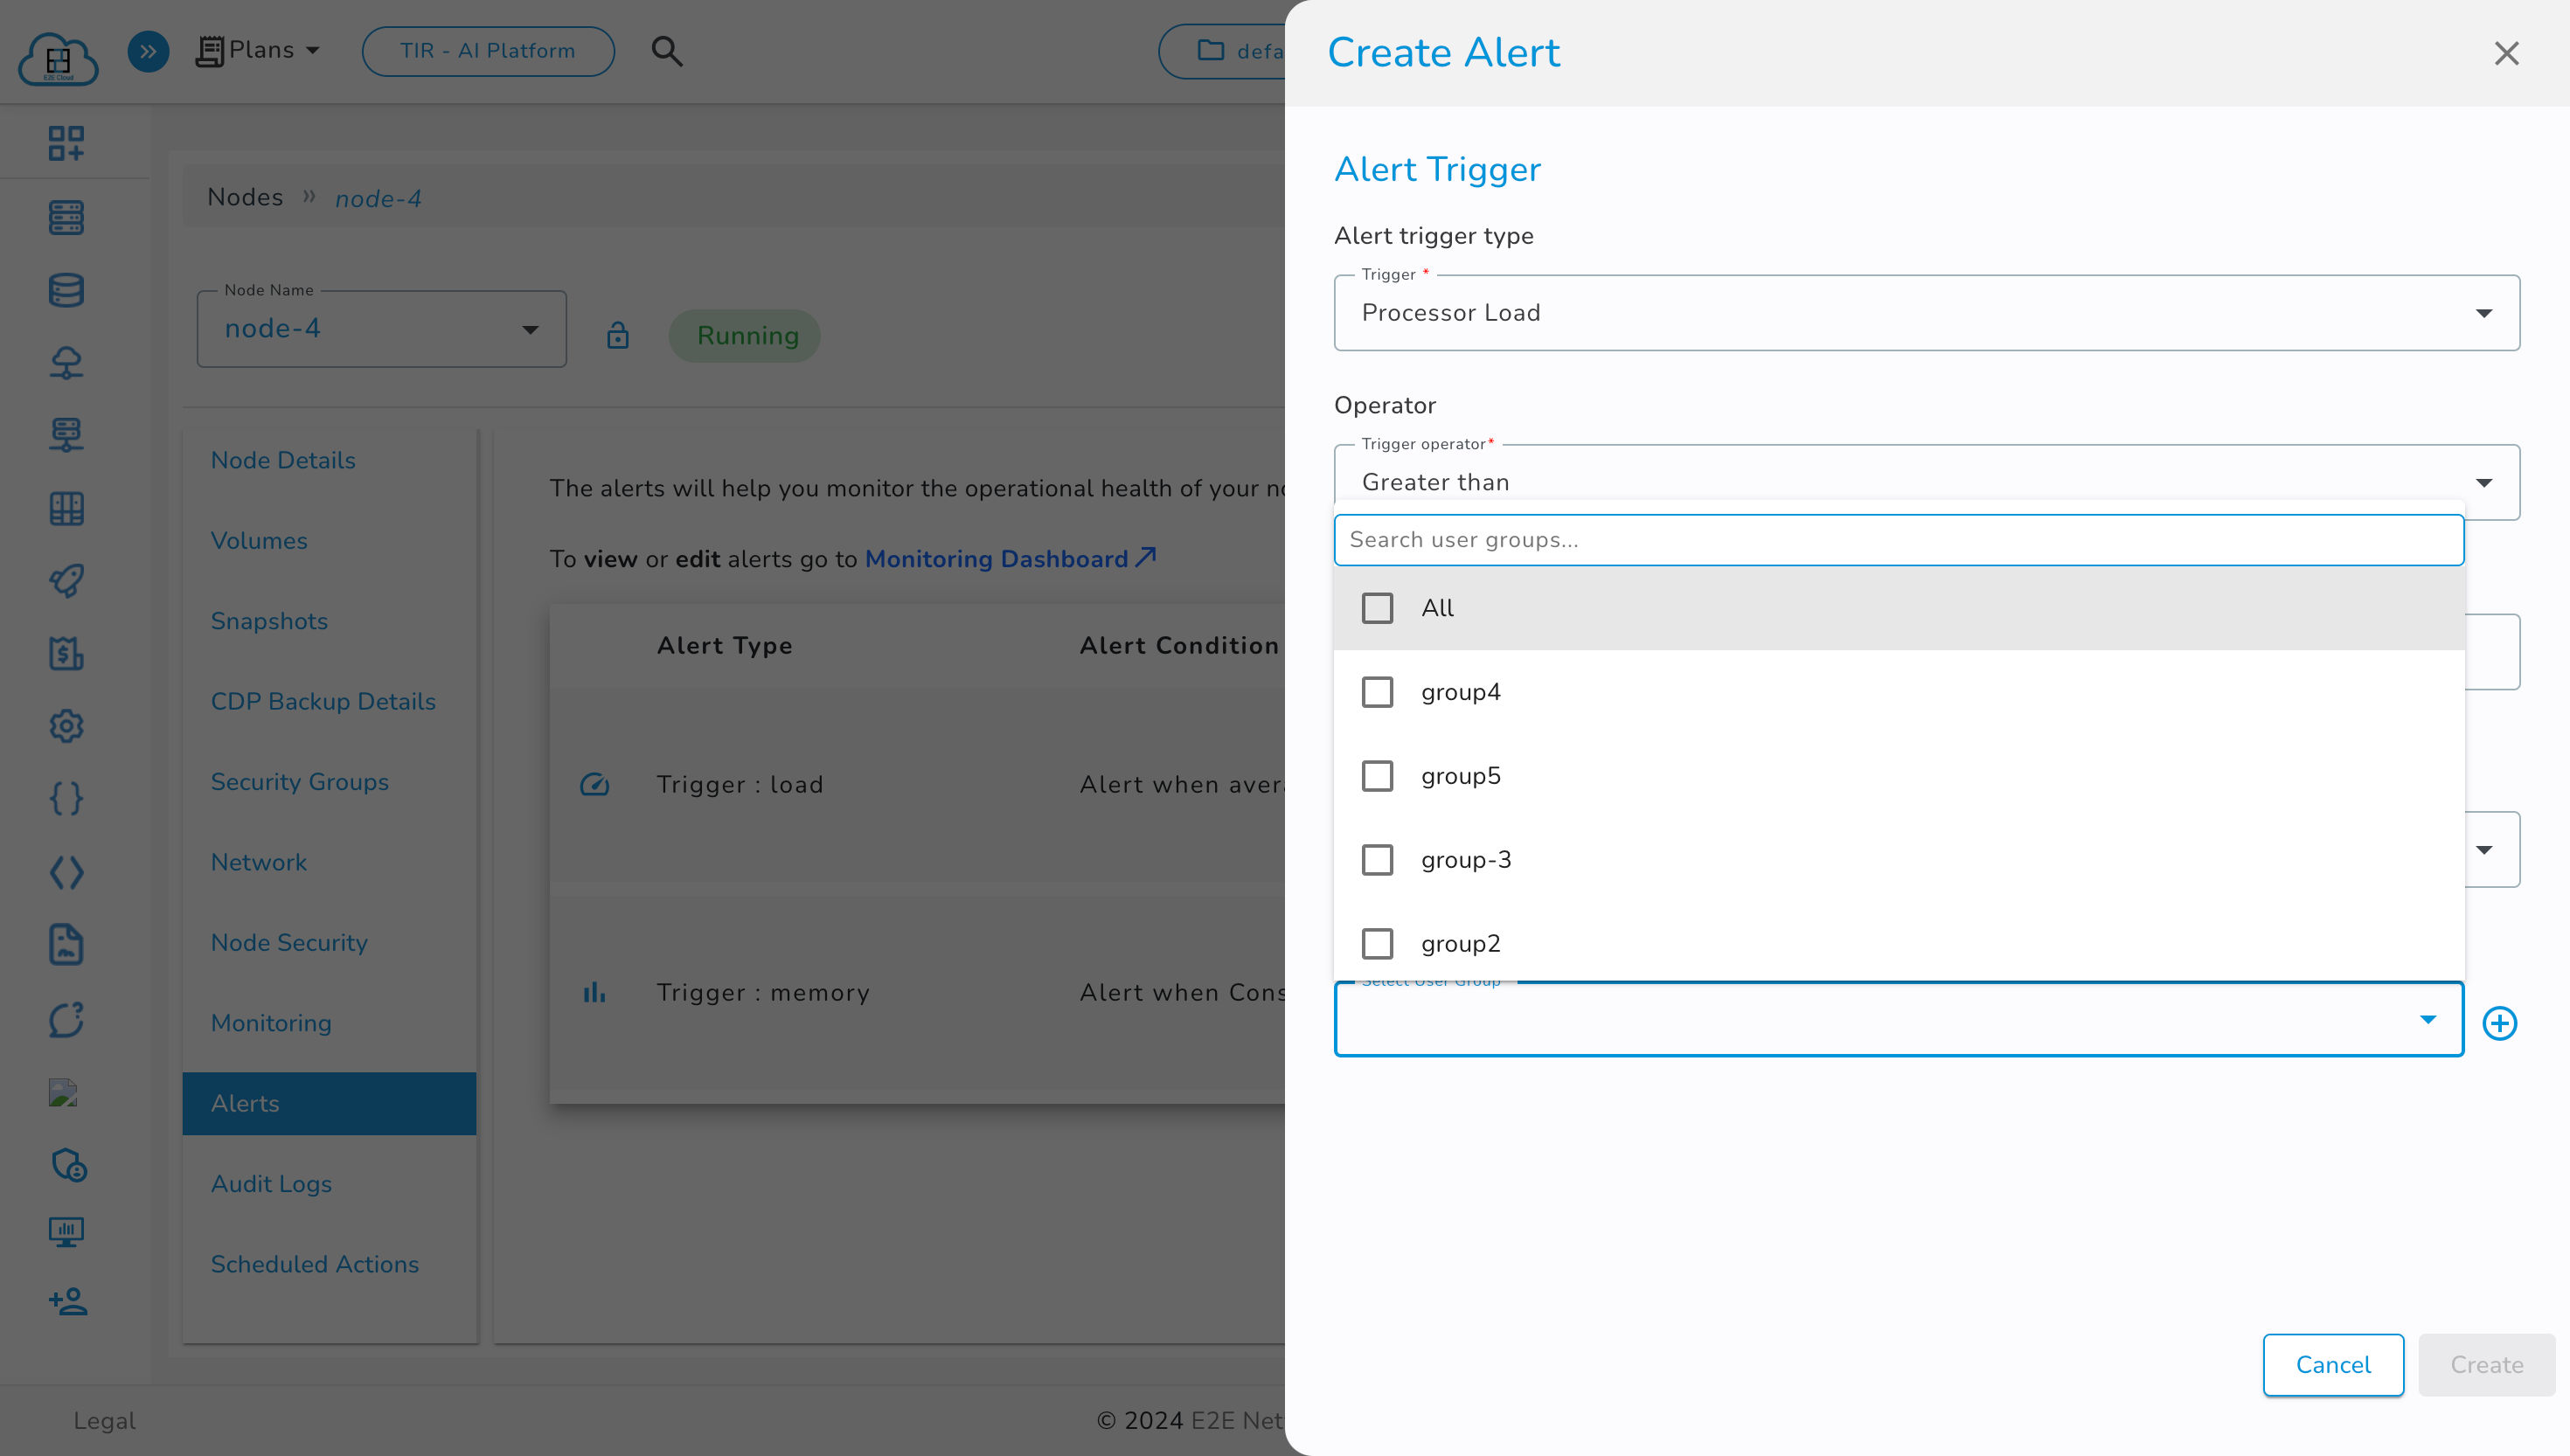
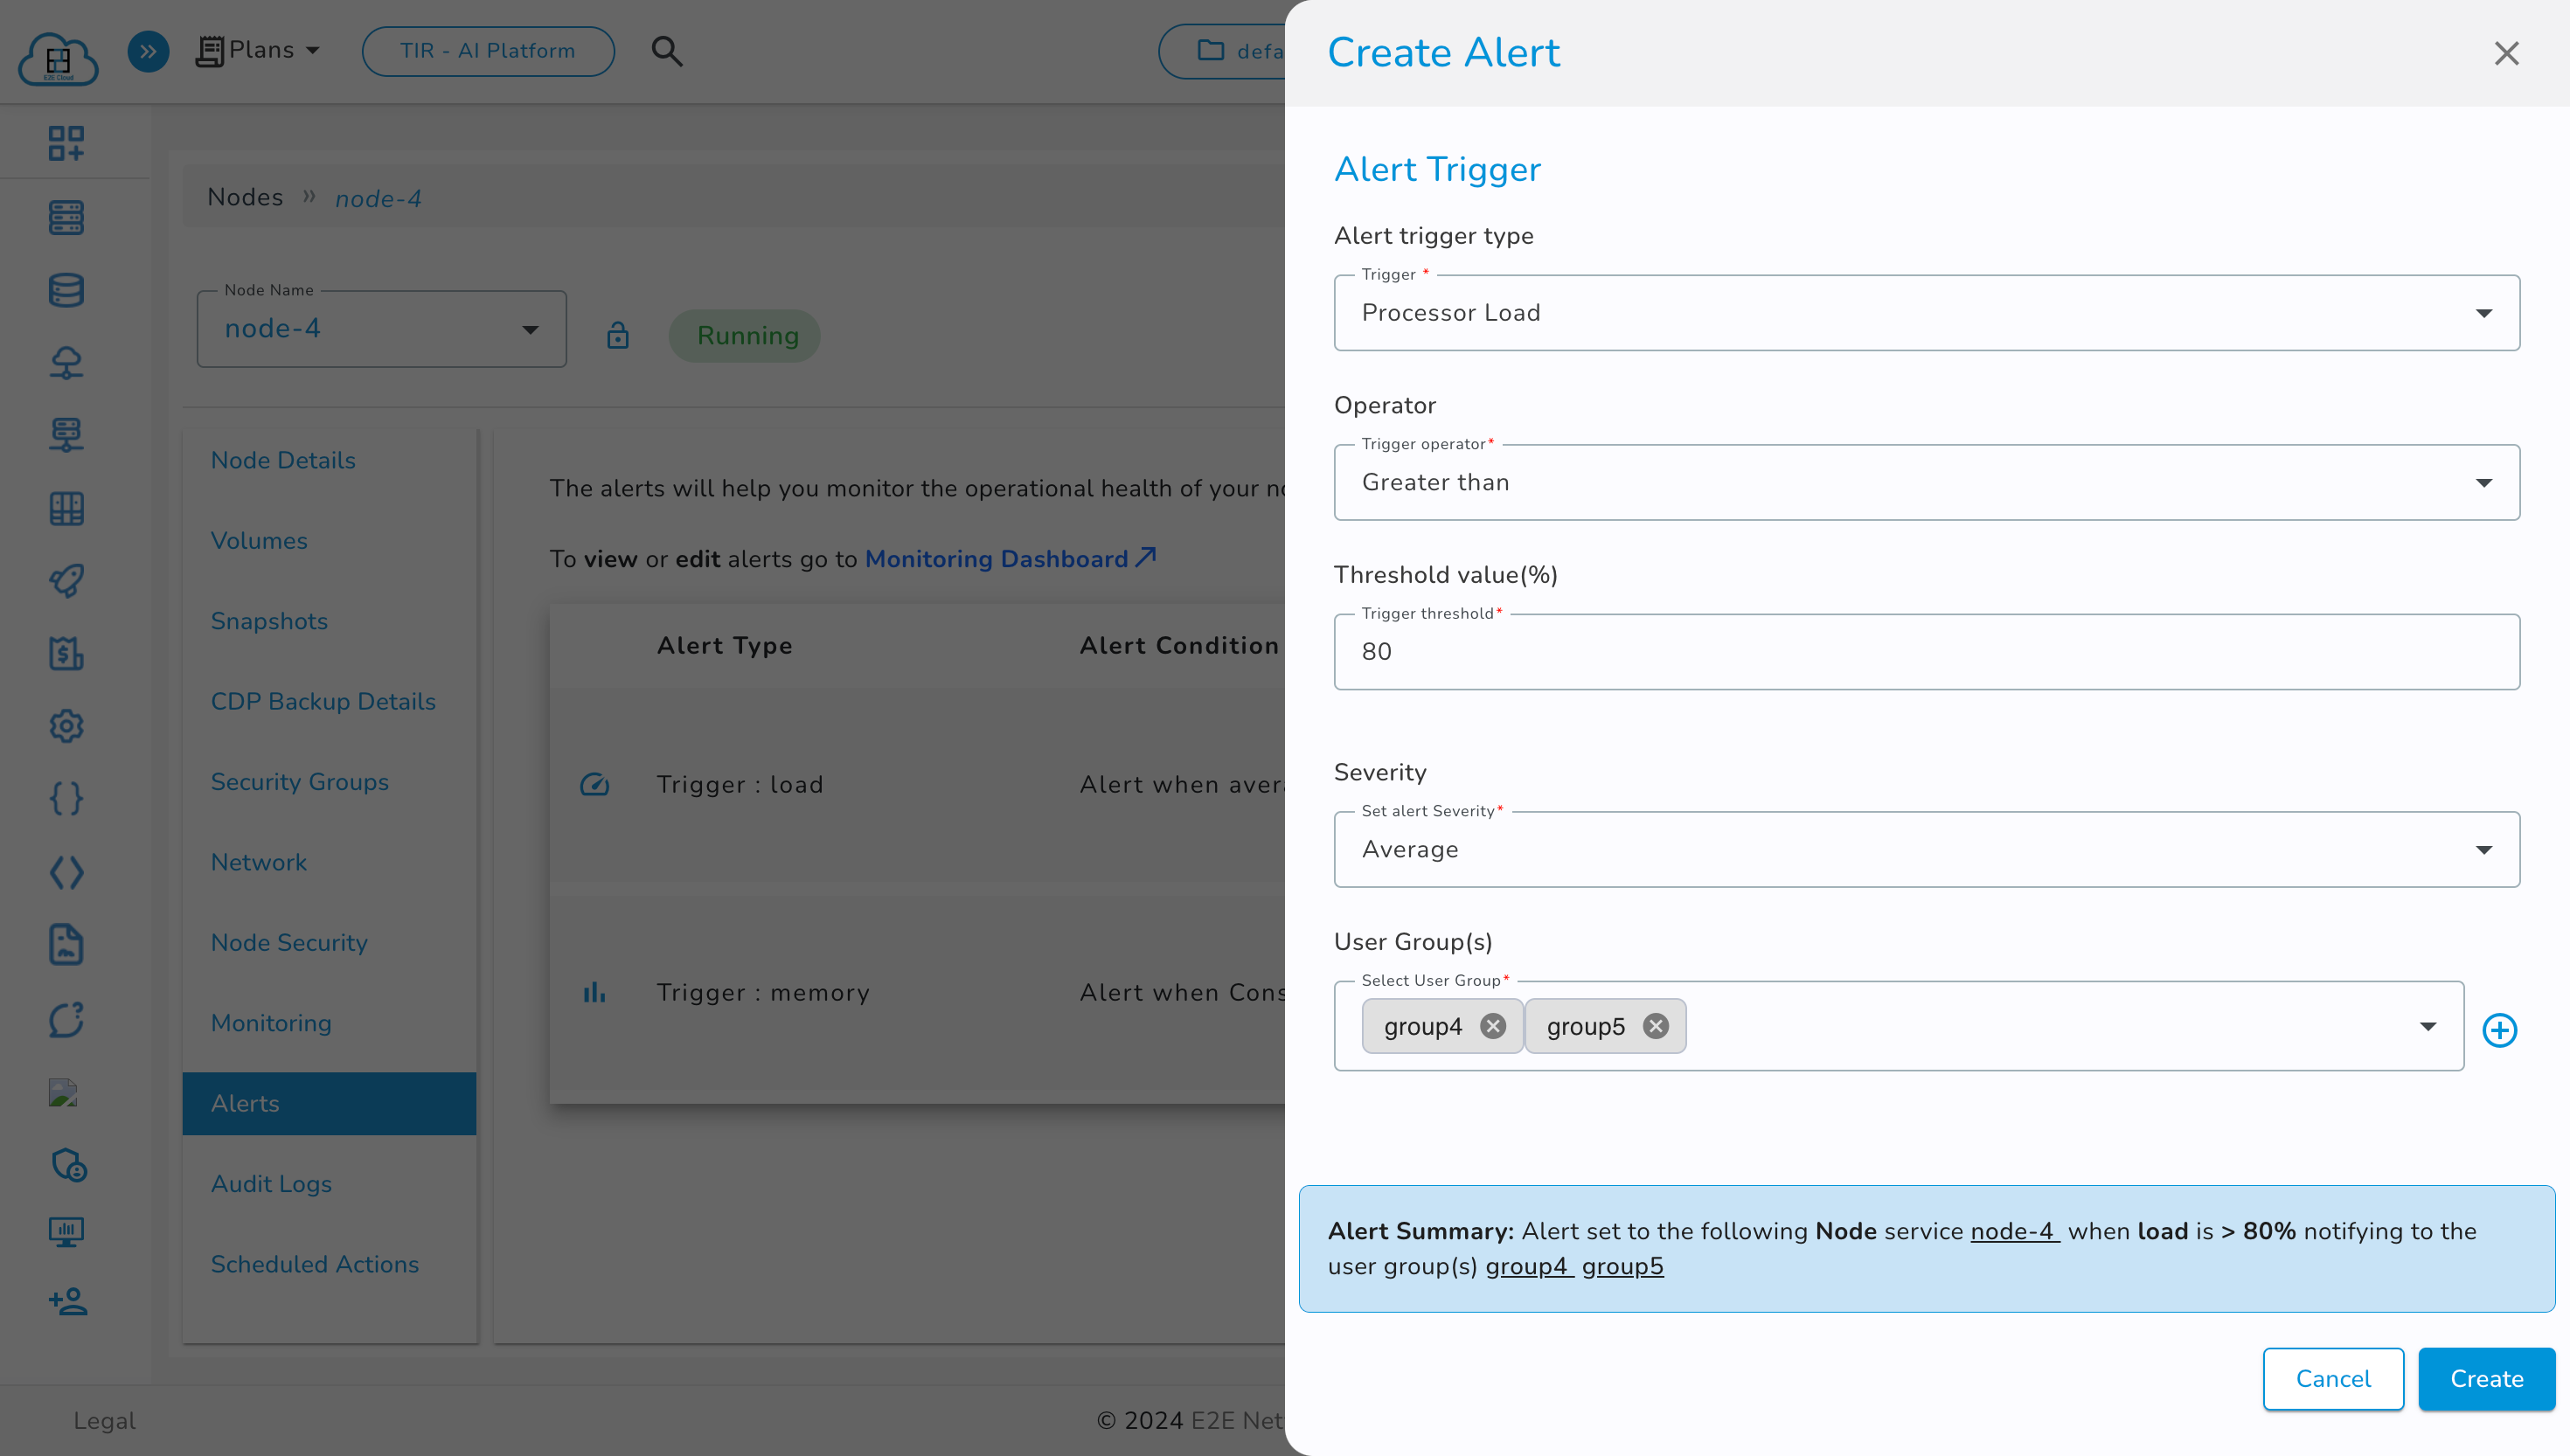
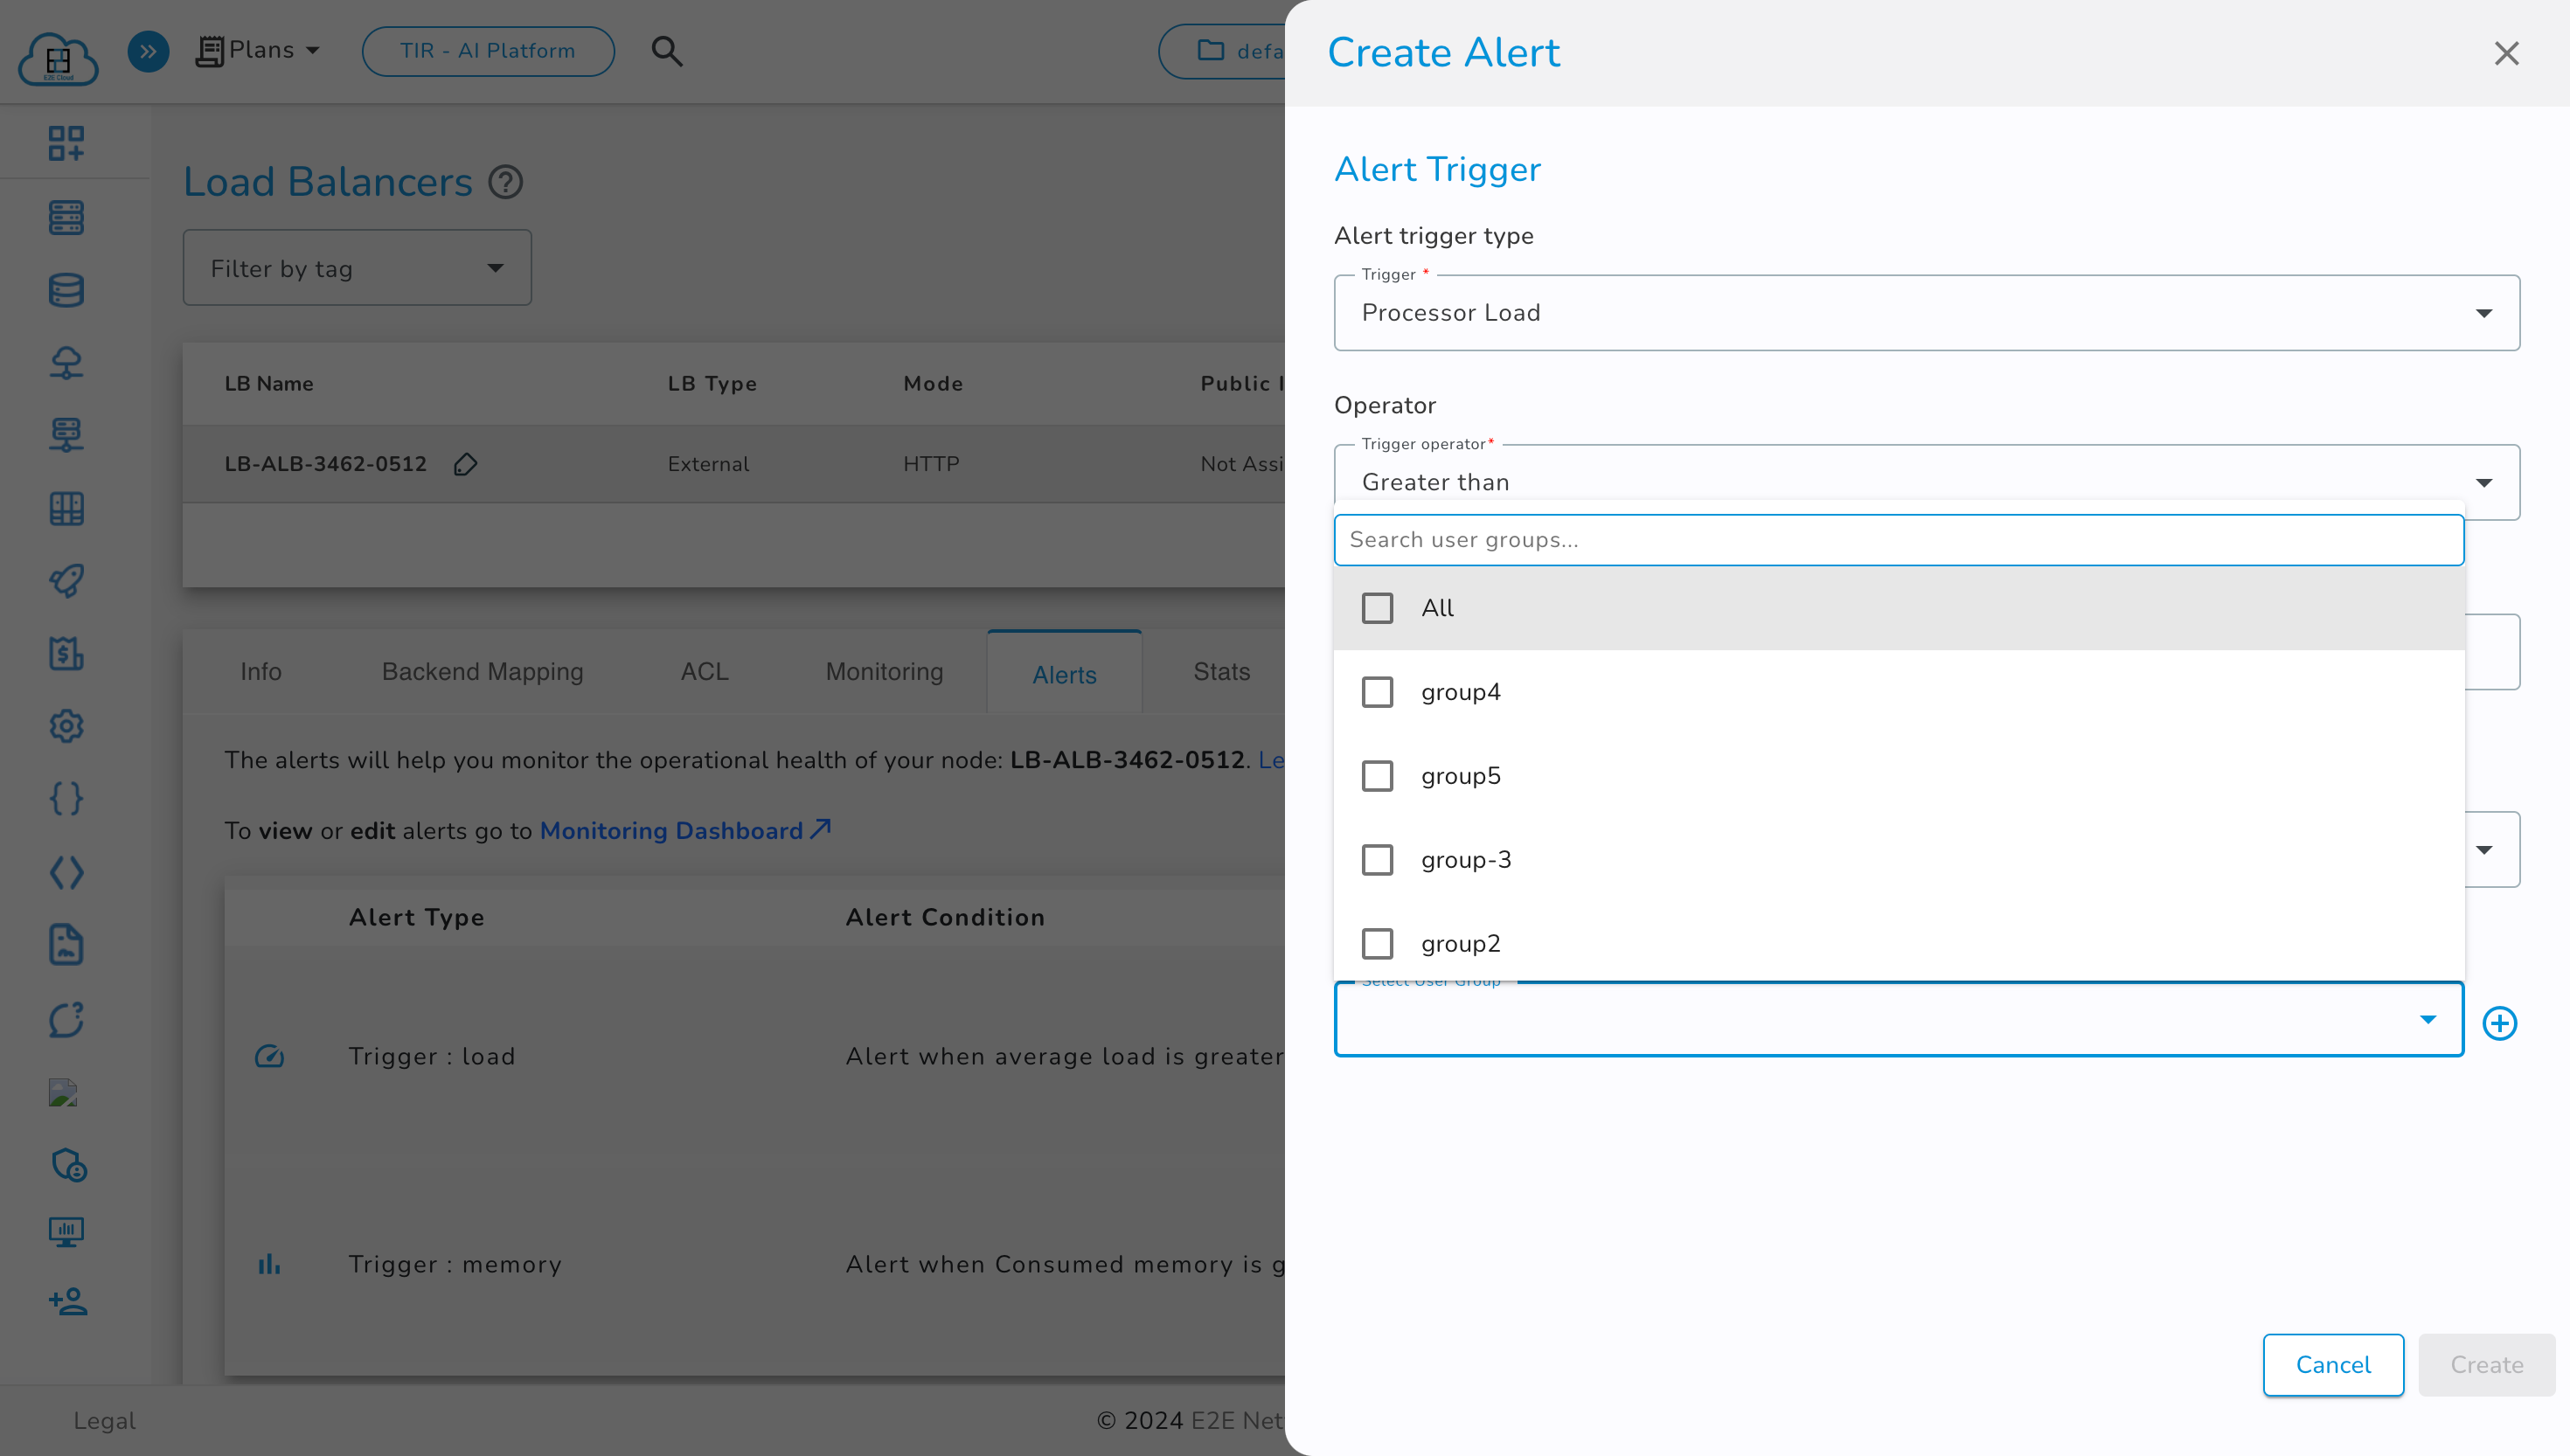
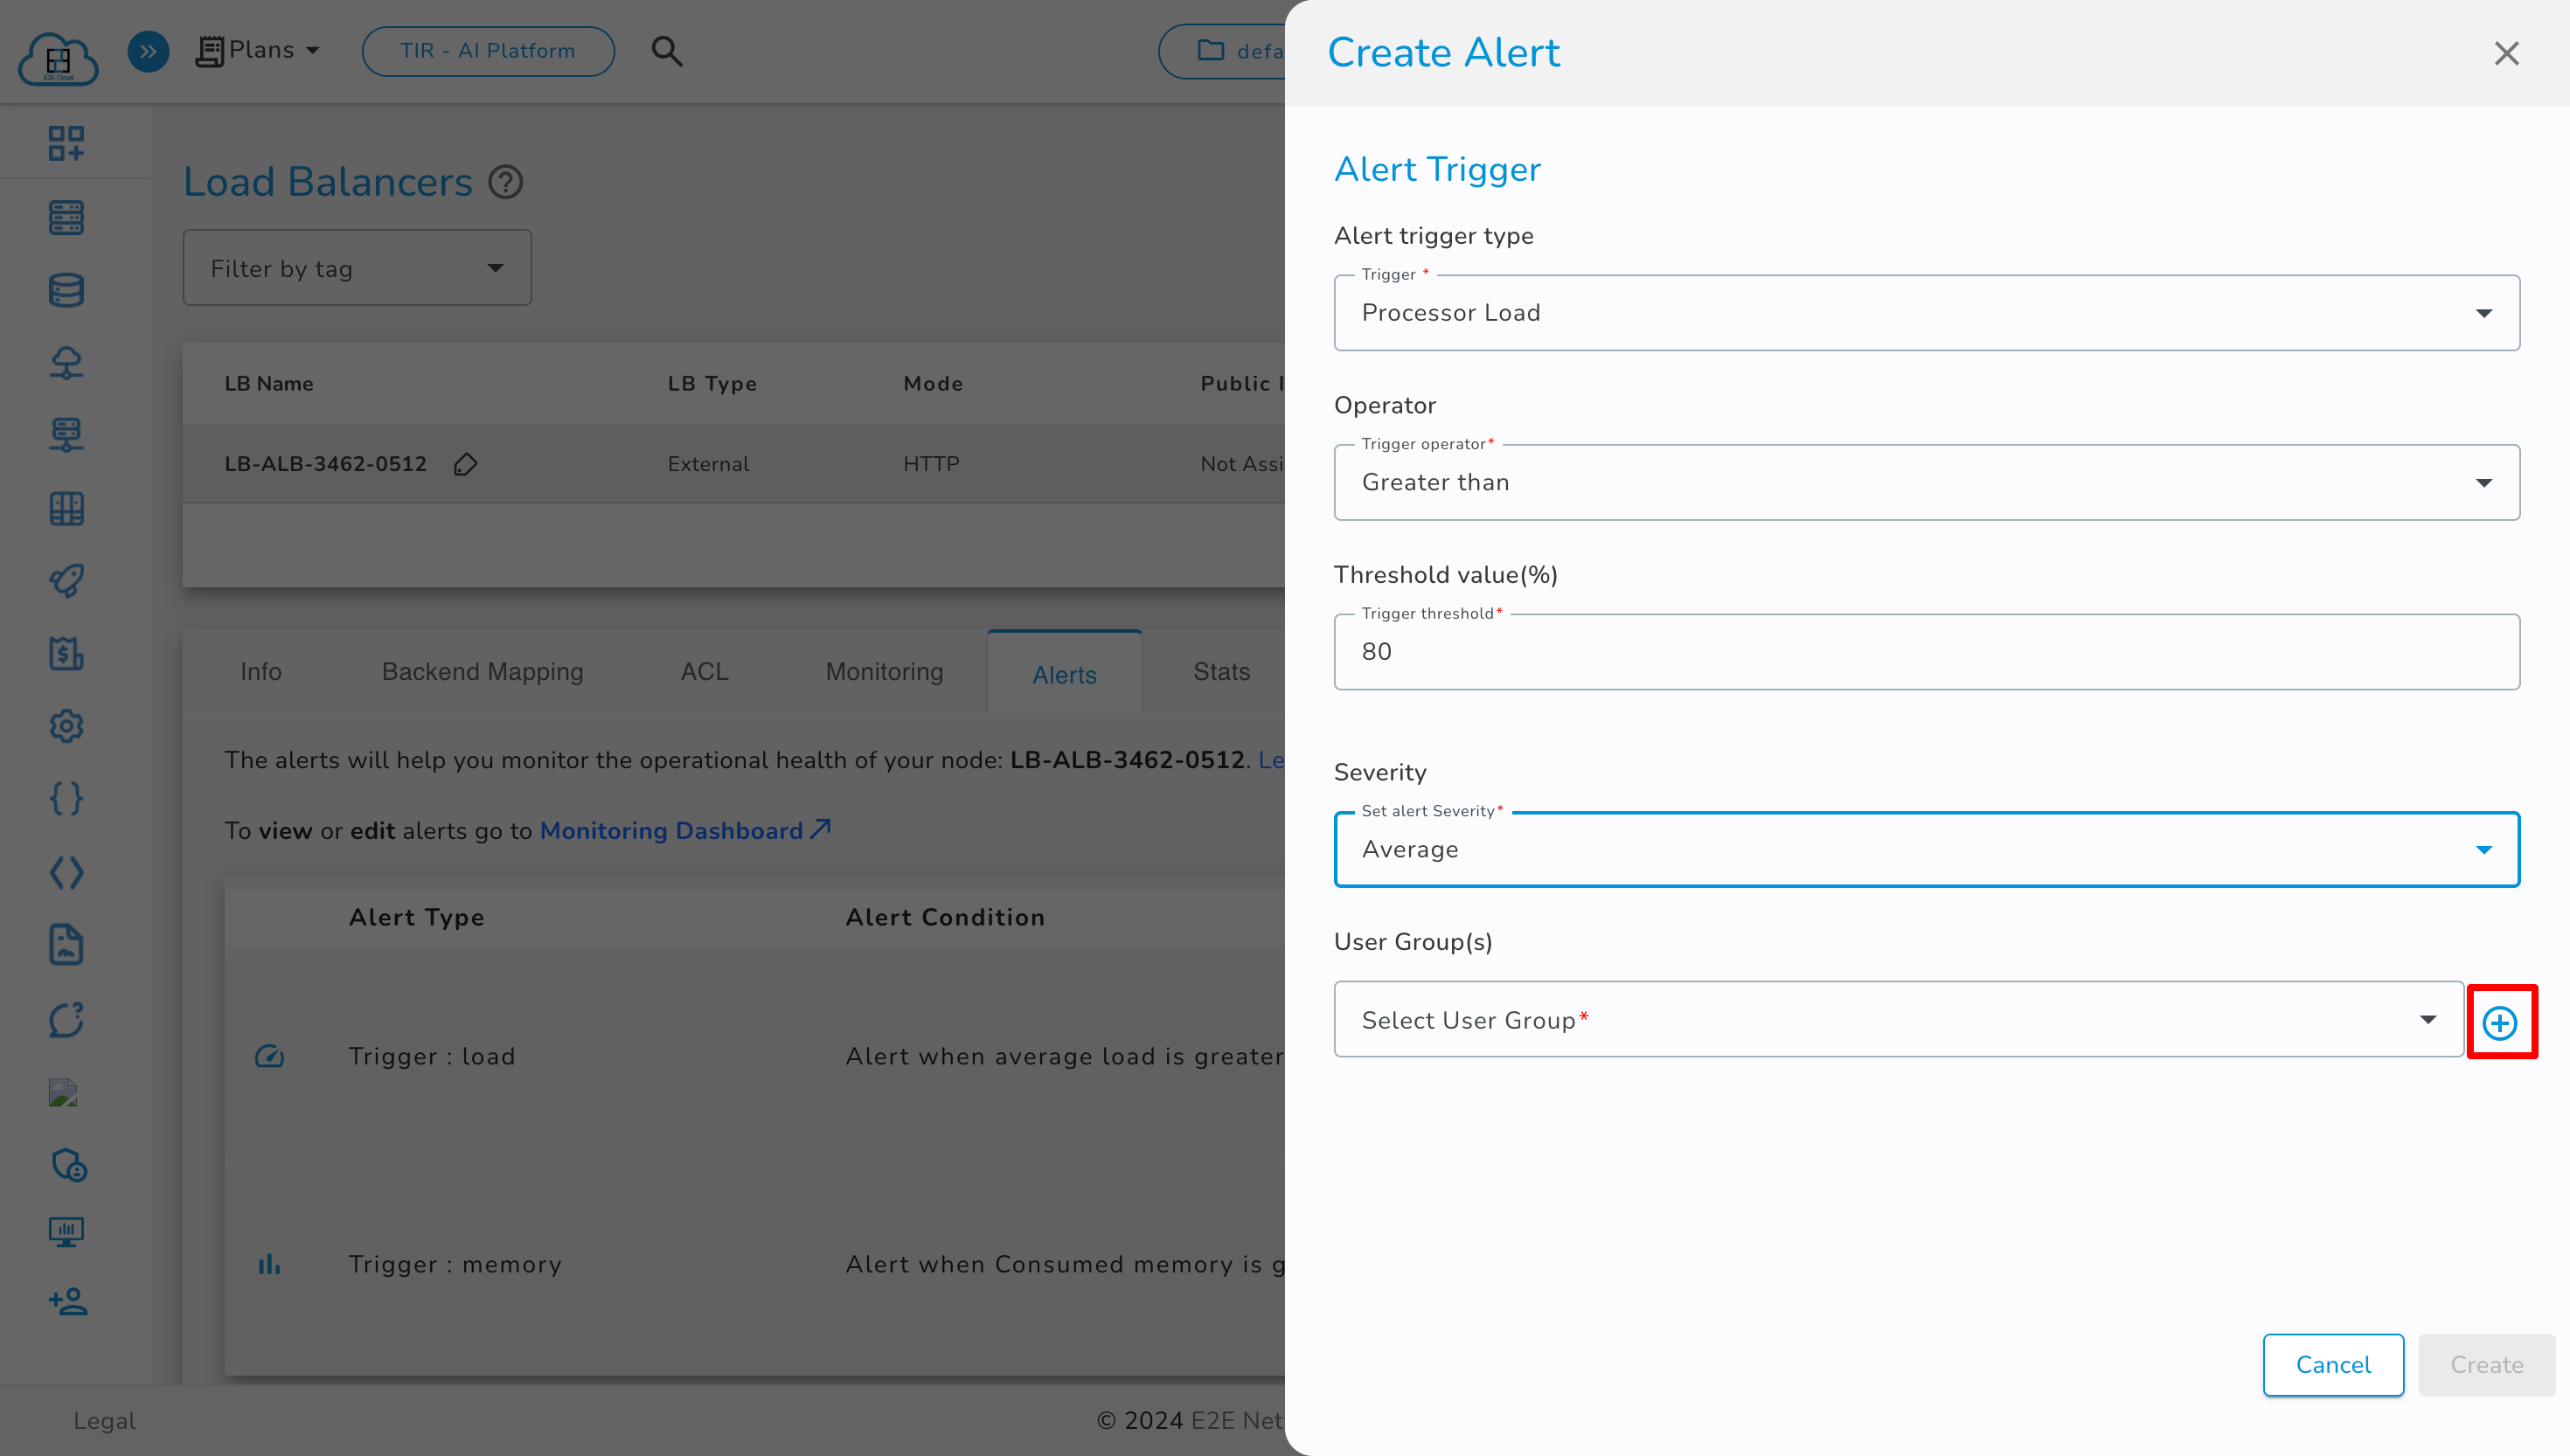
Select the User Group you want to send the alert to. Learn more about User Groups here.
-
Click the ‘Create’ button to save the alert.
-
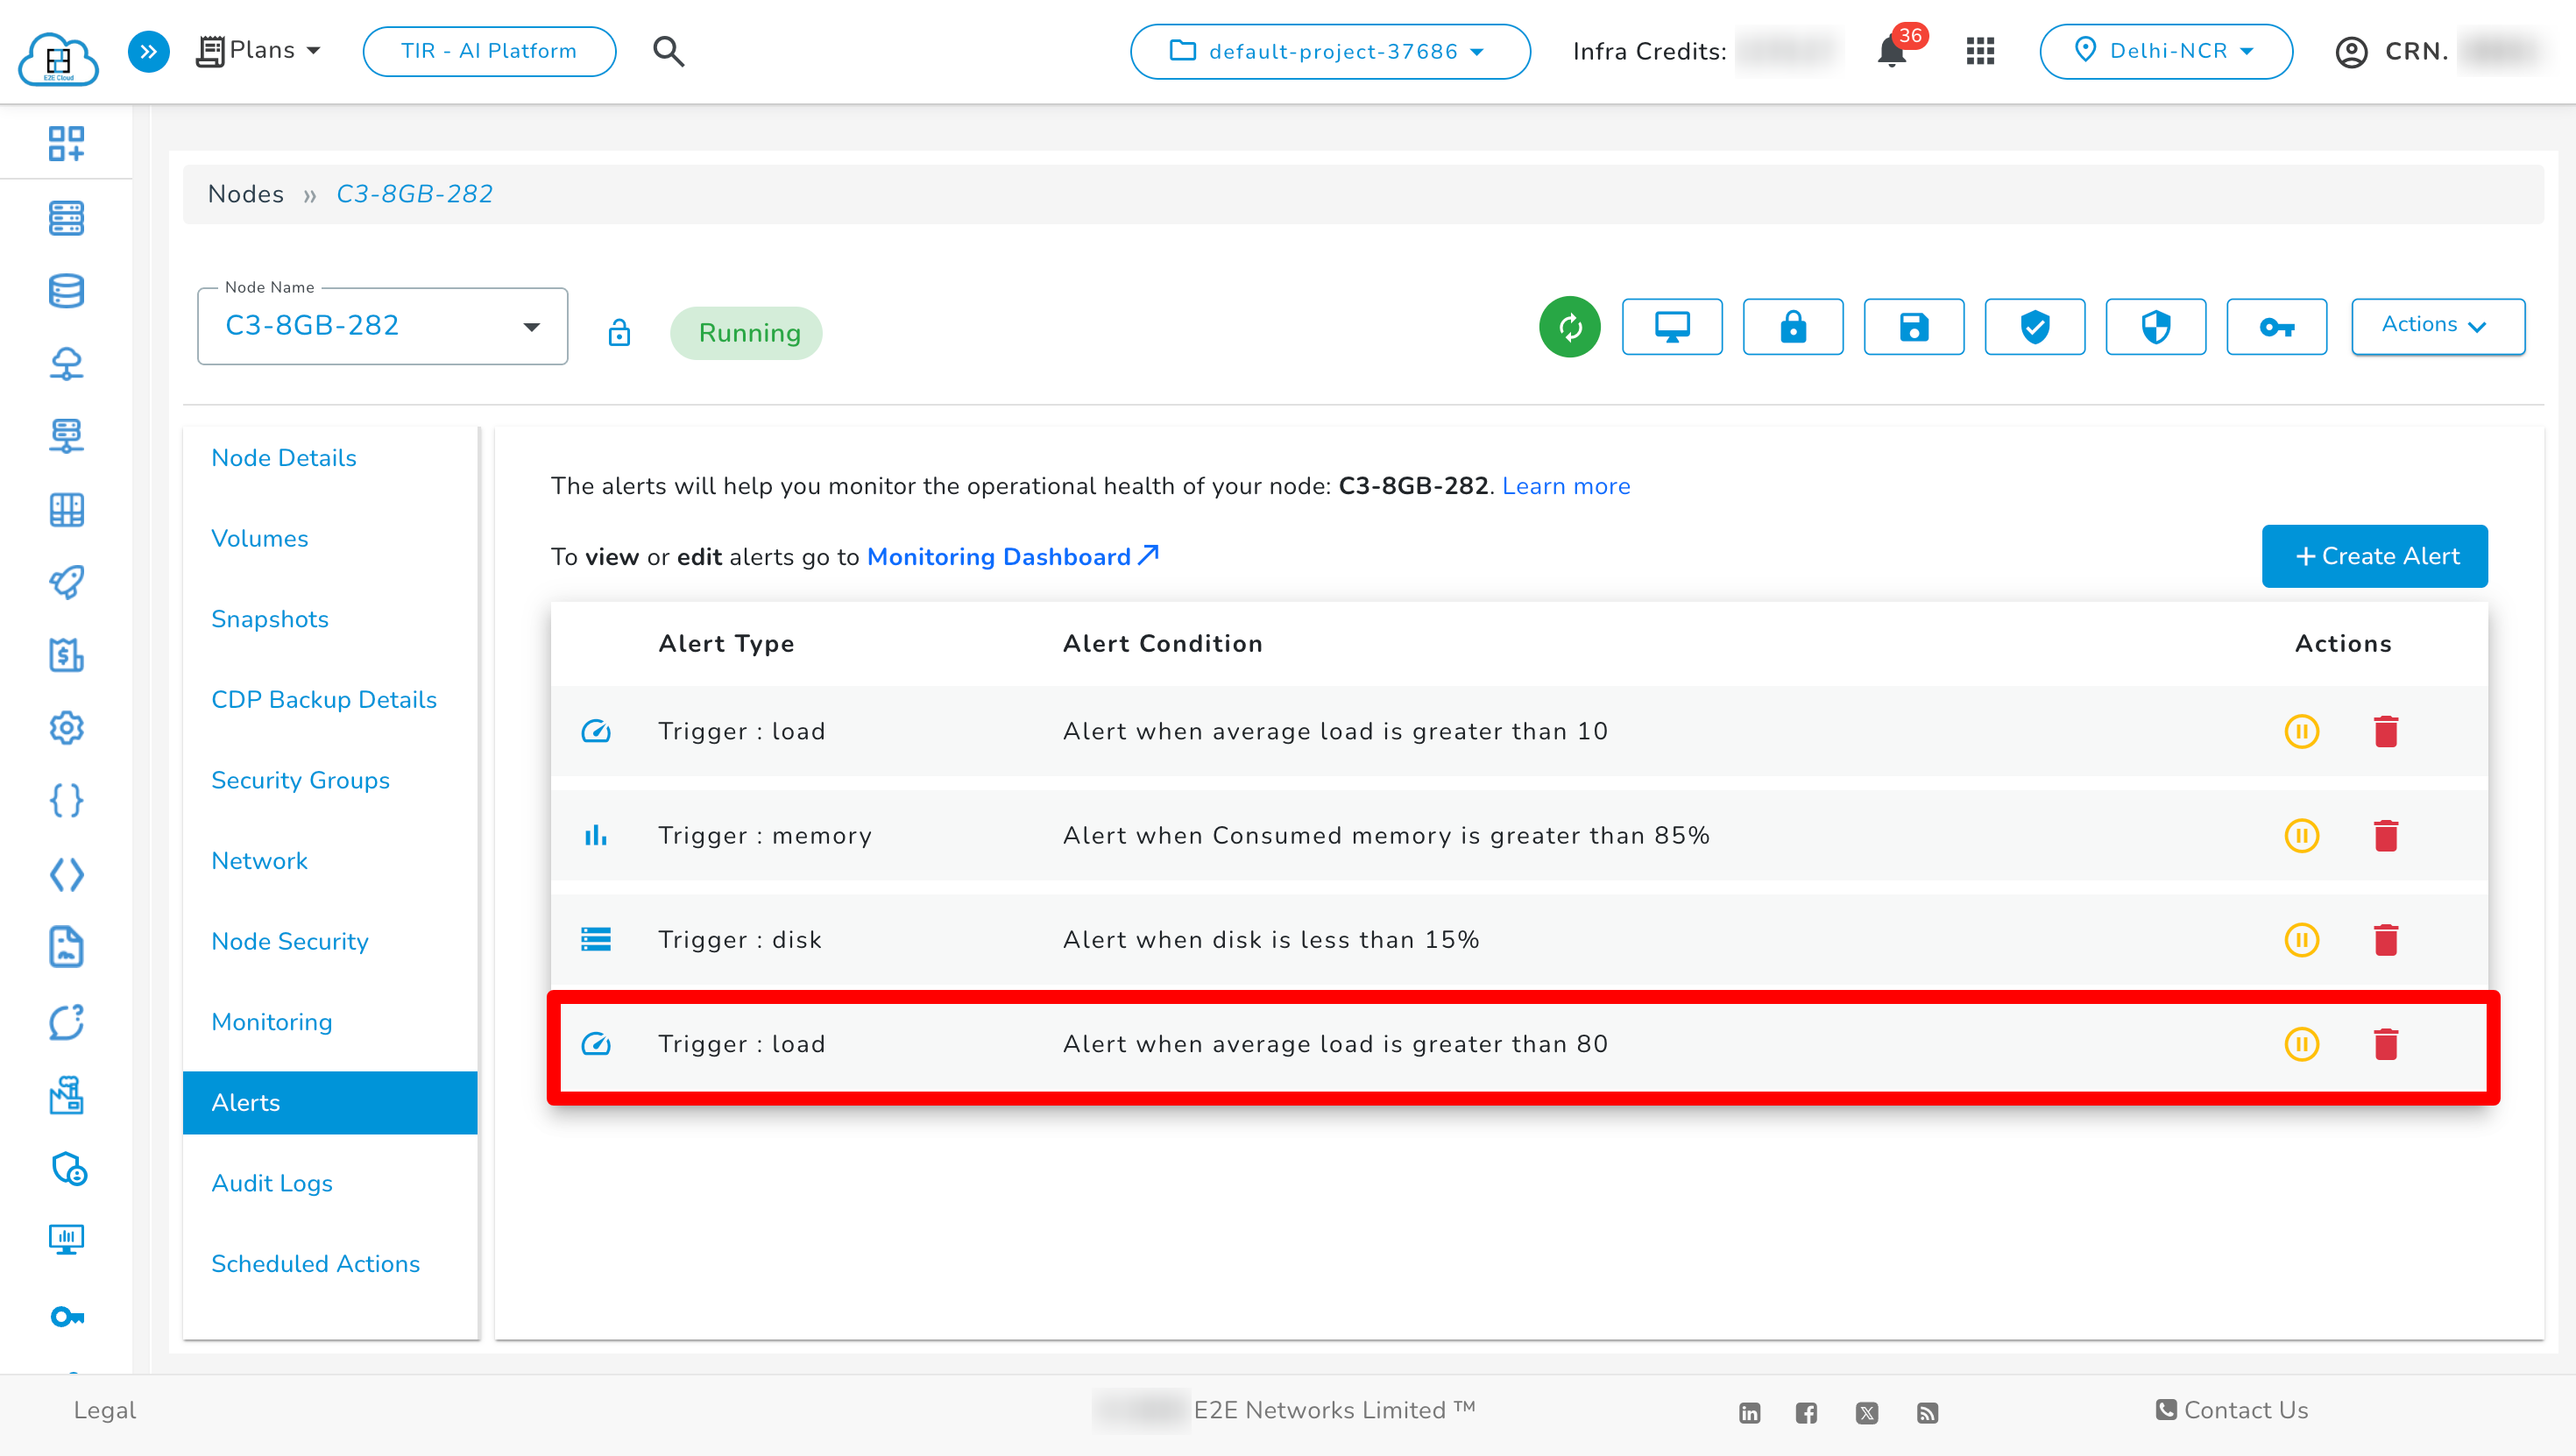
View created alerts in the Alerts section.
Create User Group
-
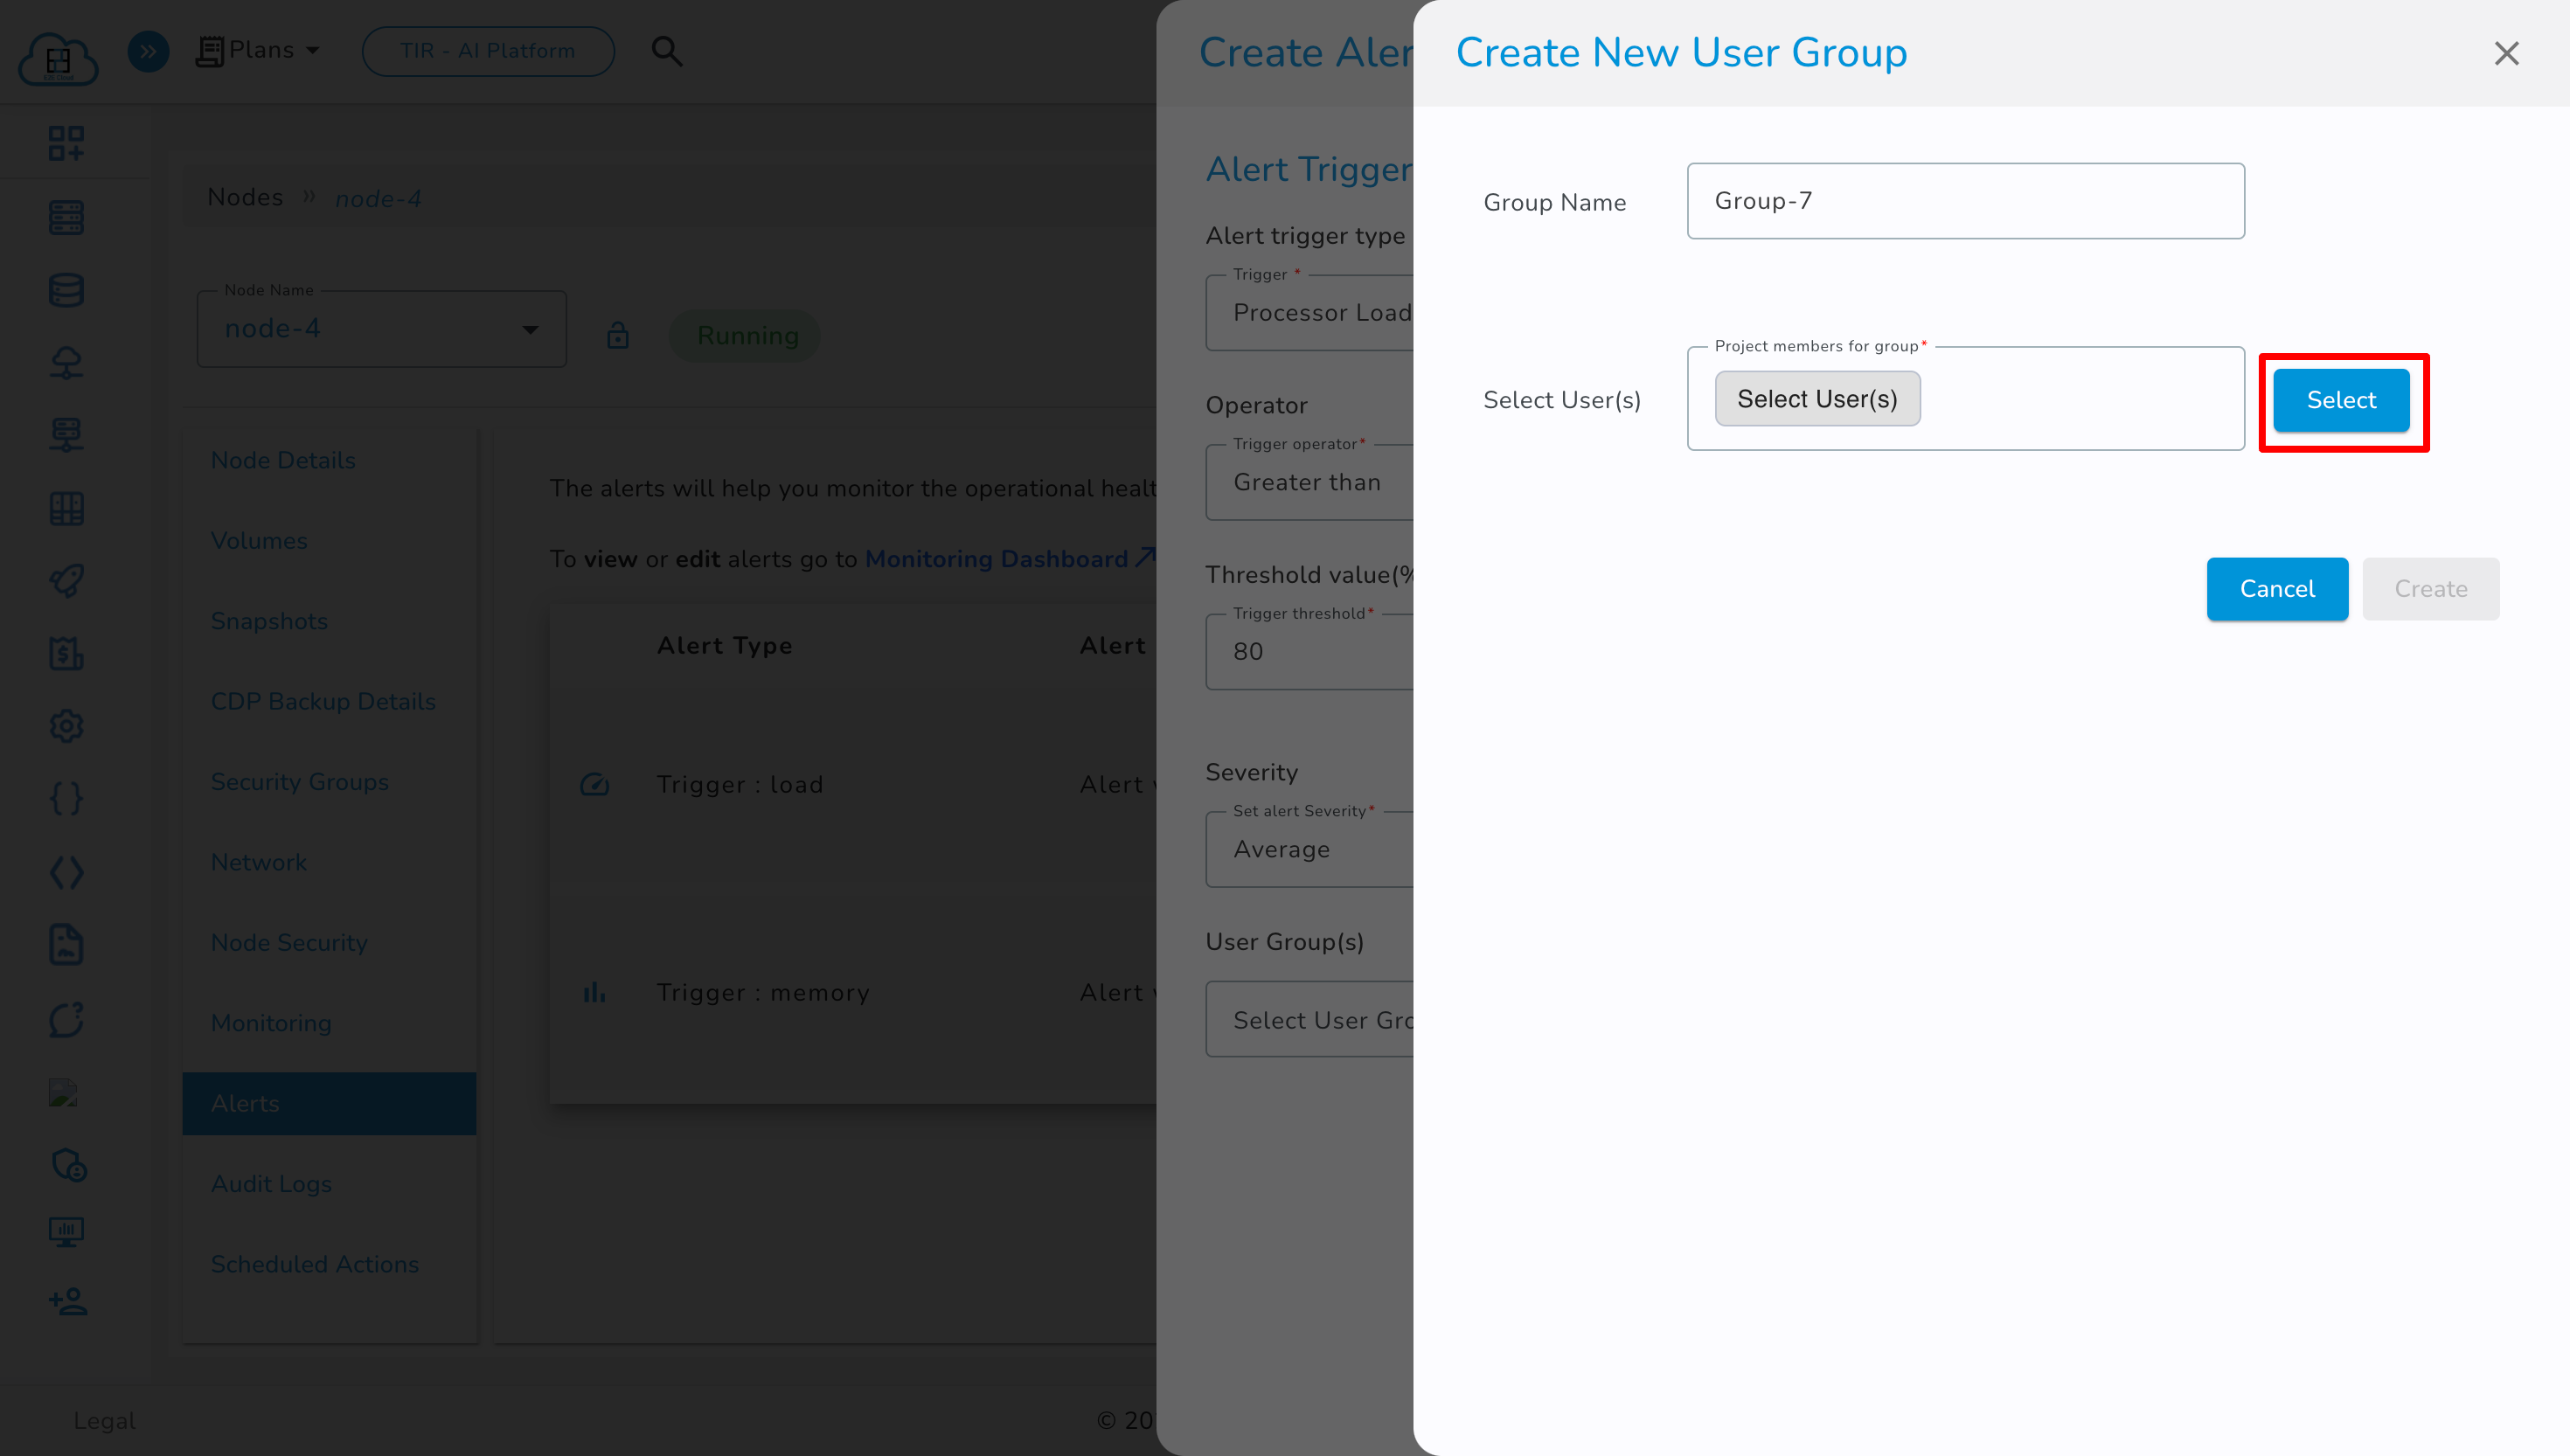
While setting up an alert, click the ‘+’ button to create a new user group.
-
Enter the group name and click the 'Select' button to add users.
-
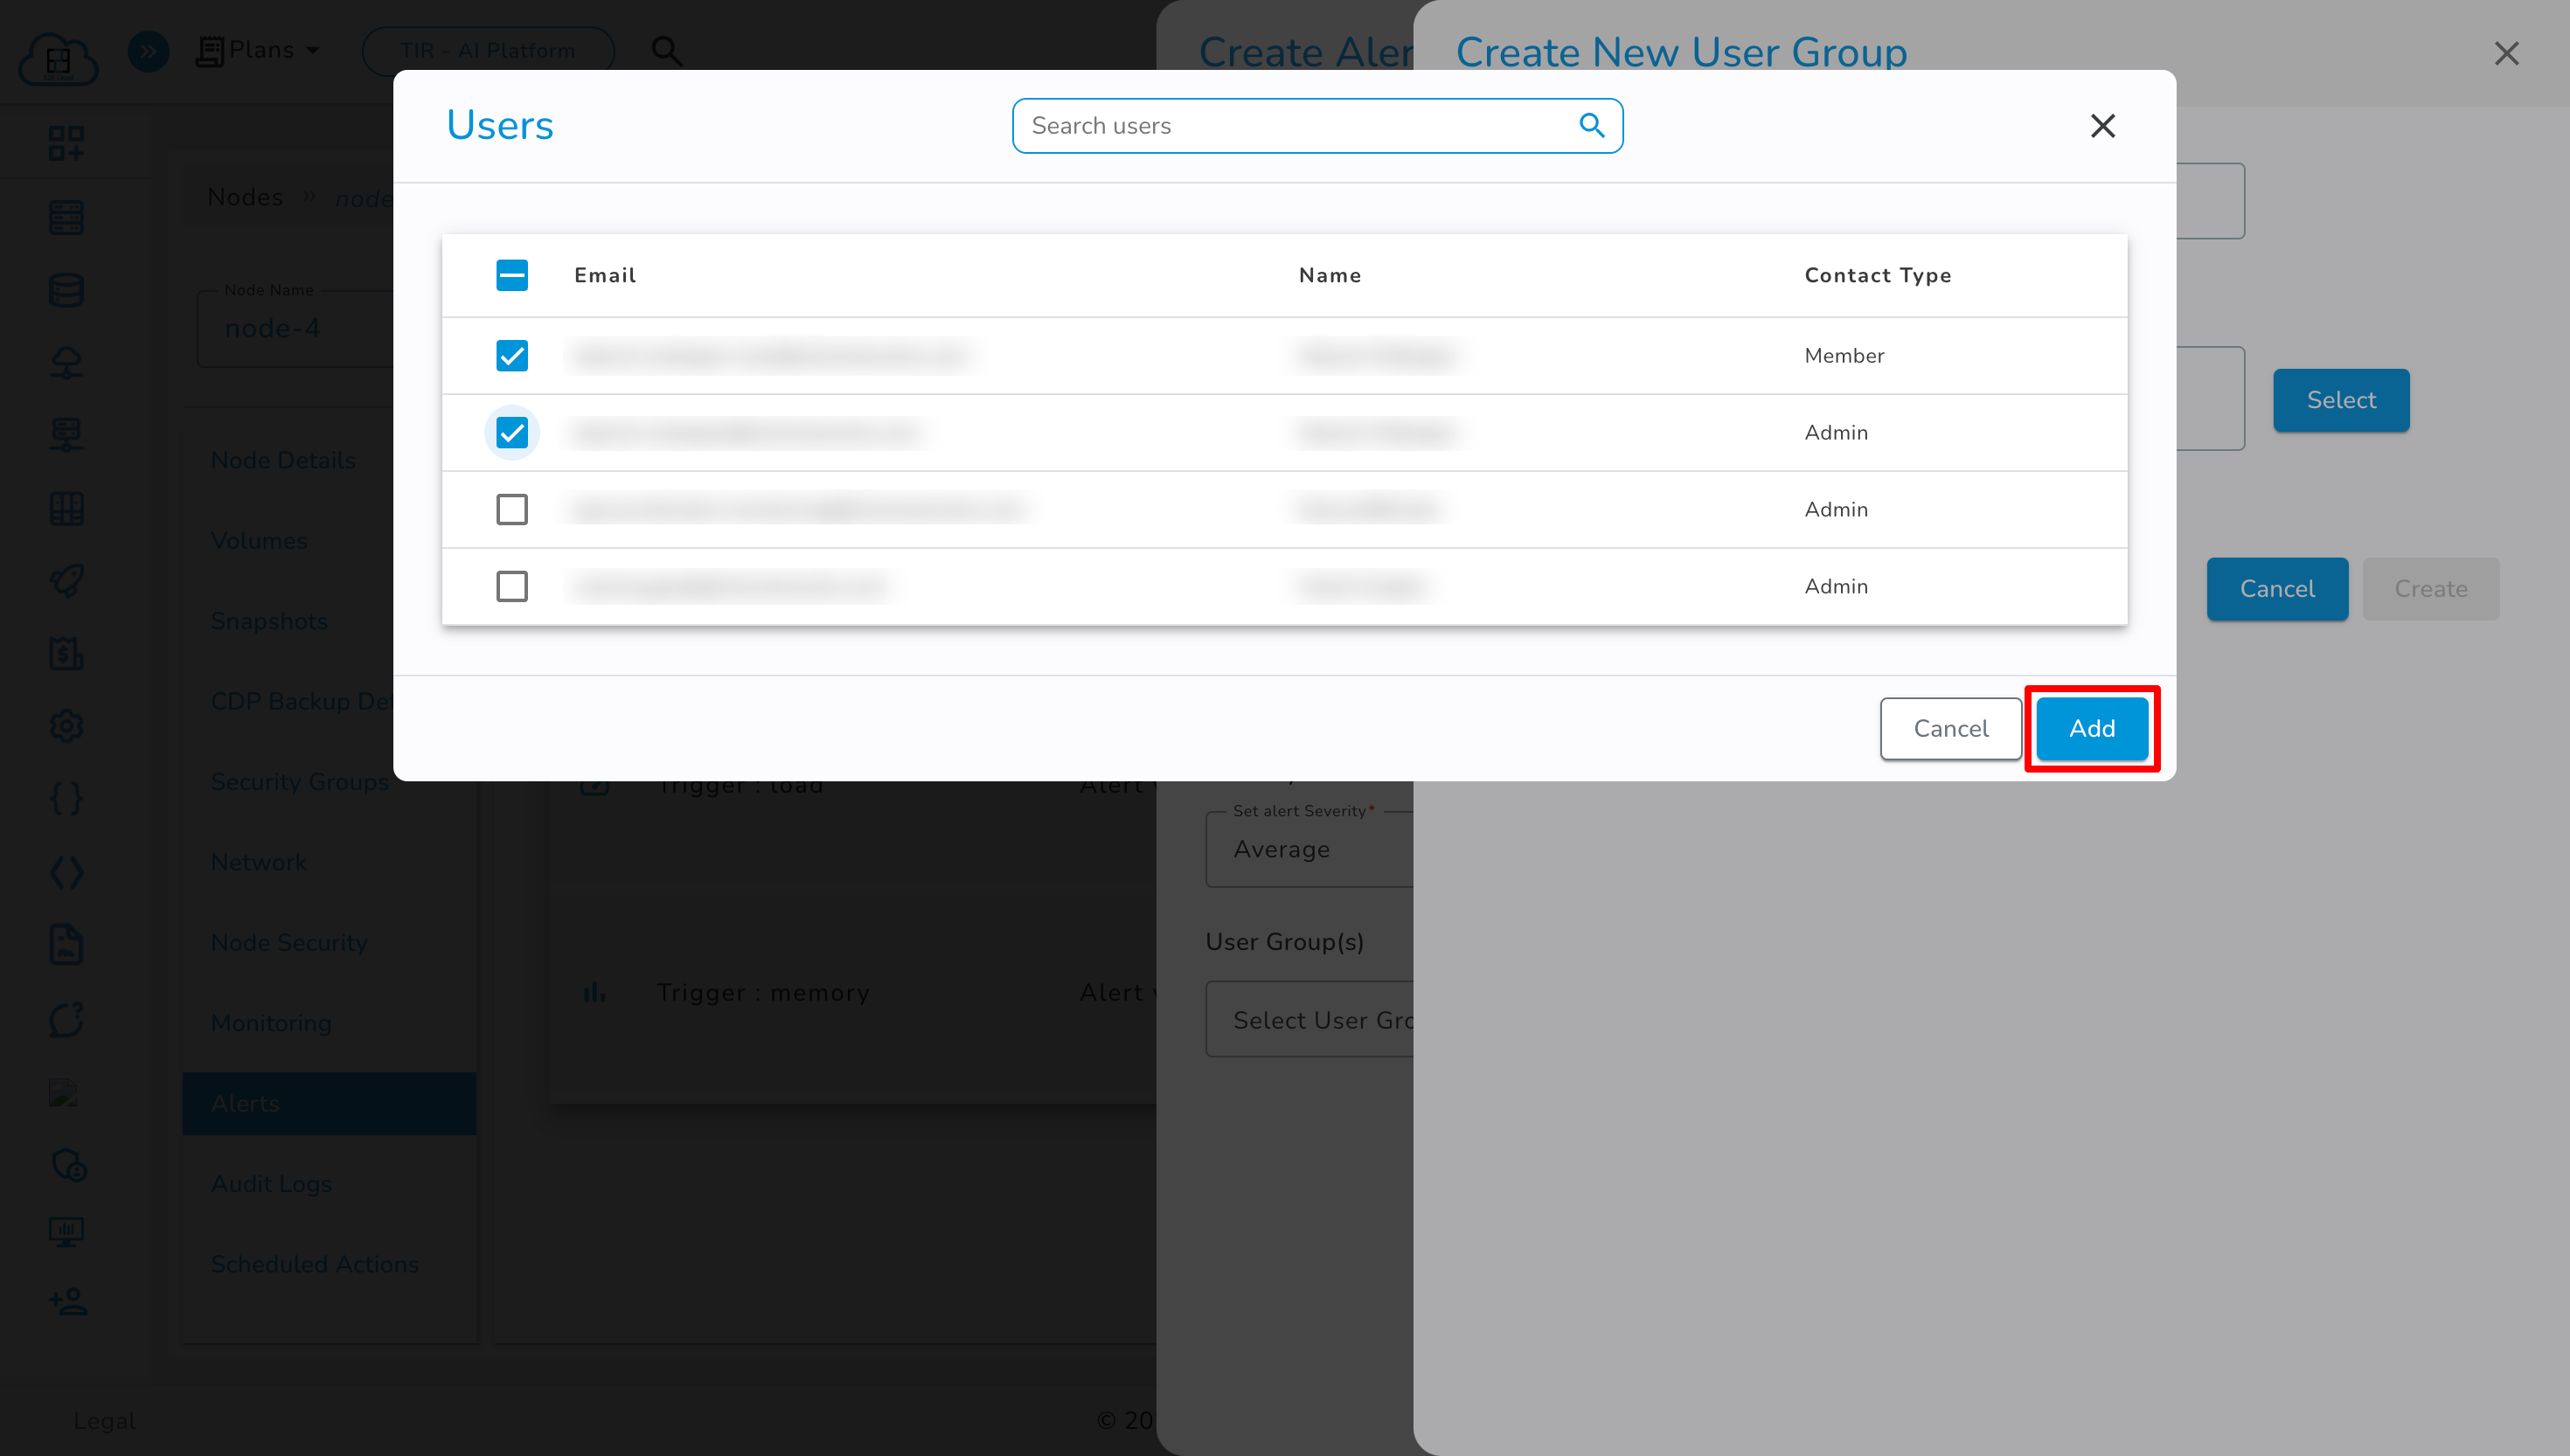
Select users from the list and click 'Add' to include them.
-
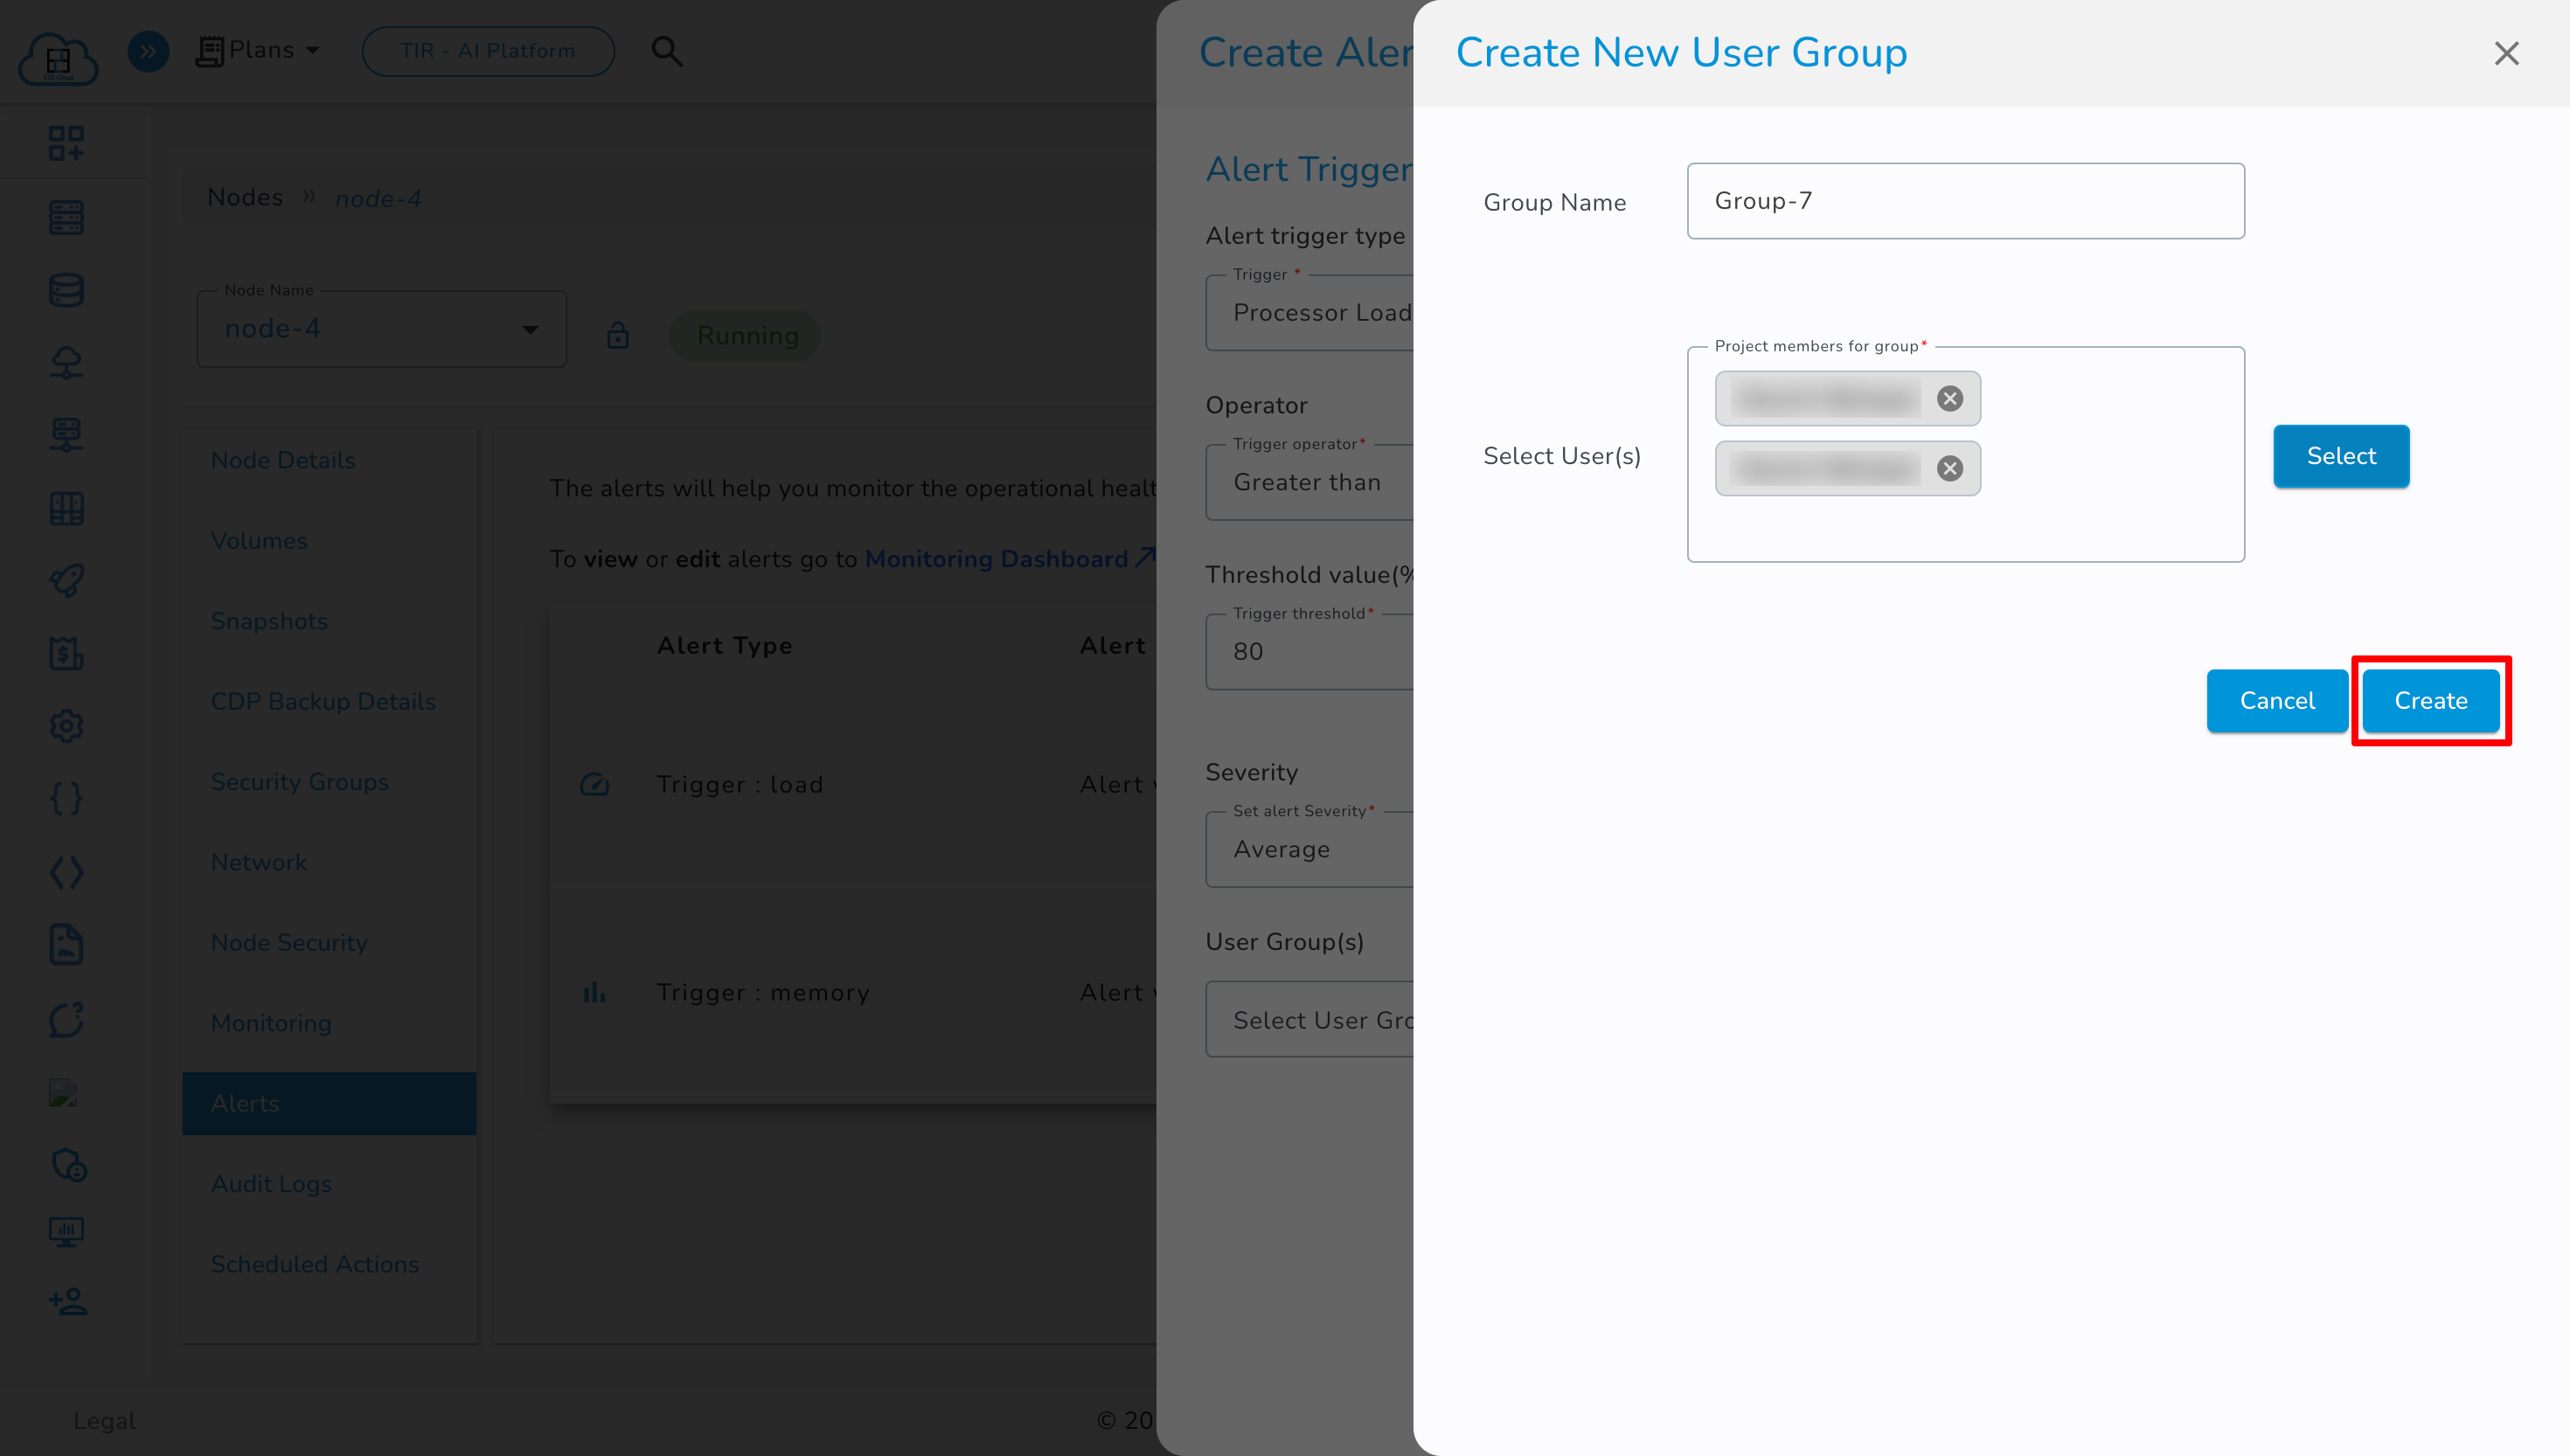
Click the ‘Create’ button to finalize the user group.
Pause and Resume Node Alerts
You can pause or resume specific node alerts directly from the Alerts tab in the MyAccount portal. This is useful during maintenance or known issue periods when you want to temporarily disable notifications without deleting the alert.
Pause Node Alert
-
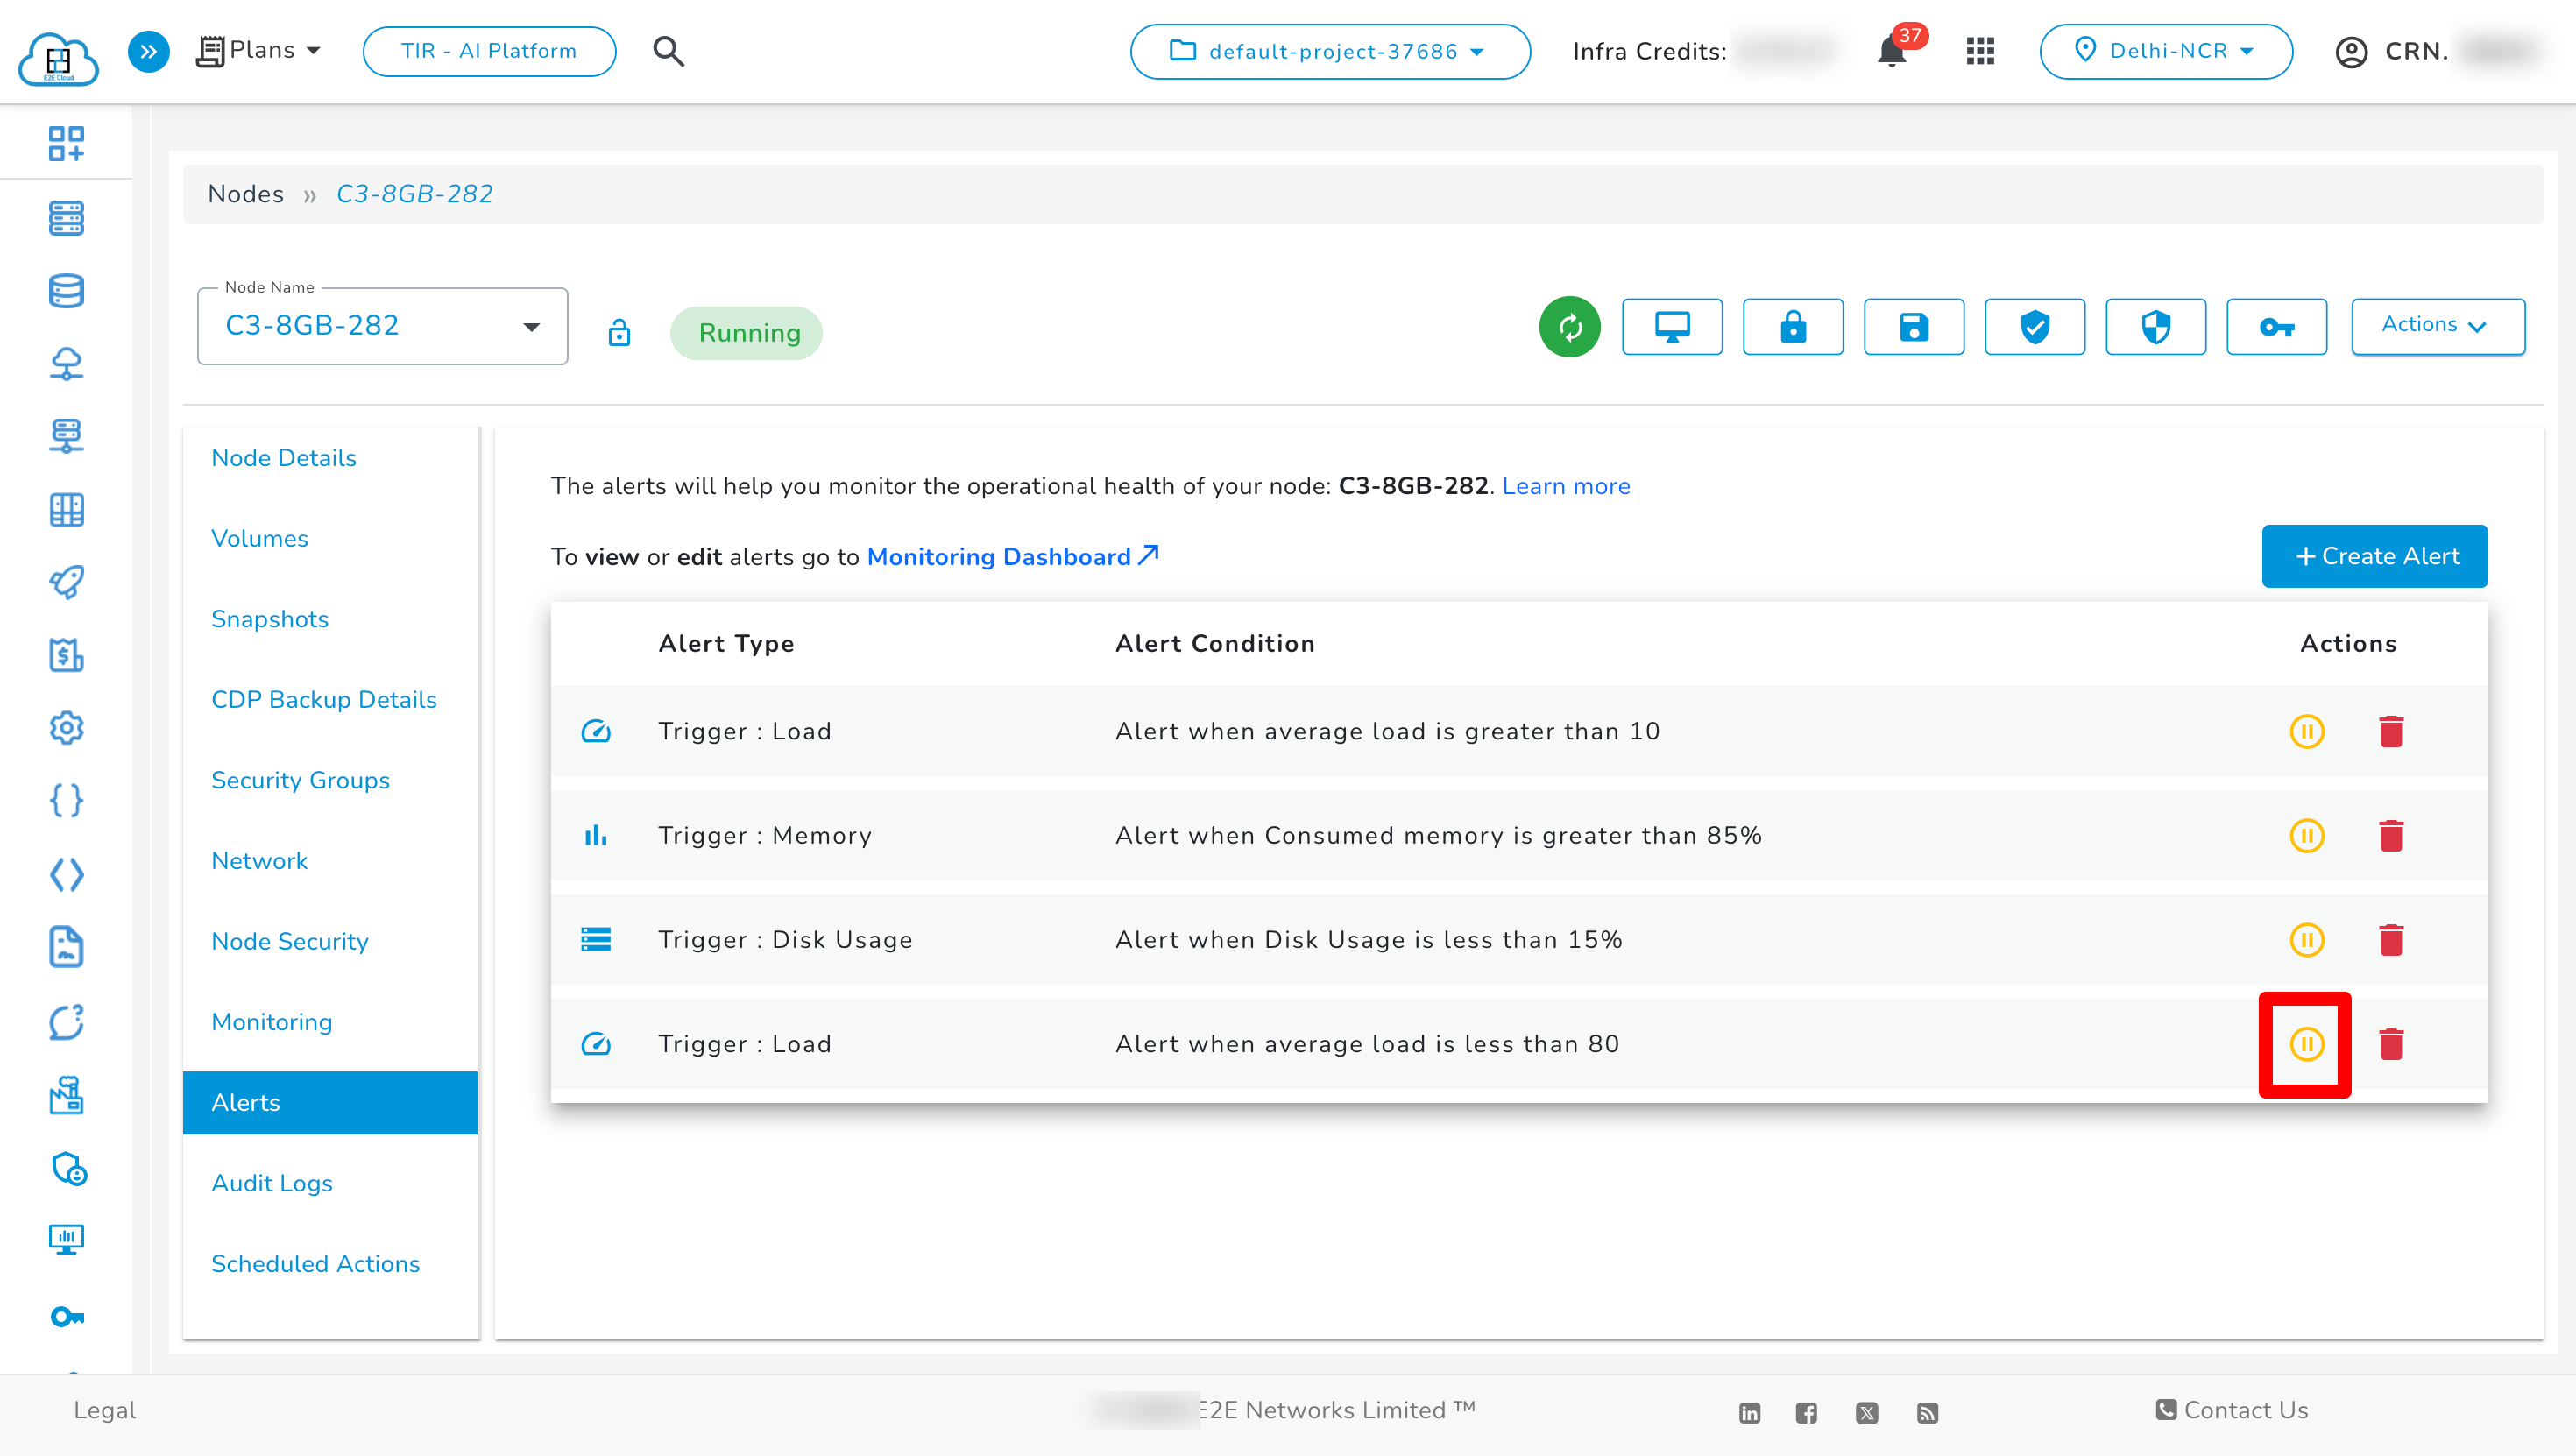
Go to the Node page and click the Alerts tab.
-
In the Actions column, click the yellow pause icon for the alert you wish to pause.
-
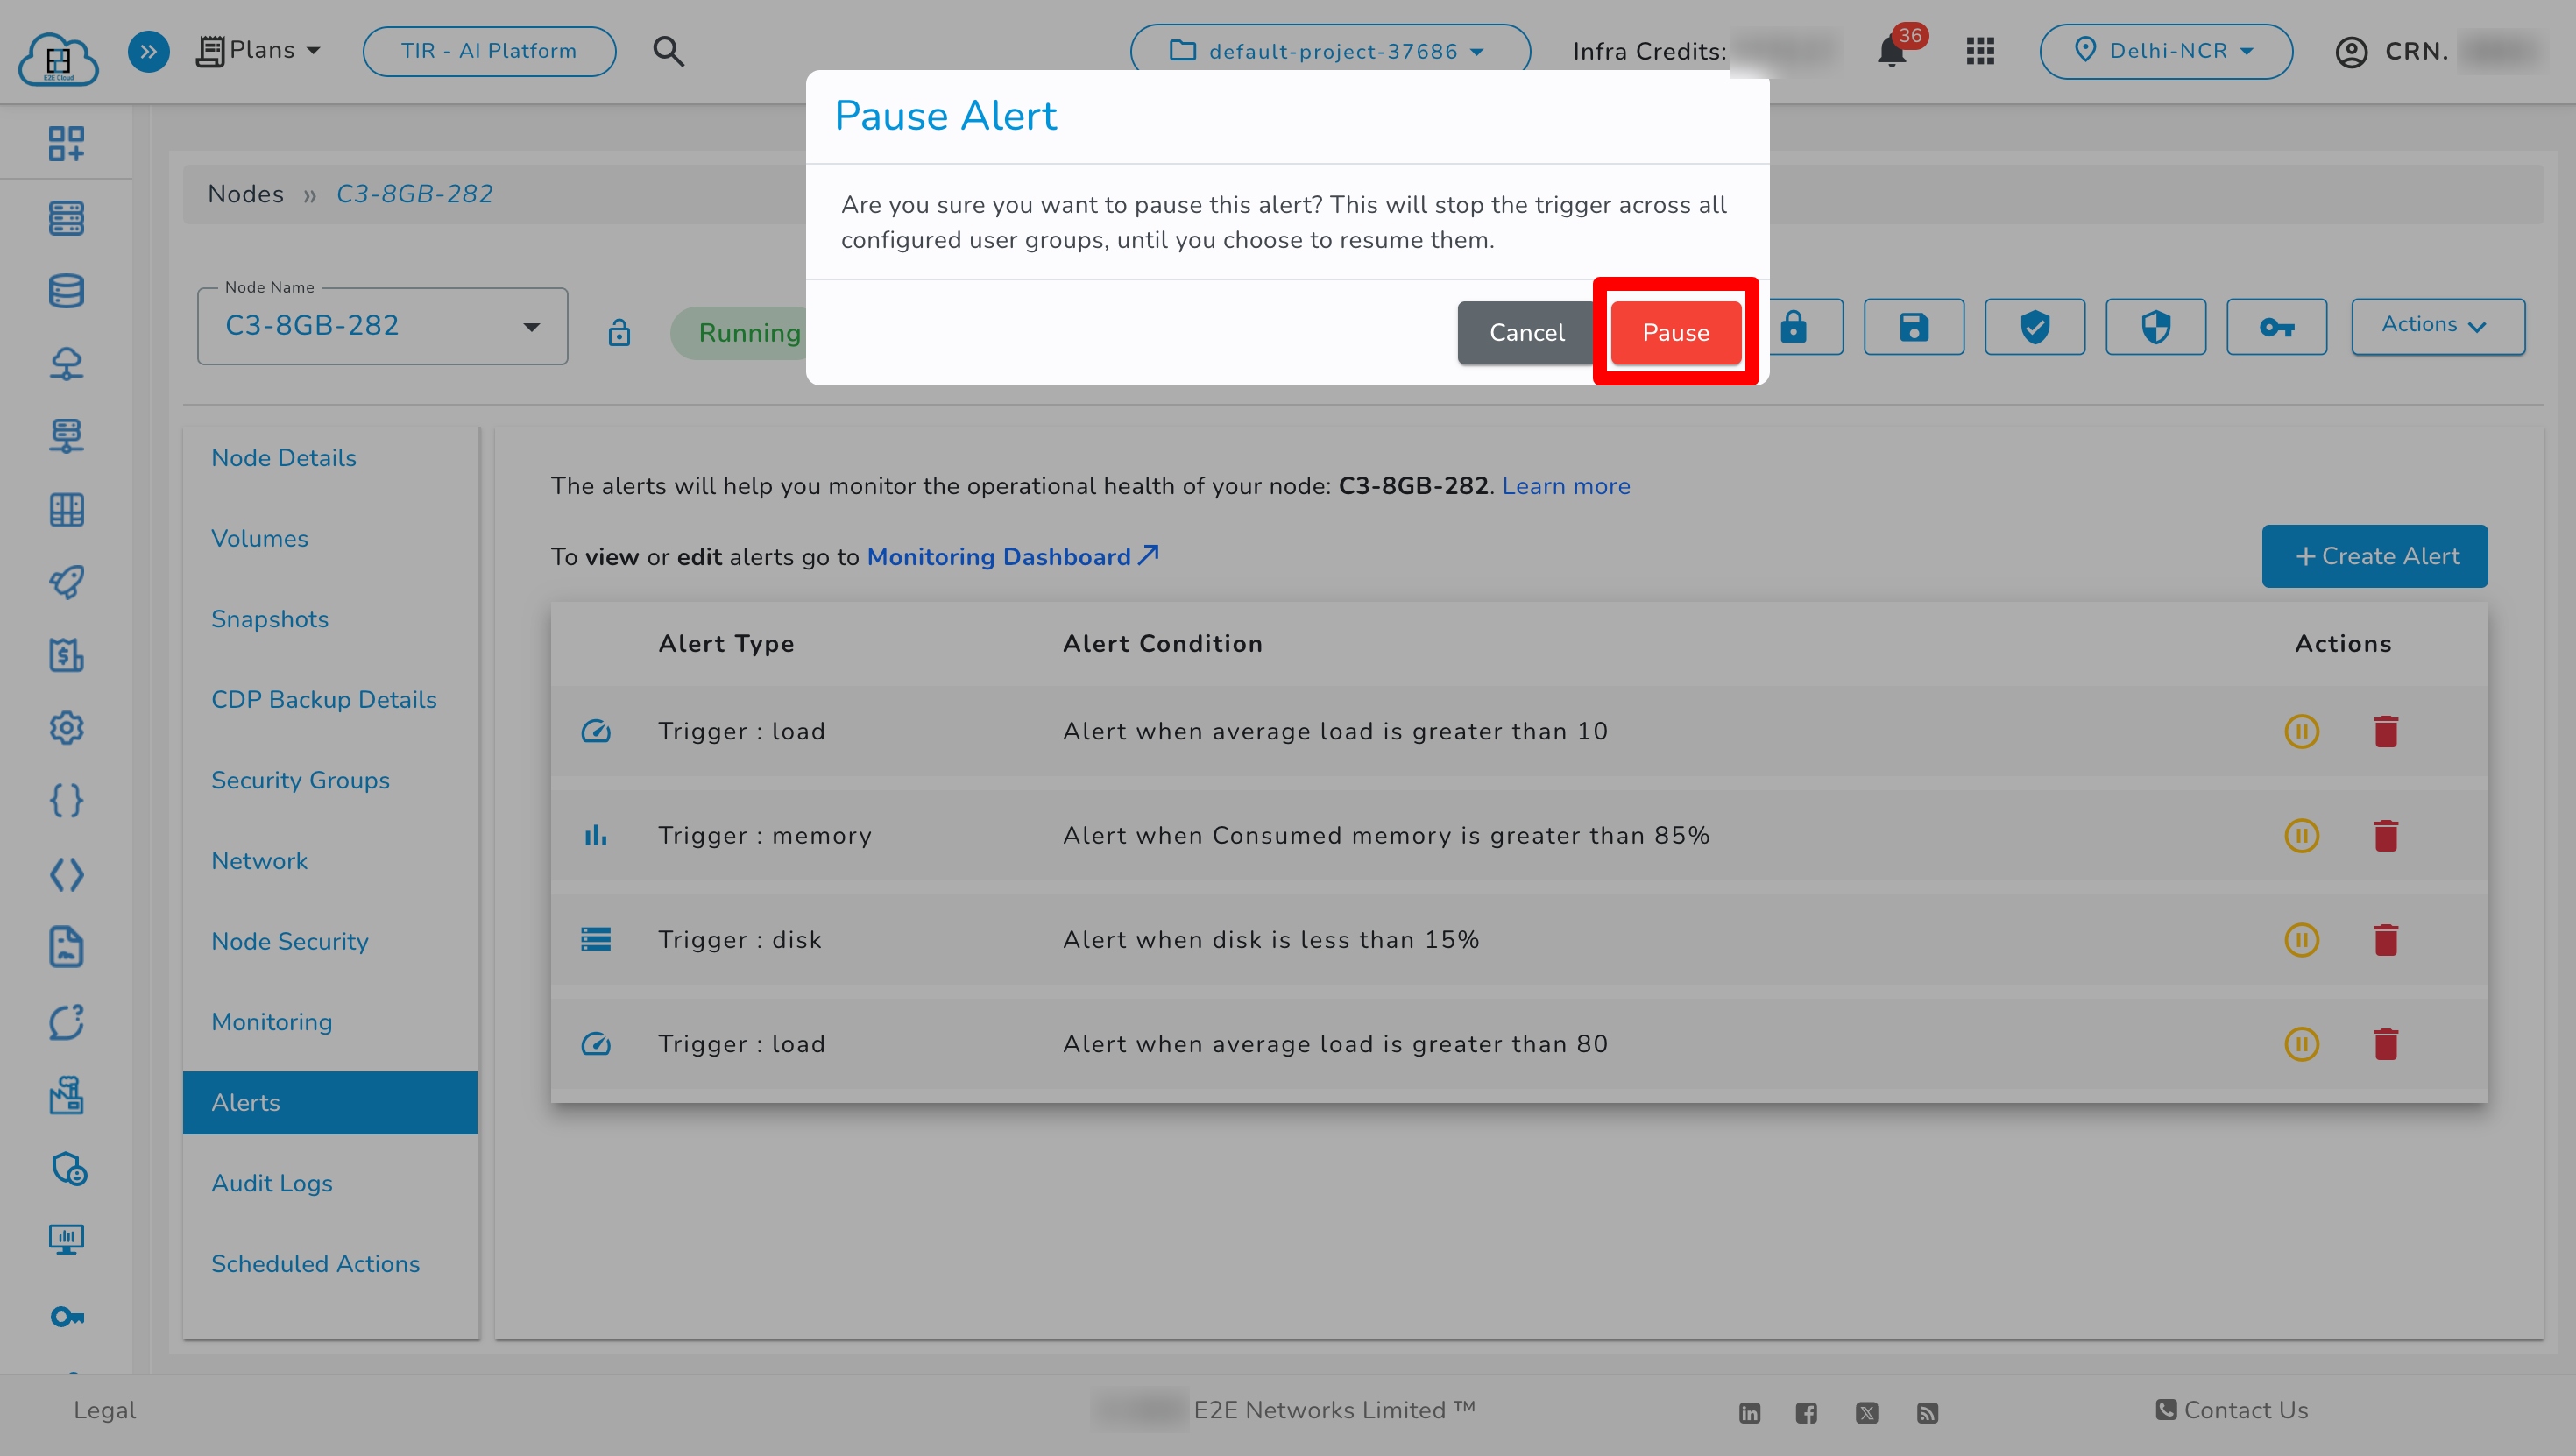
A confirmation popup will appear:
This will stop the trigger across all configured user groups until you choose to resume them.
-
Click Cancel to abort or Pause to confirm the action.
-
The alert status will now reflect the paused state. No notifications will be sent while the alert is paused.
Resume Node Alert
-
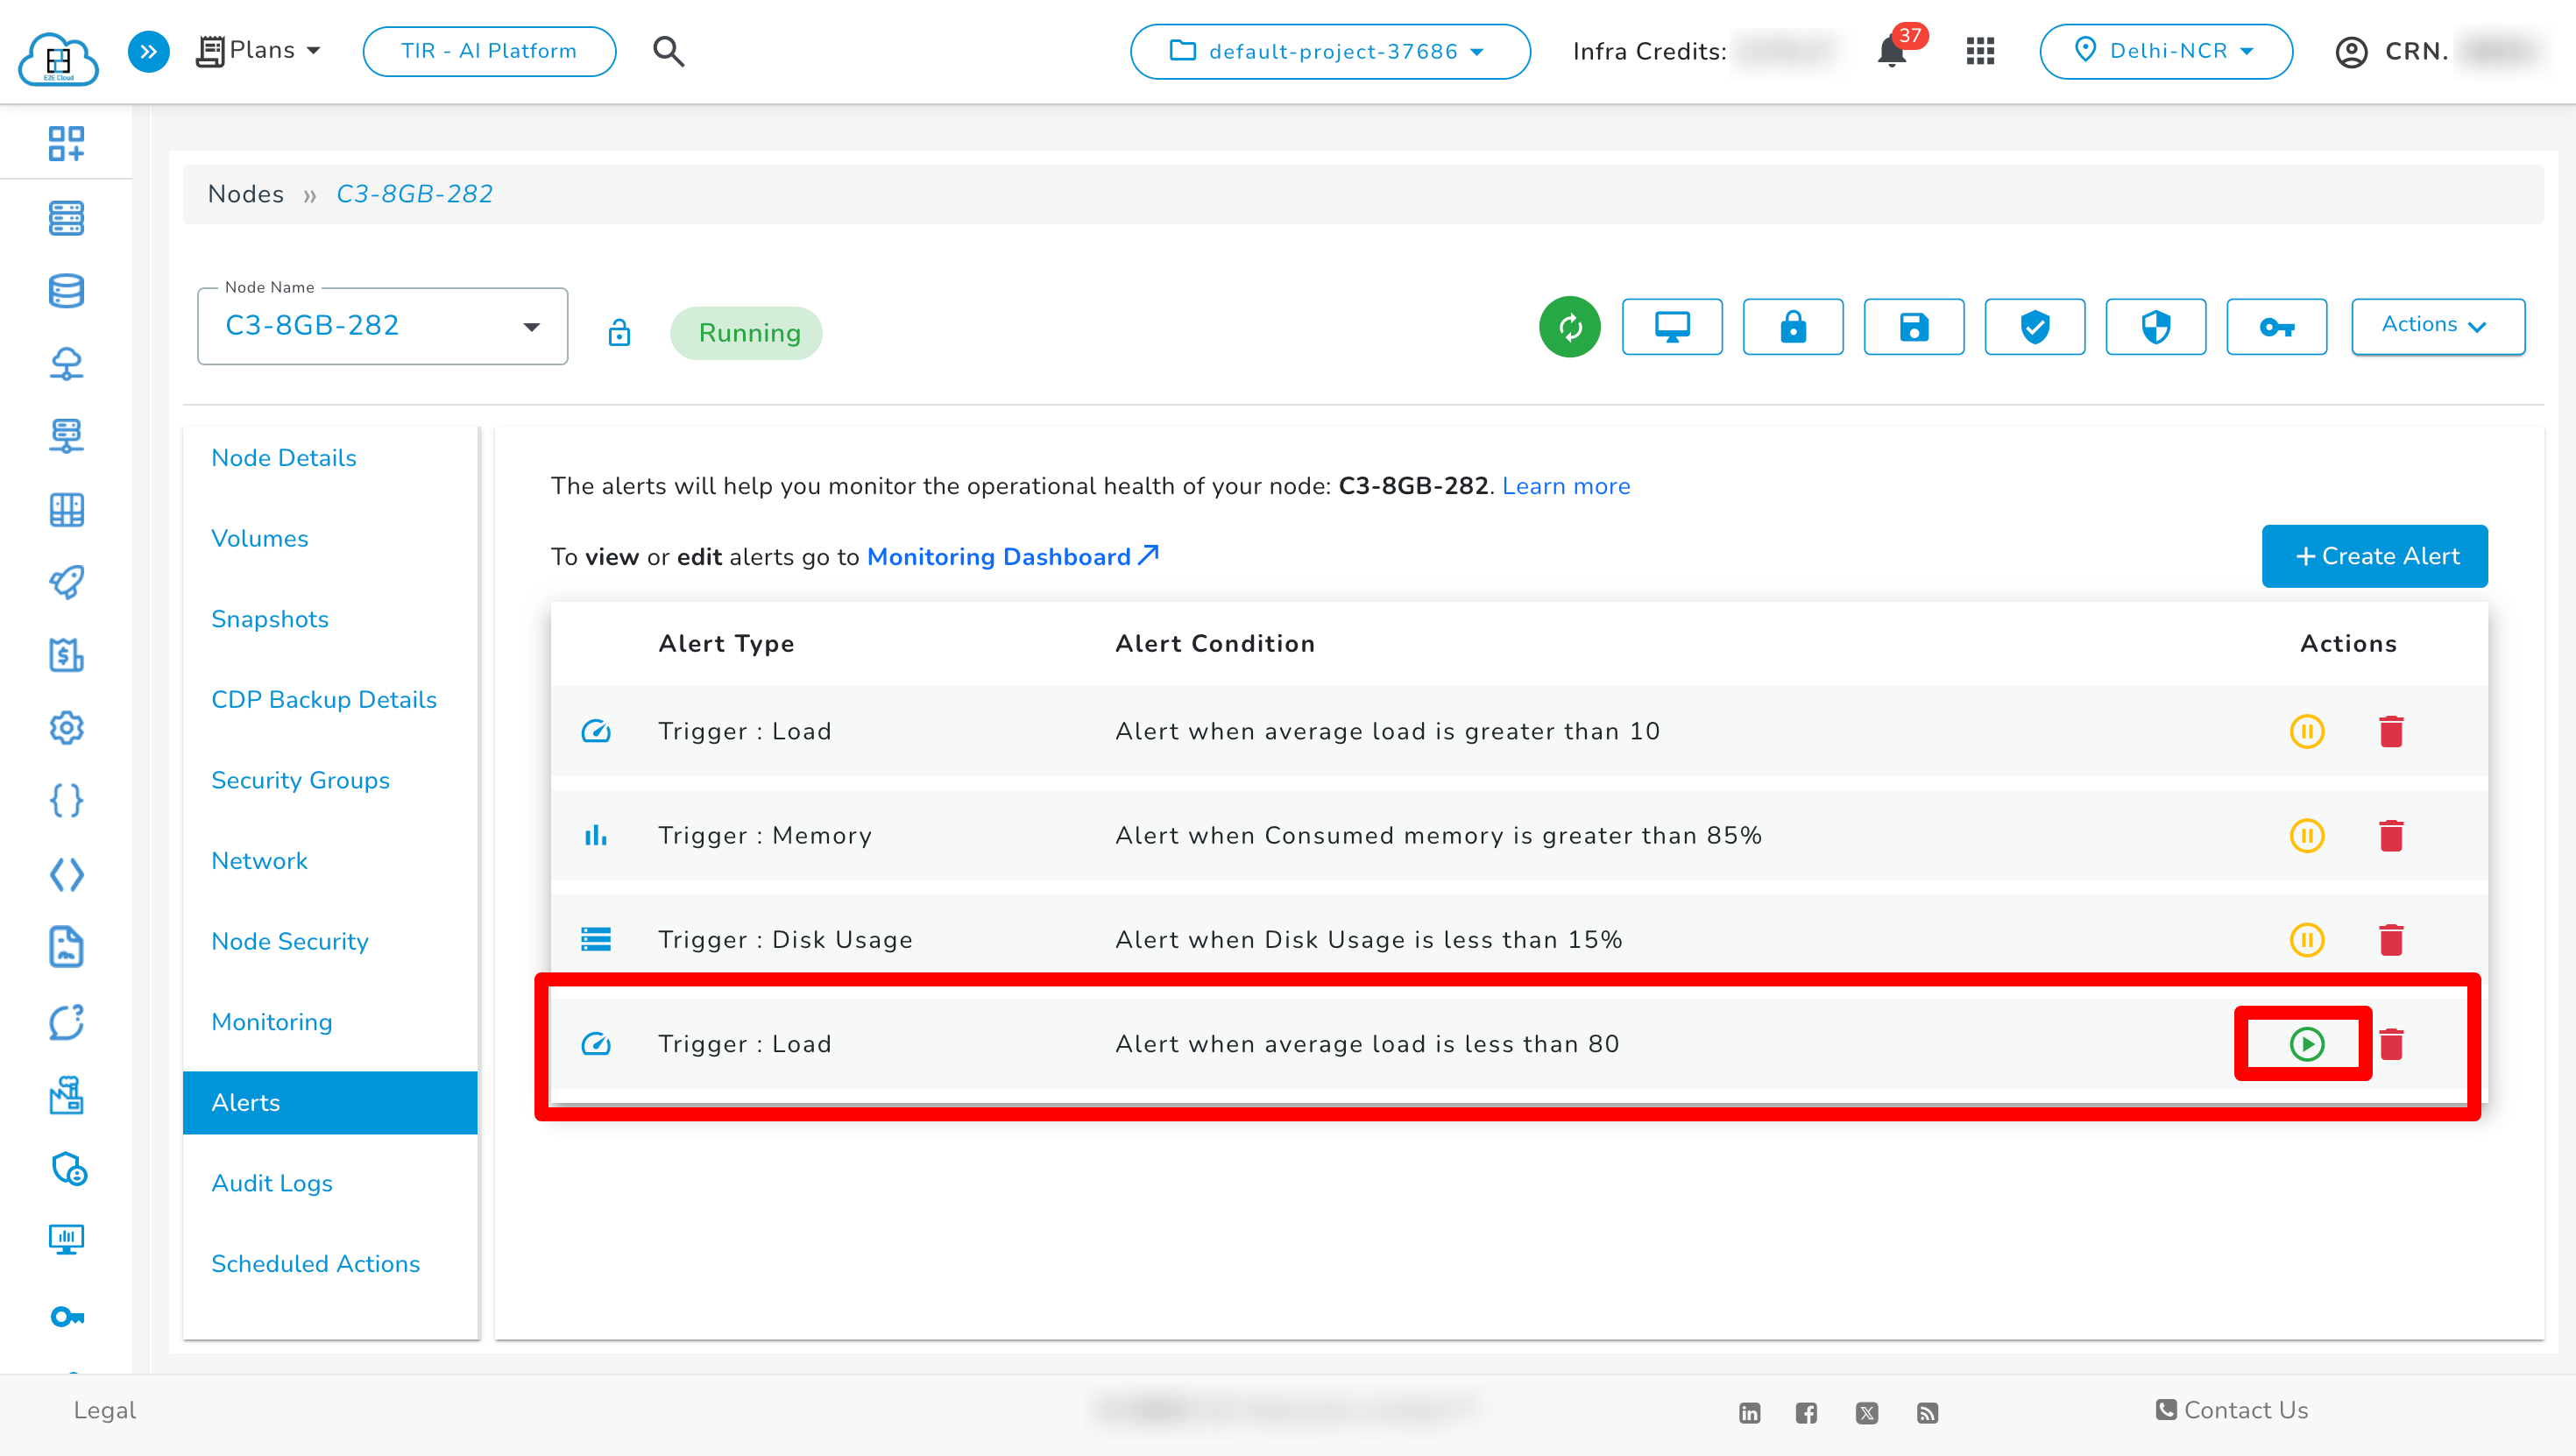
In the Node → Alerts tab, find the paused alert you want to re-enable.
-
Click the resume icon under the Actions column.
-
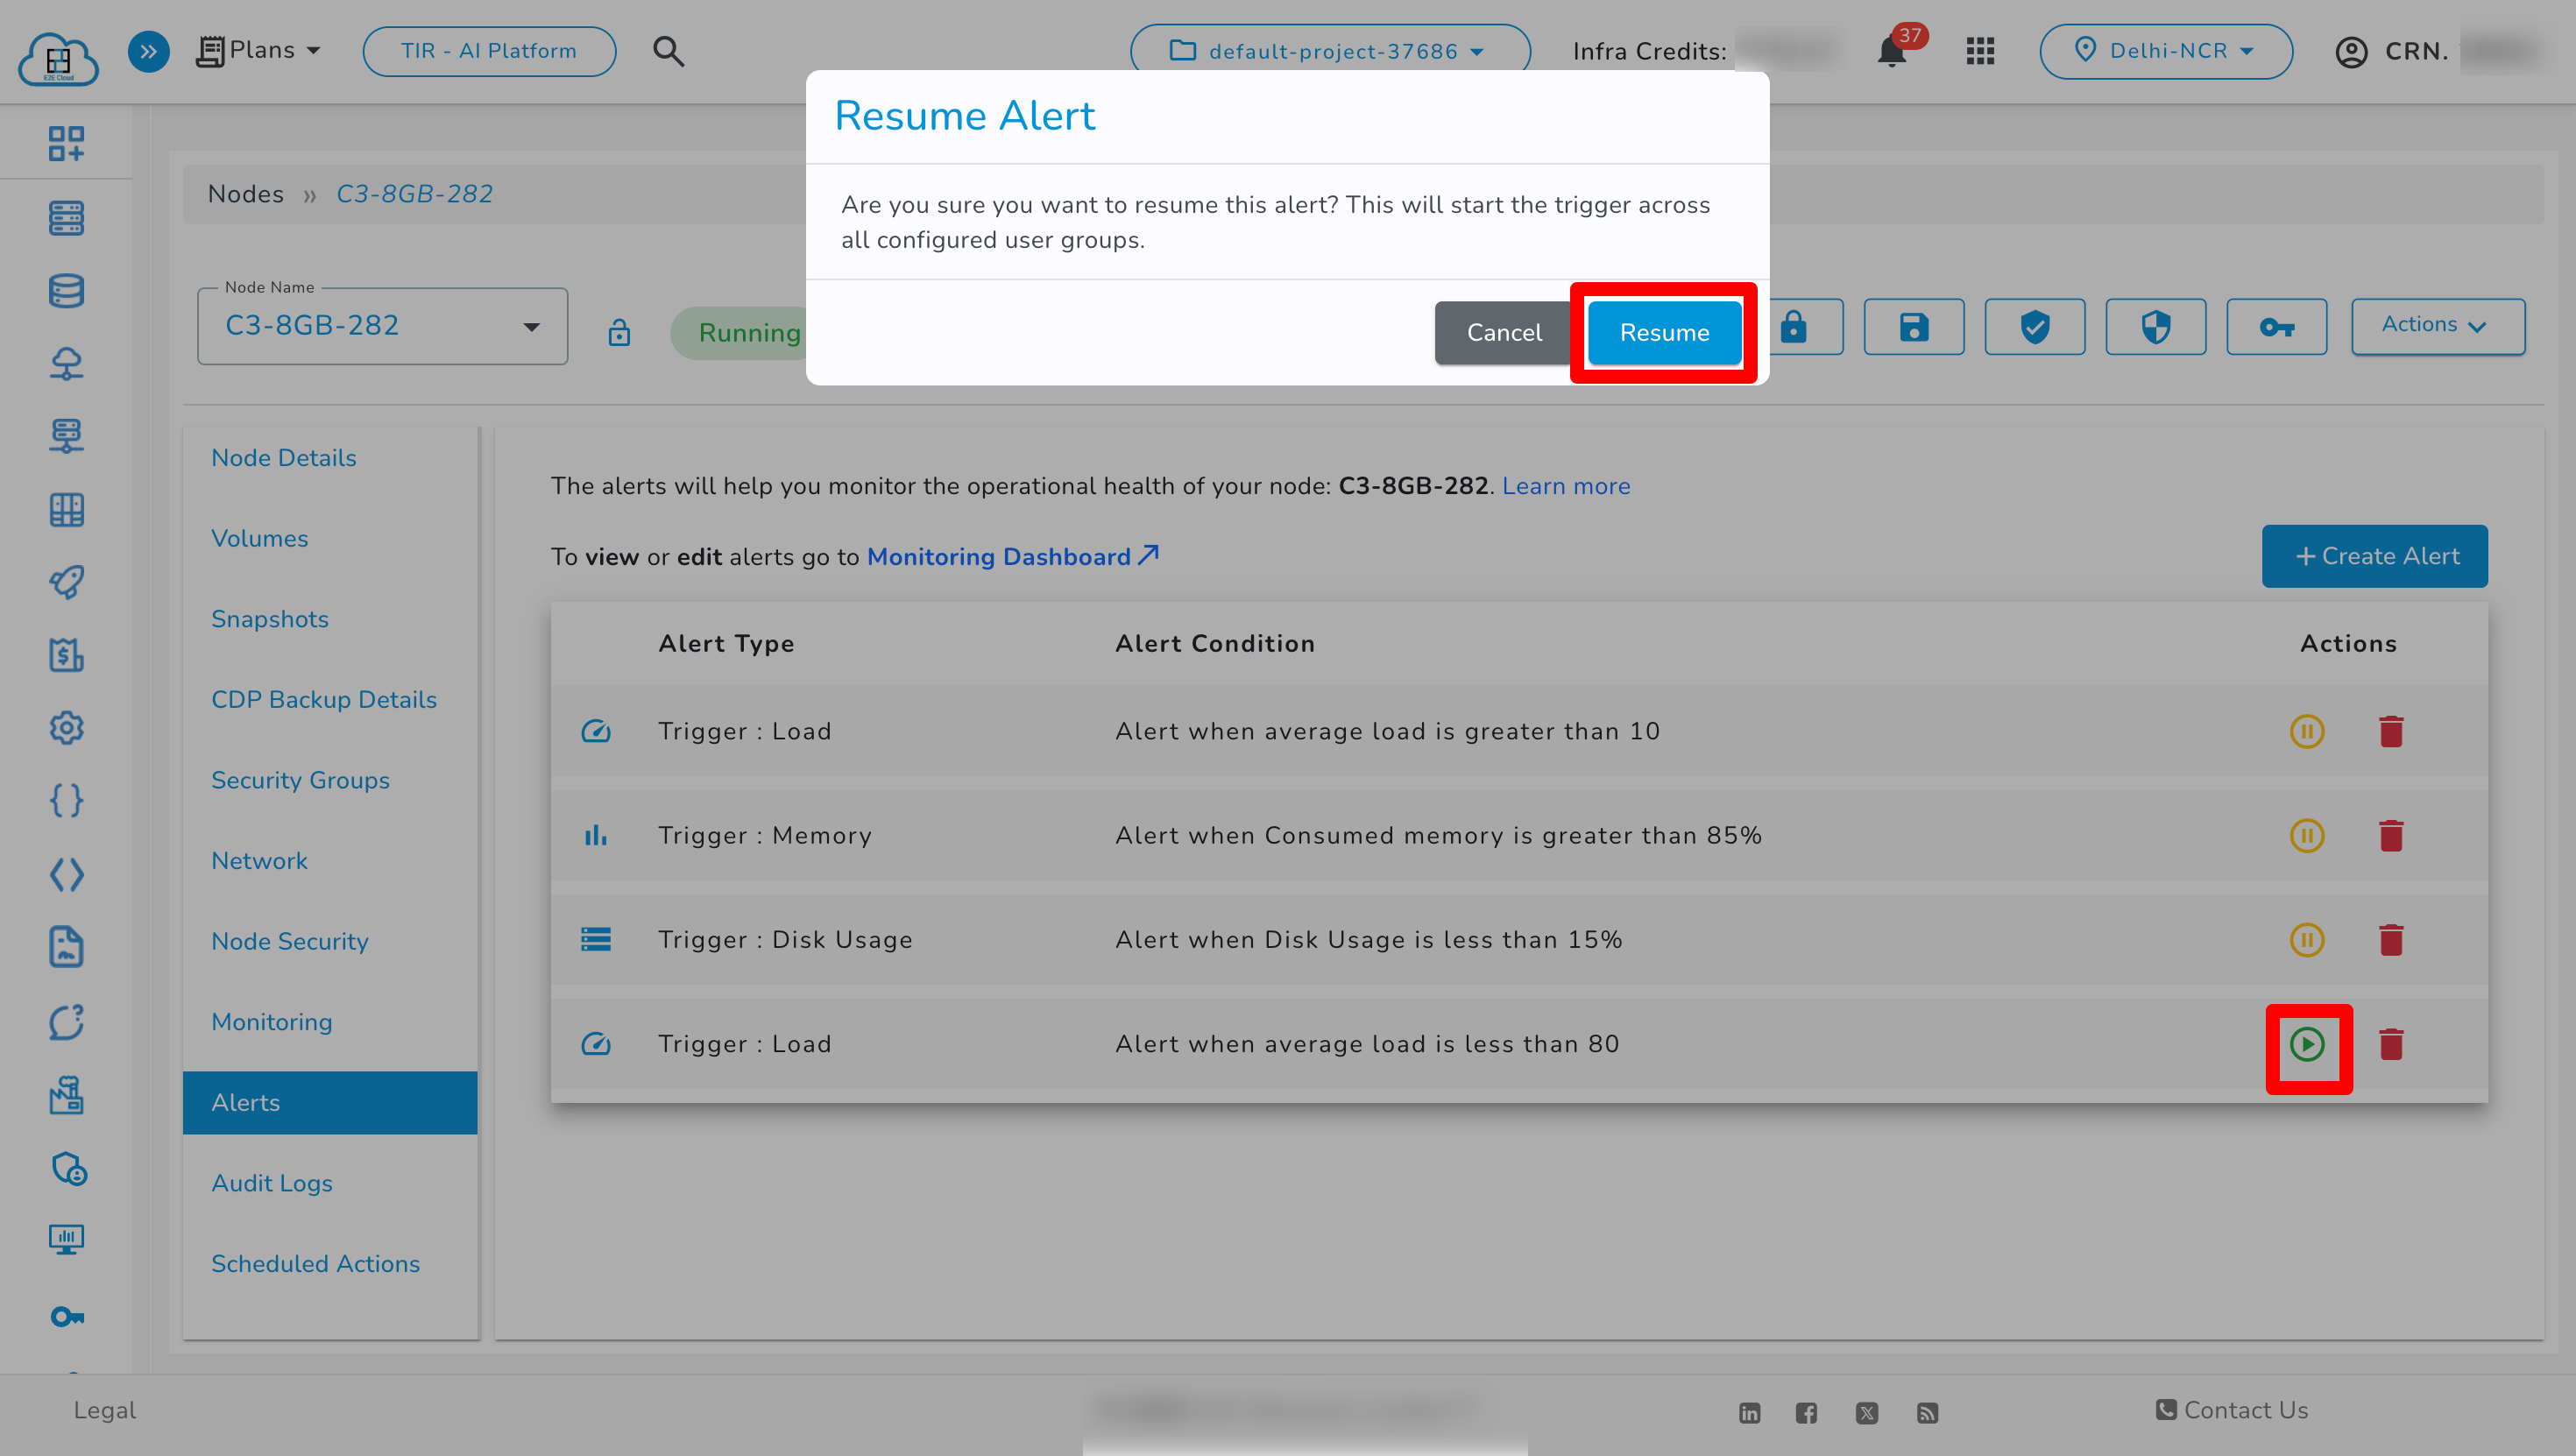
A confirmation popup will appear:
-
Click Cancel to dismiss or Resume to re-enable the alert.
-
The alert will now be active and start triggering based on the configured conditions.
✅ Note: Pause/Resume operations do not delete the alert. They only temporarily stop or restart the monitoring triggers across the user groups linked to the alert.
Setup Monitoring Alert for Load Balancer
-
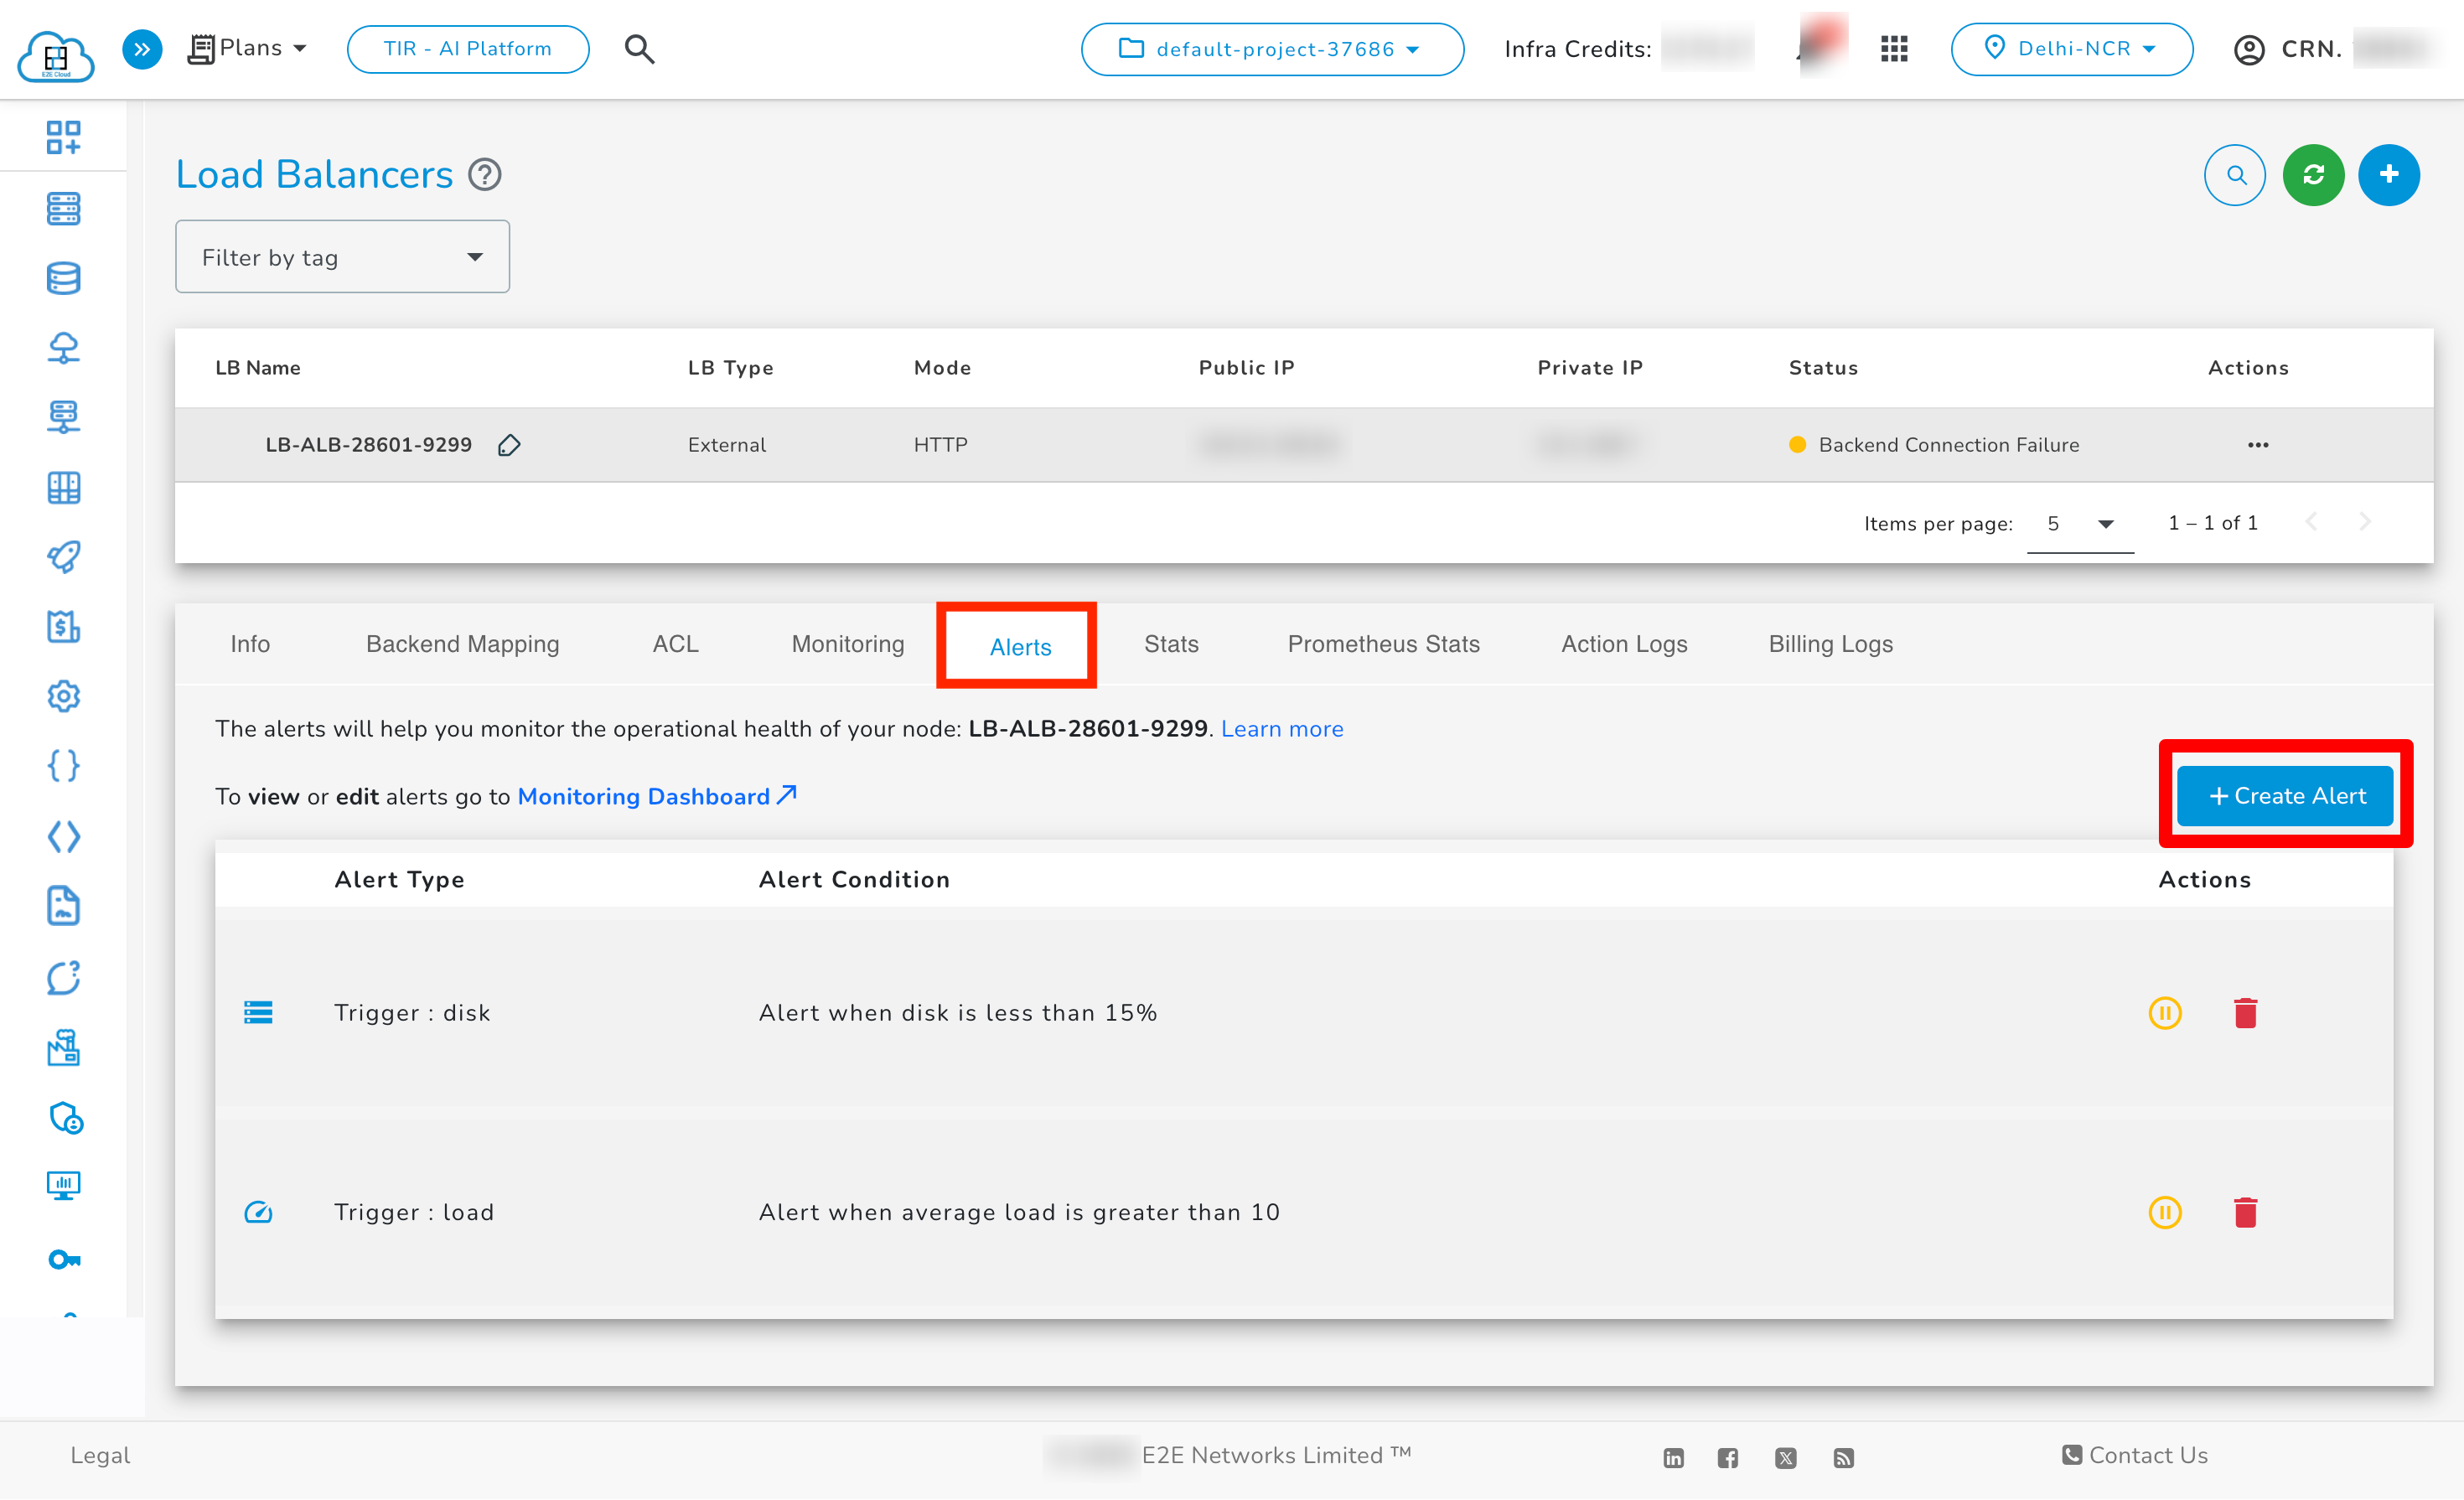
Go to the “Manage Load Balancer” page, select the desired load balancer, and click the ‘Alert’ tab.
-
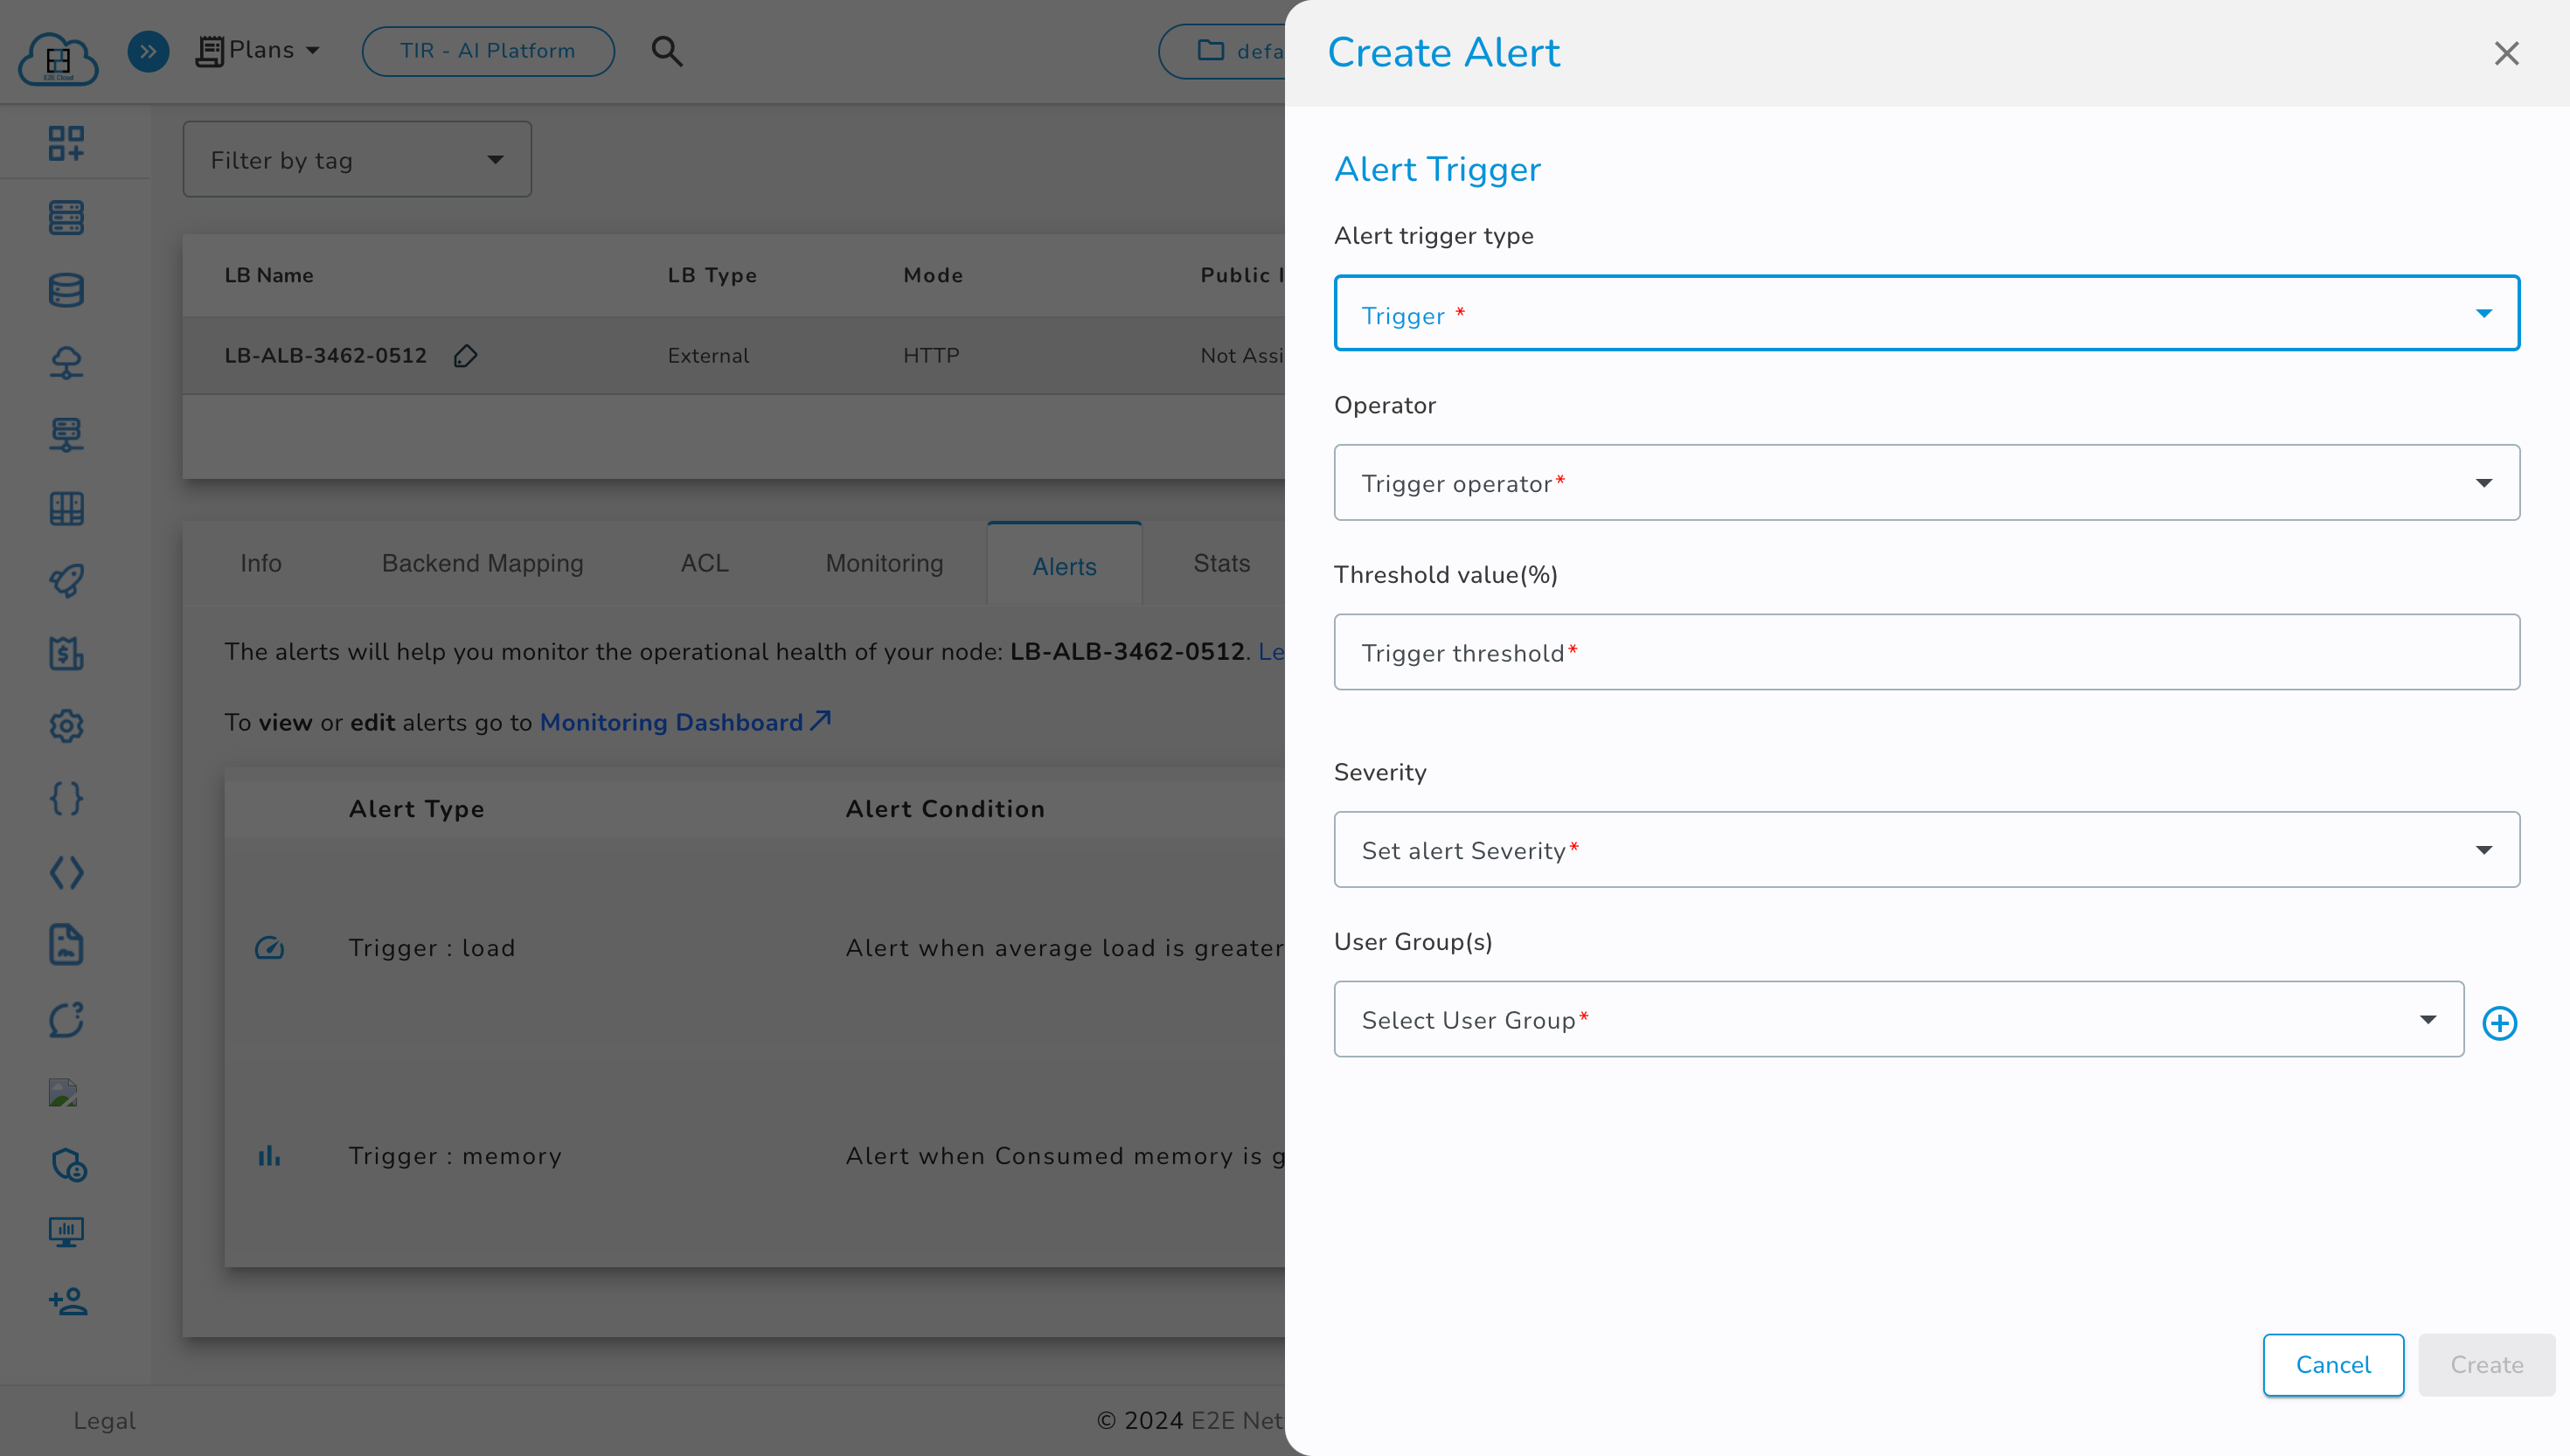
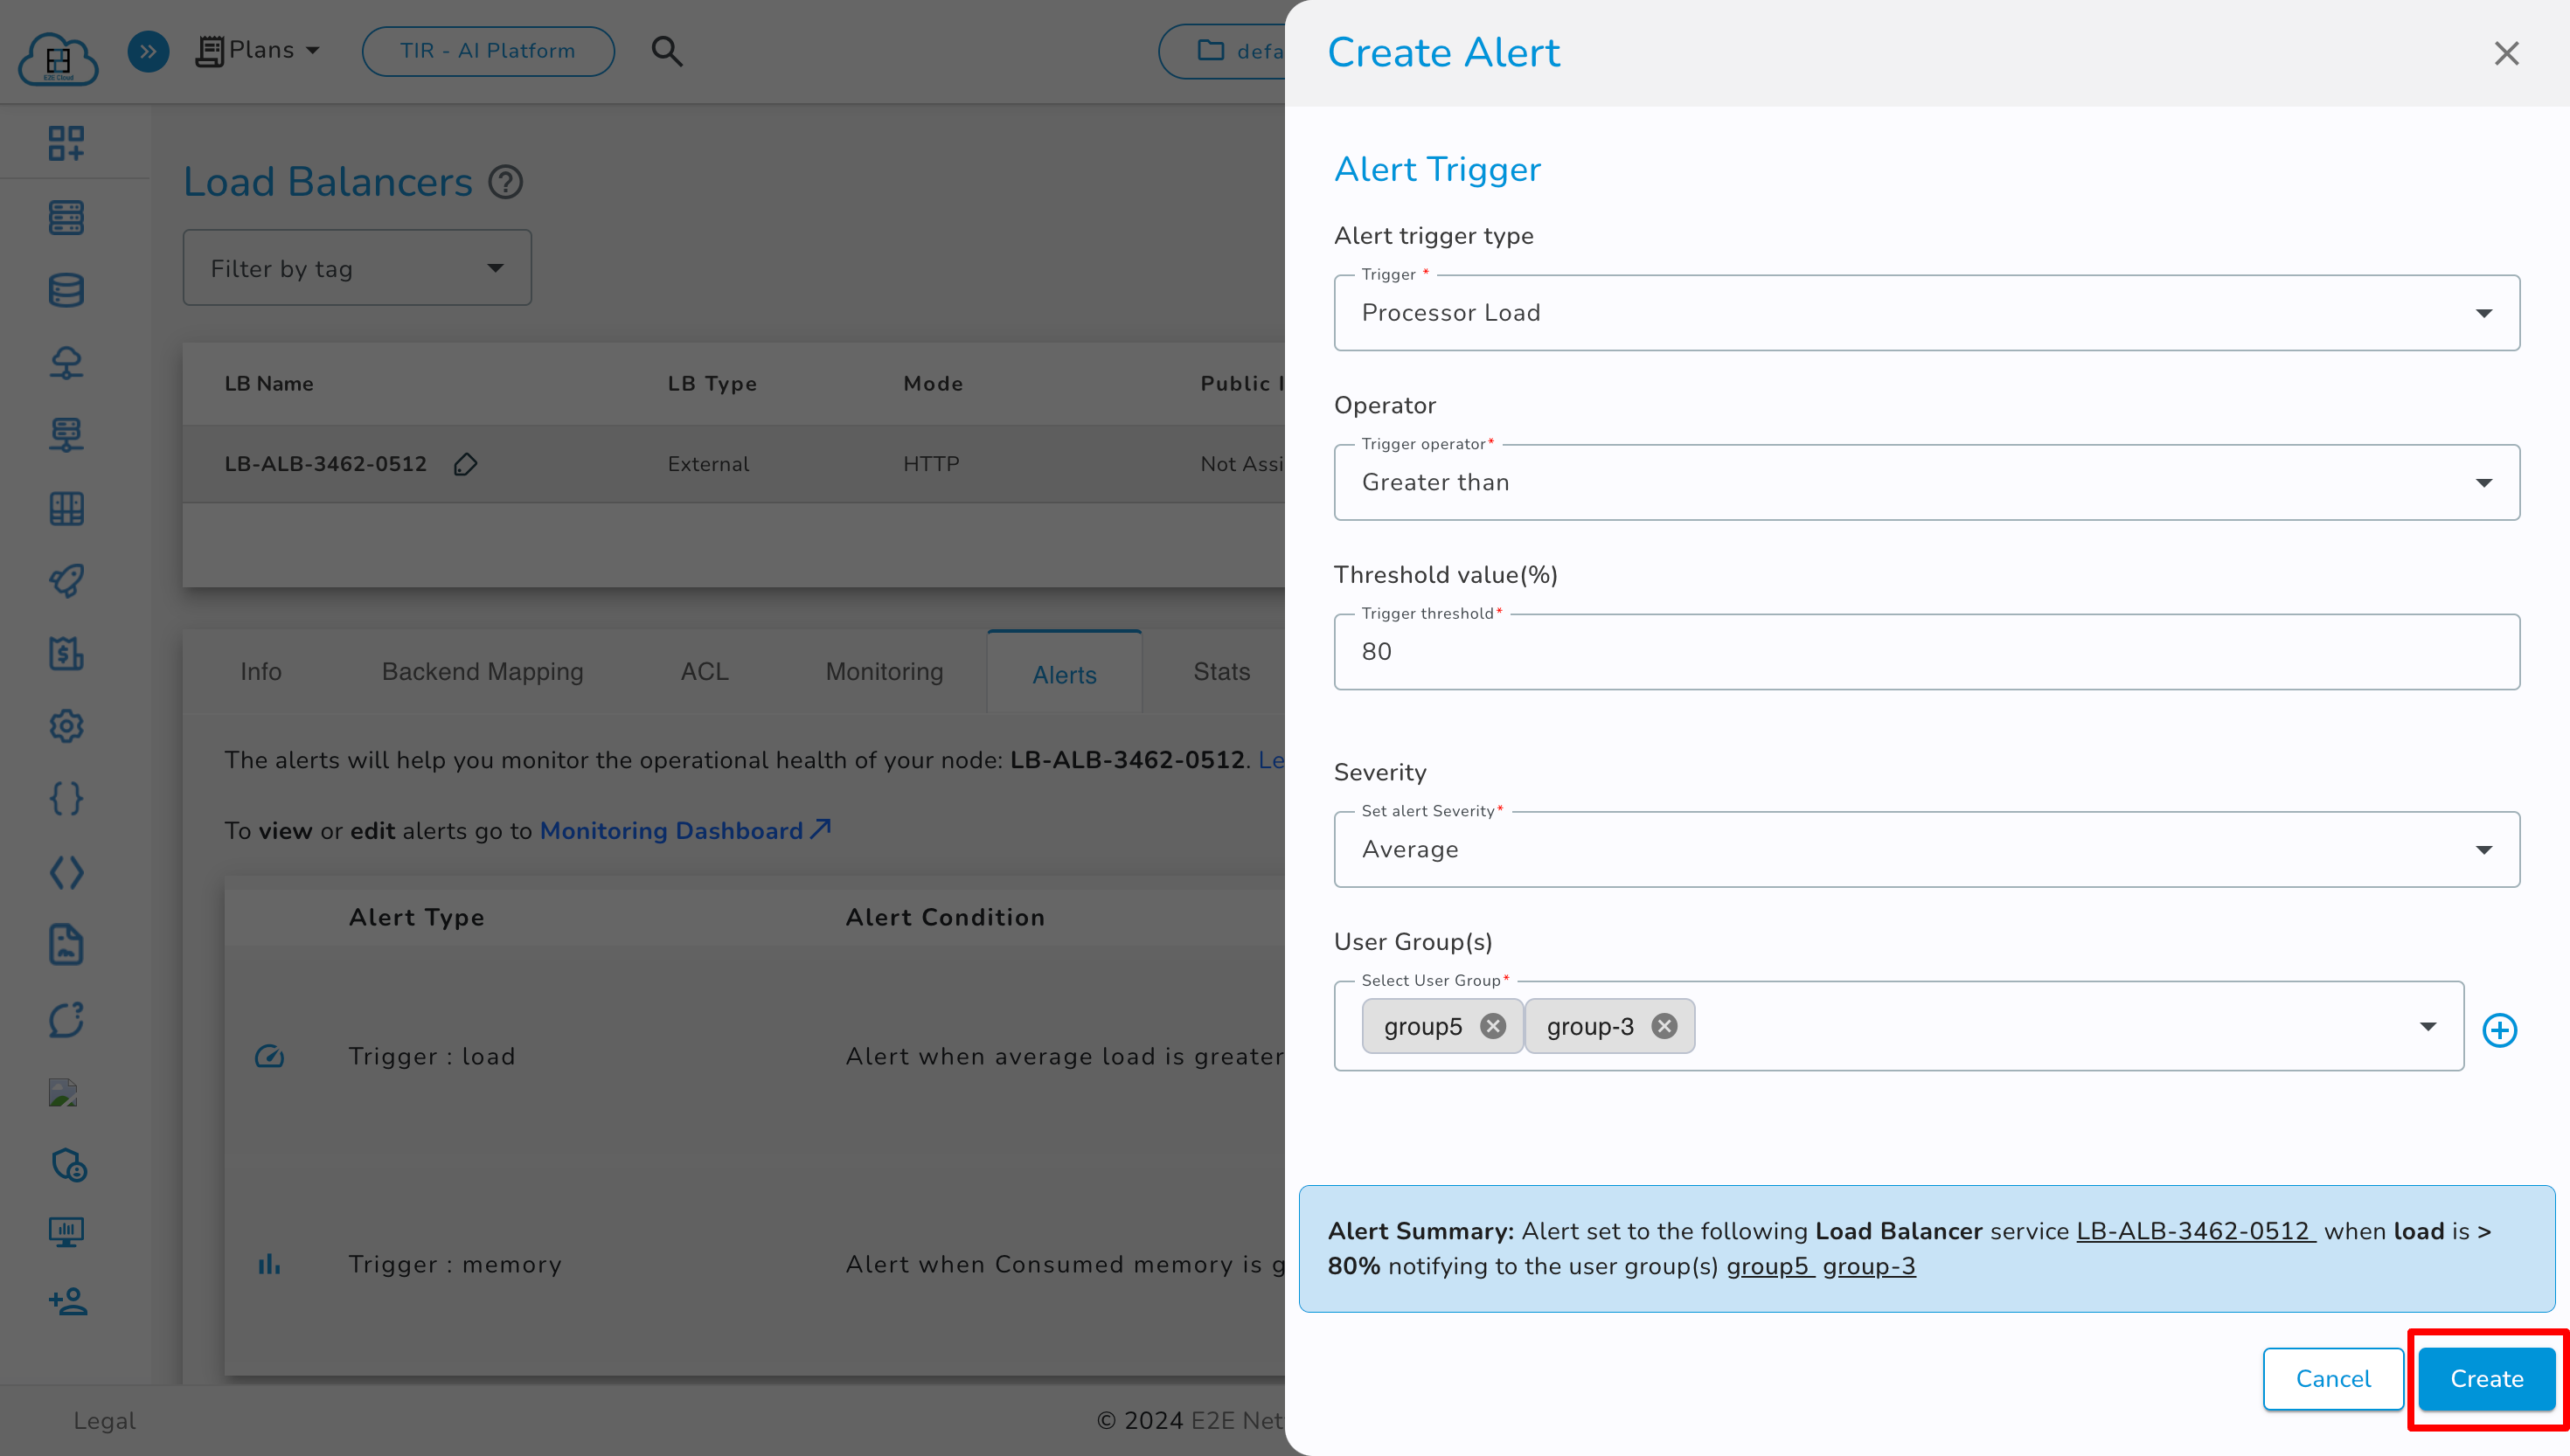
Click the ‘Create Alert’ button to open the Create Alert window.
-
Select Trigger Type.
-
Select Trigger Operator.
-
Define the Threshold Value (%).
-
Select Severity.
-
Select the User Group you want to send the alert to. Learn more about User Groups here.
-
To create a new user group, click the ‘+’ button. The process is the same as described in Node Monitoring. Learn more here.
-
Click the ‘Create’ button to save the alert.
-
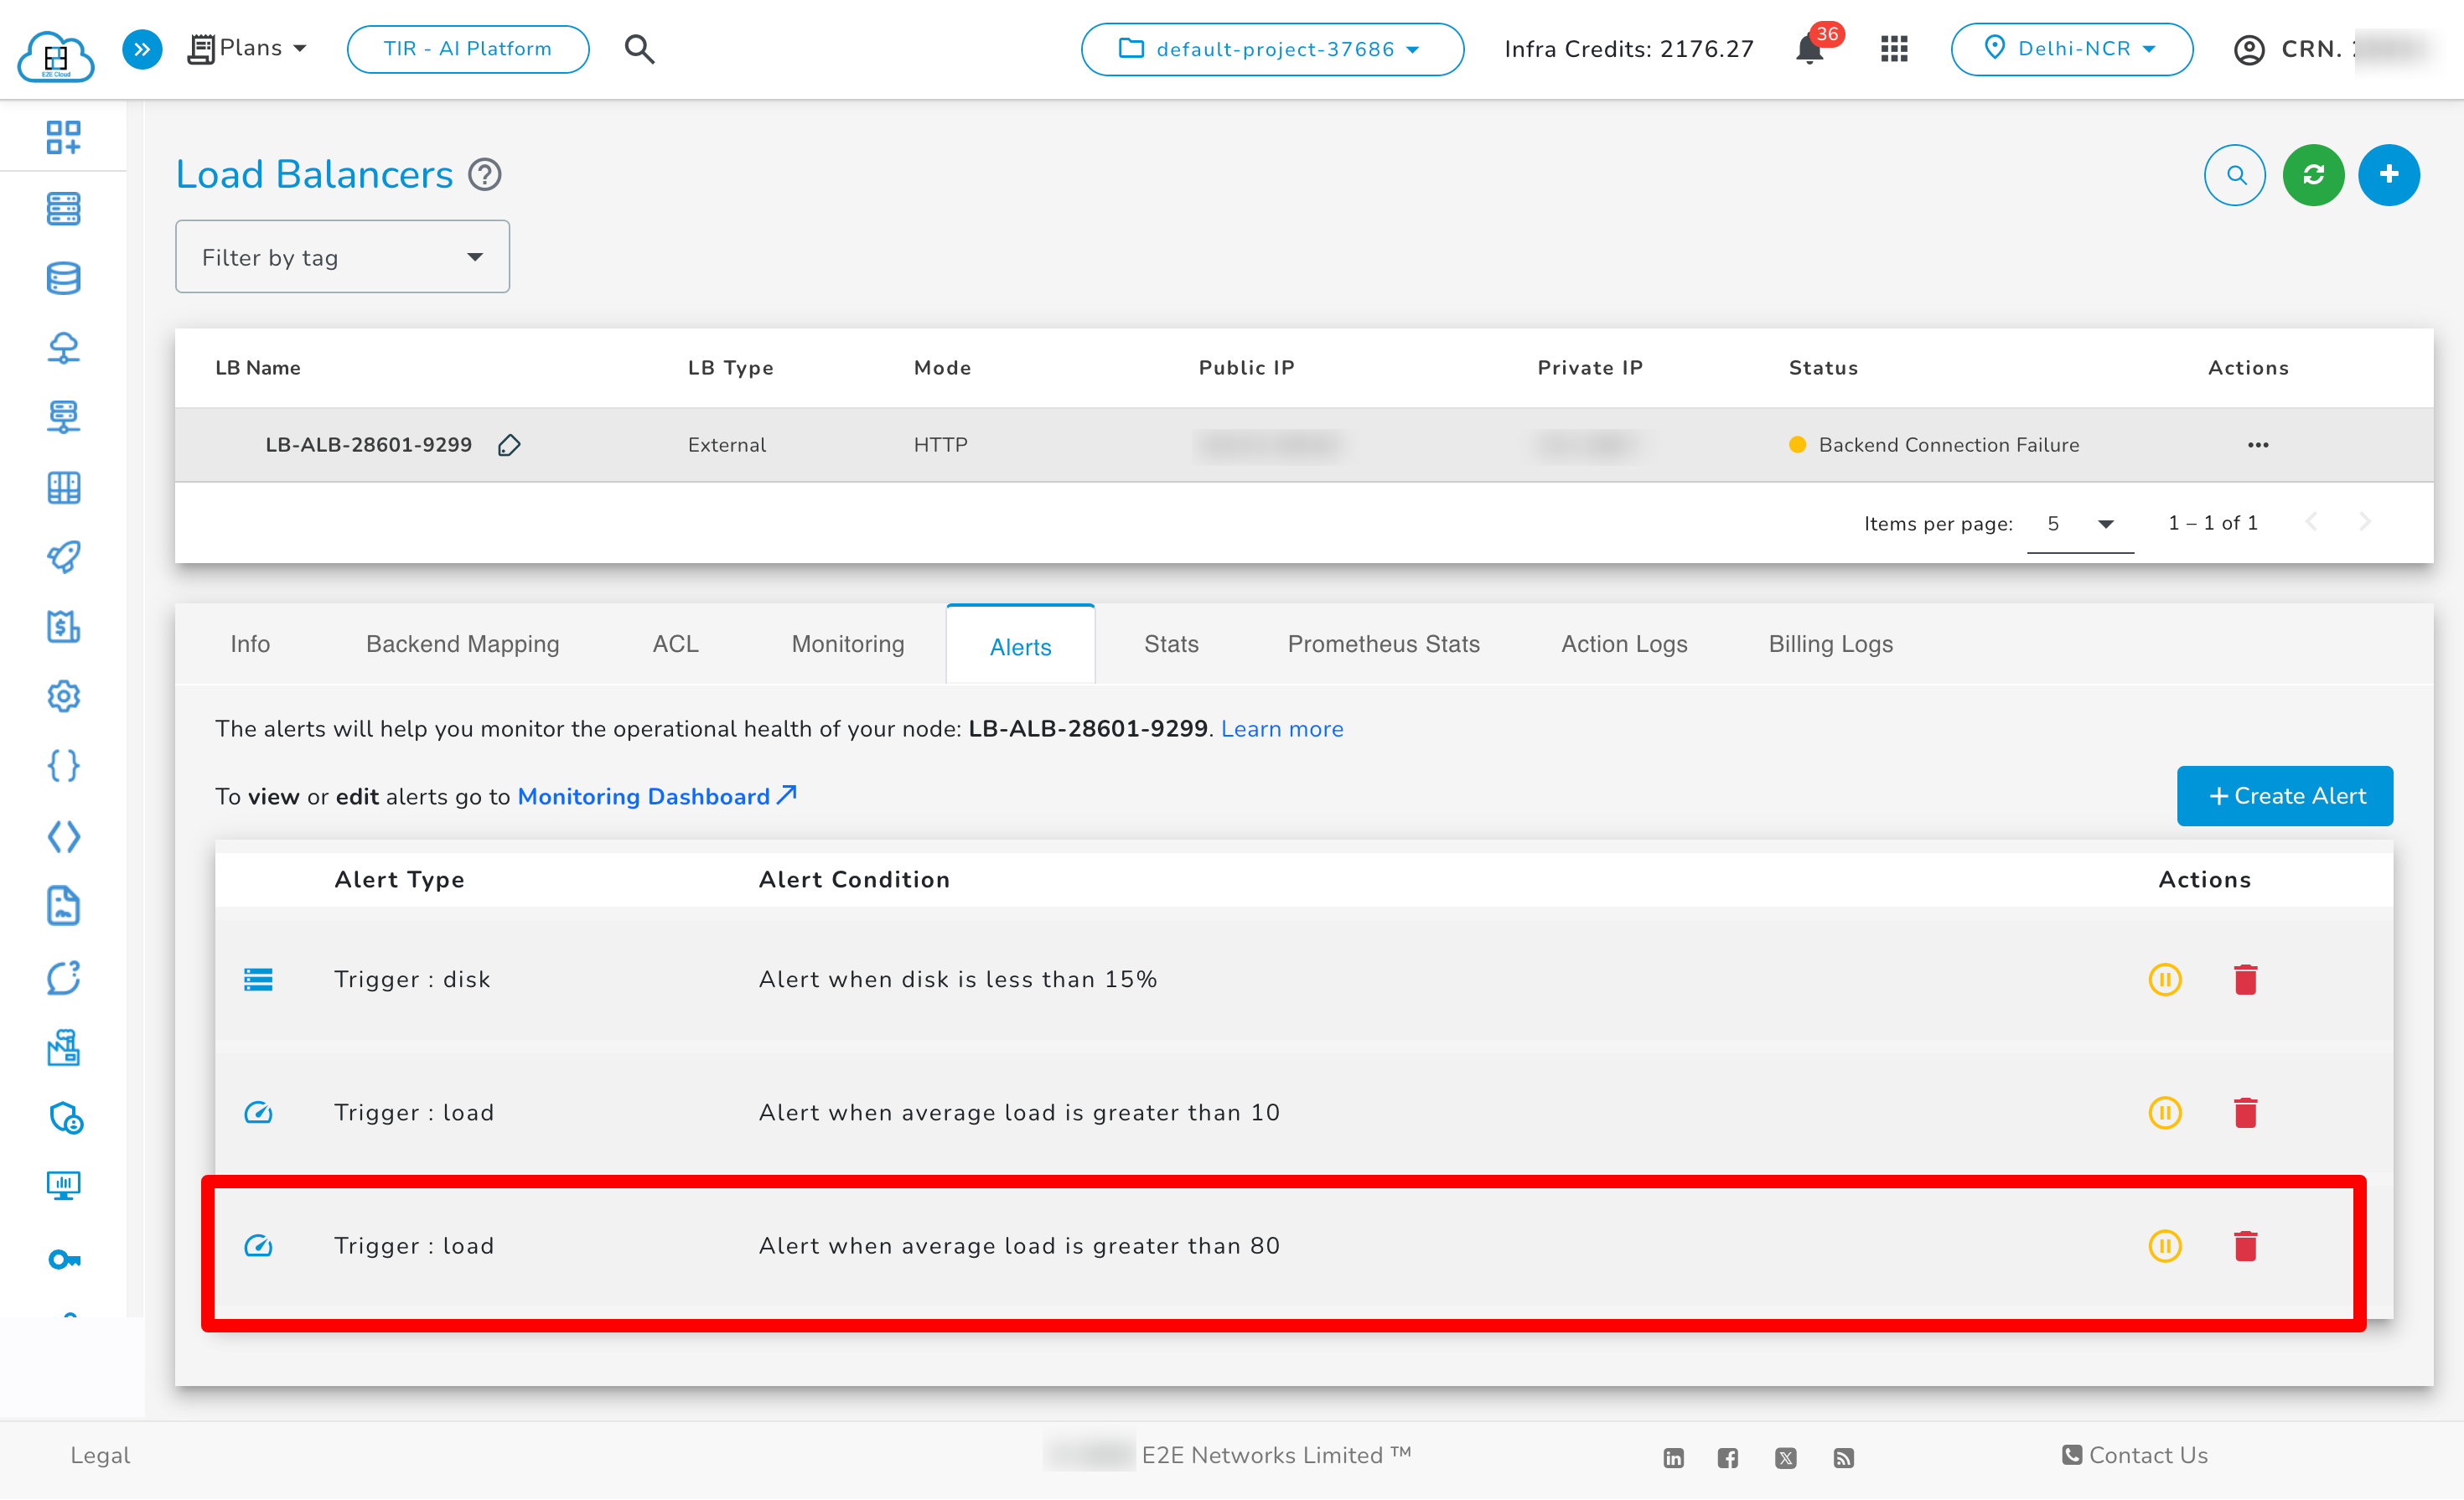
View created alerts in the Alerts section.
Pause and Resume Load Balancer Alerts
You can pause or resume specific load balancer alerts directly from the Alerts tab in the MyAccount portal. This is helpful during maintenance or troubleshooting periods when alert notifications need to be temporarily disabled without deleting the configuration.
Pause Load Balancer Alert
-
Go to the Manage Load Balancer page and click the Alerts tab.
-
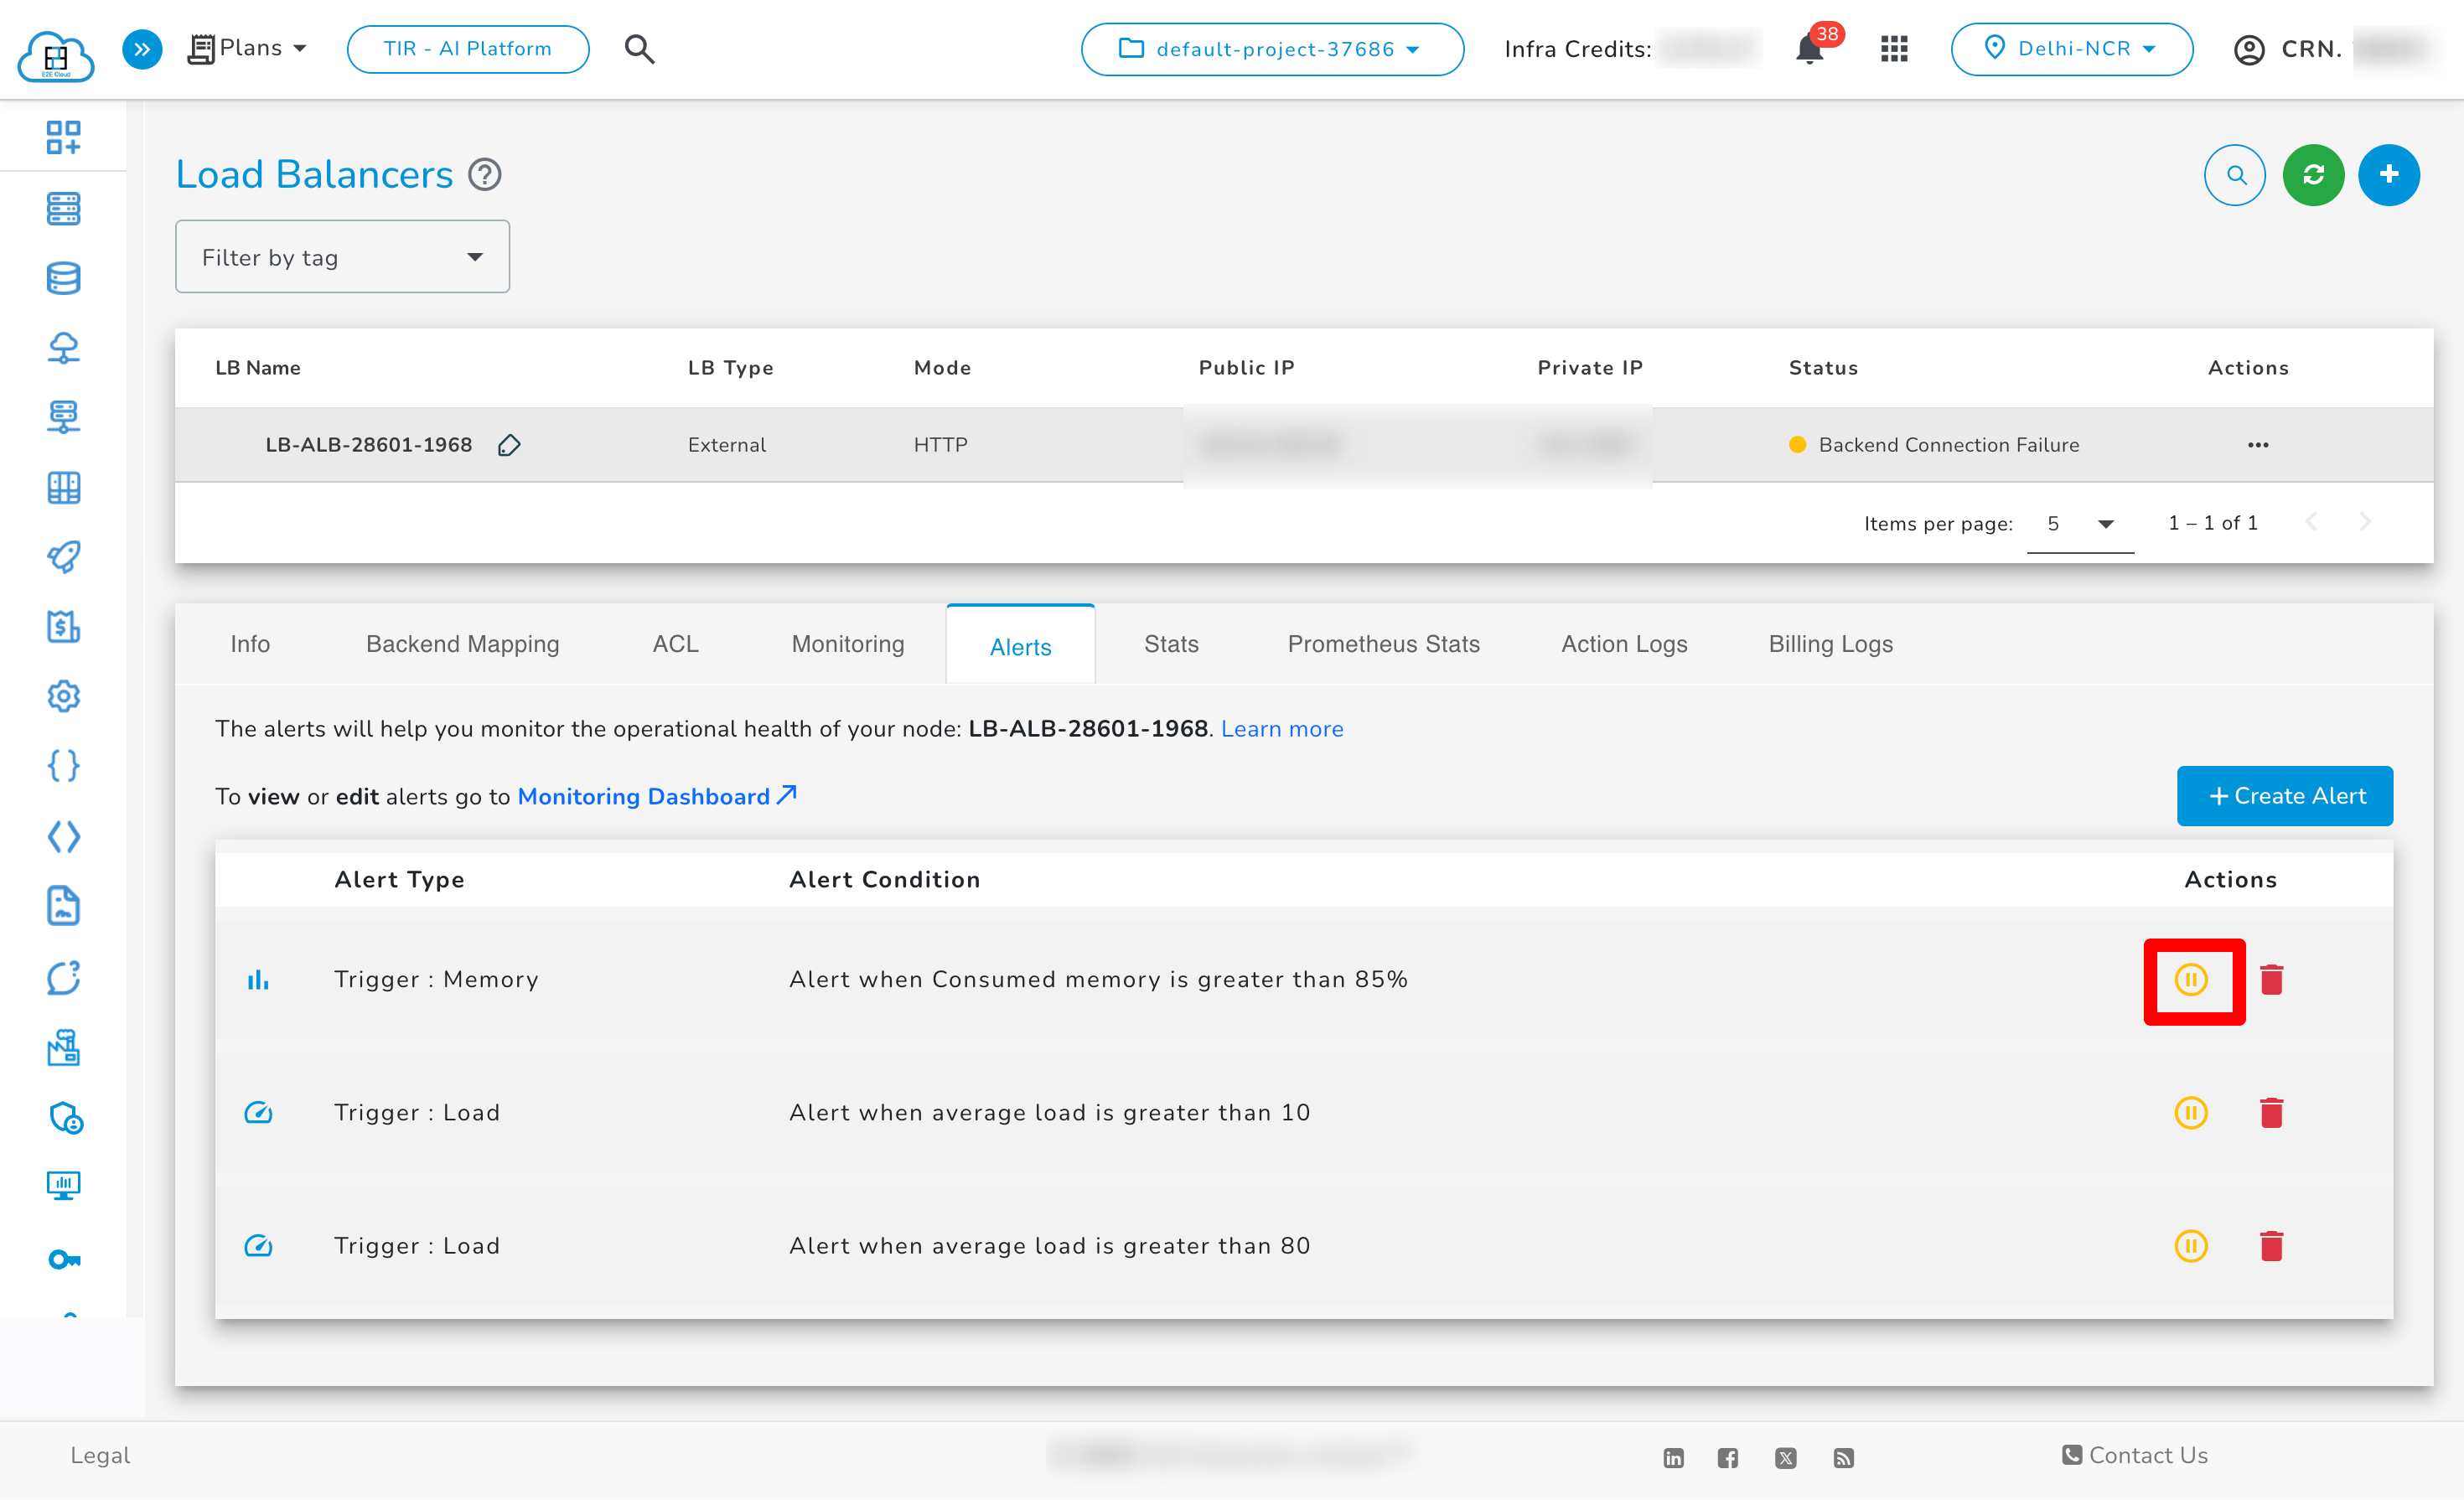
In the Actions column, click the pause icon next to the alert you want to pause.
-
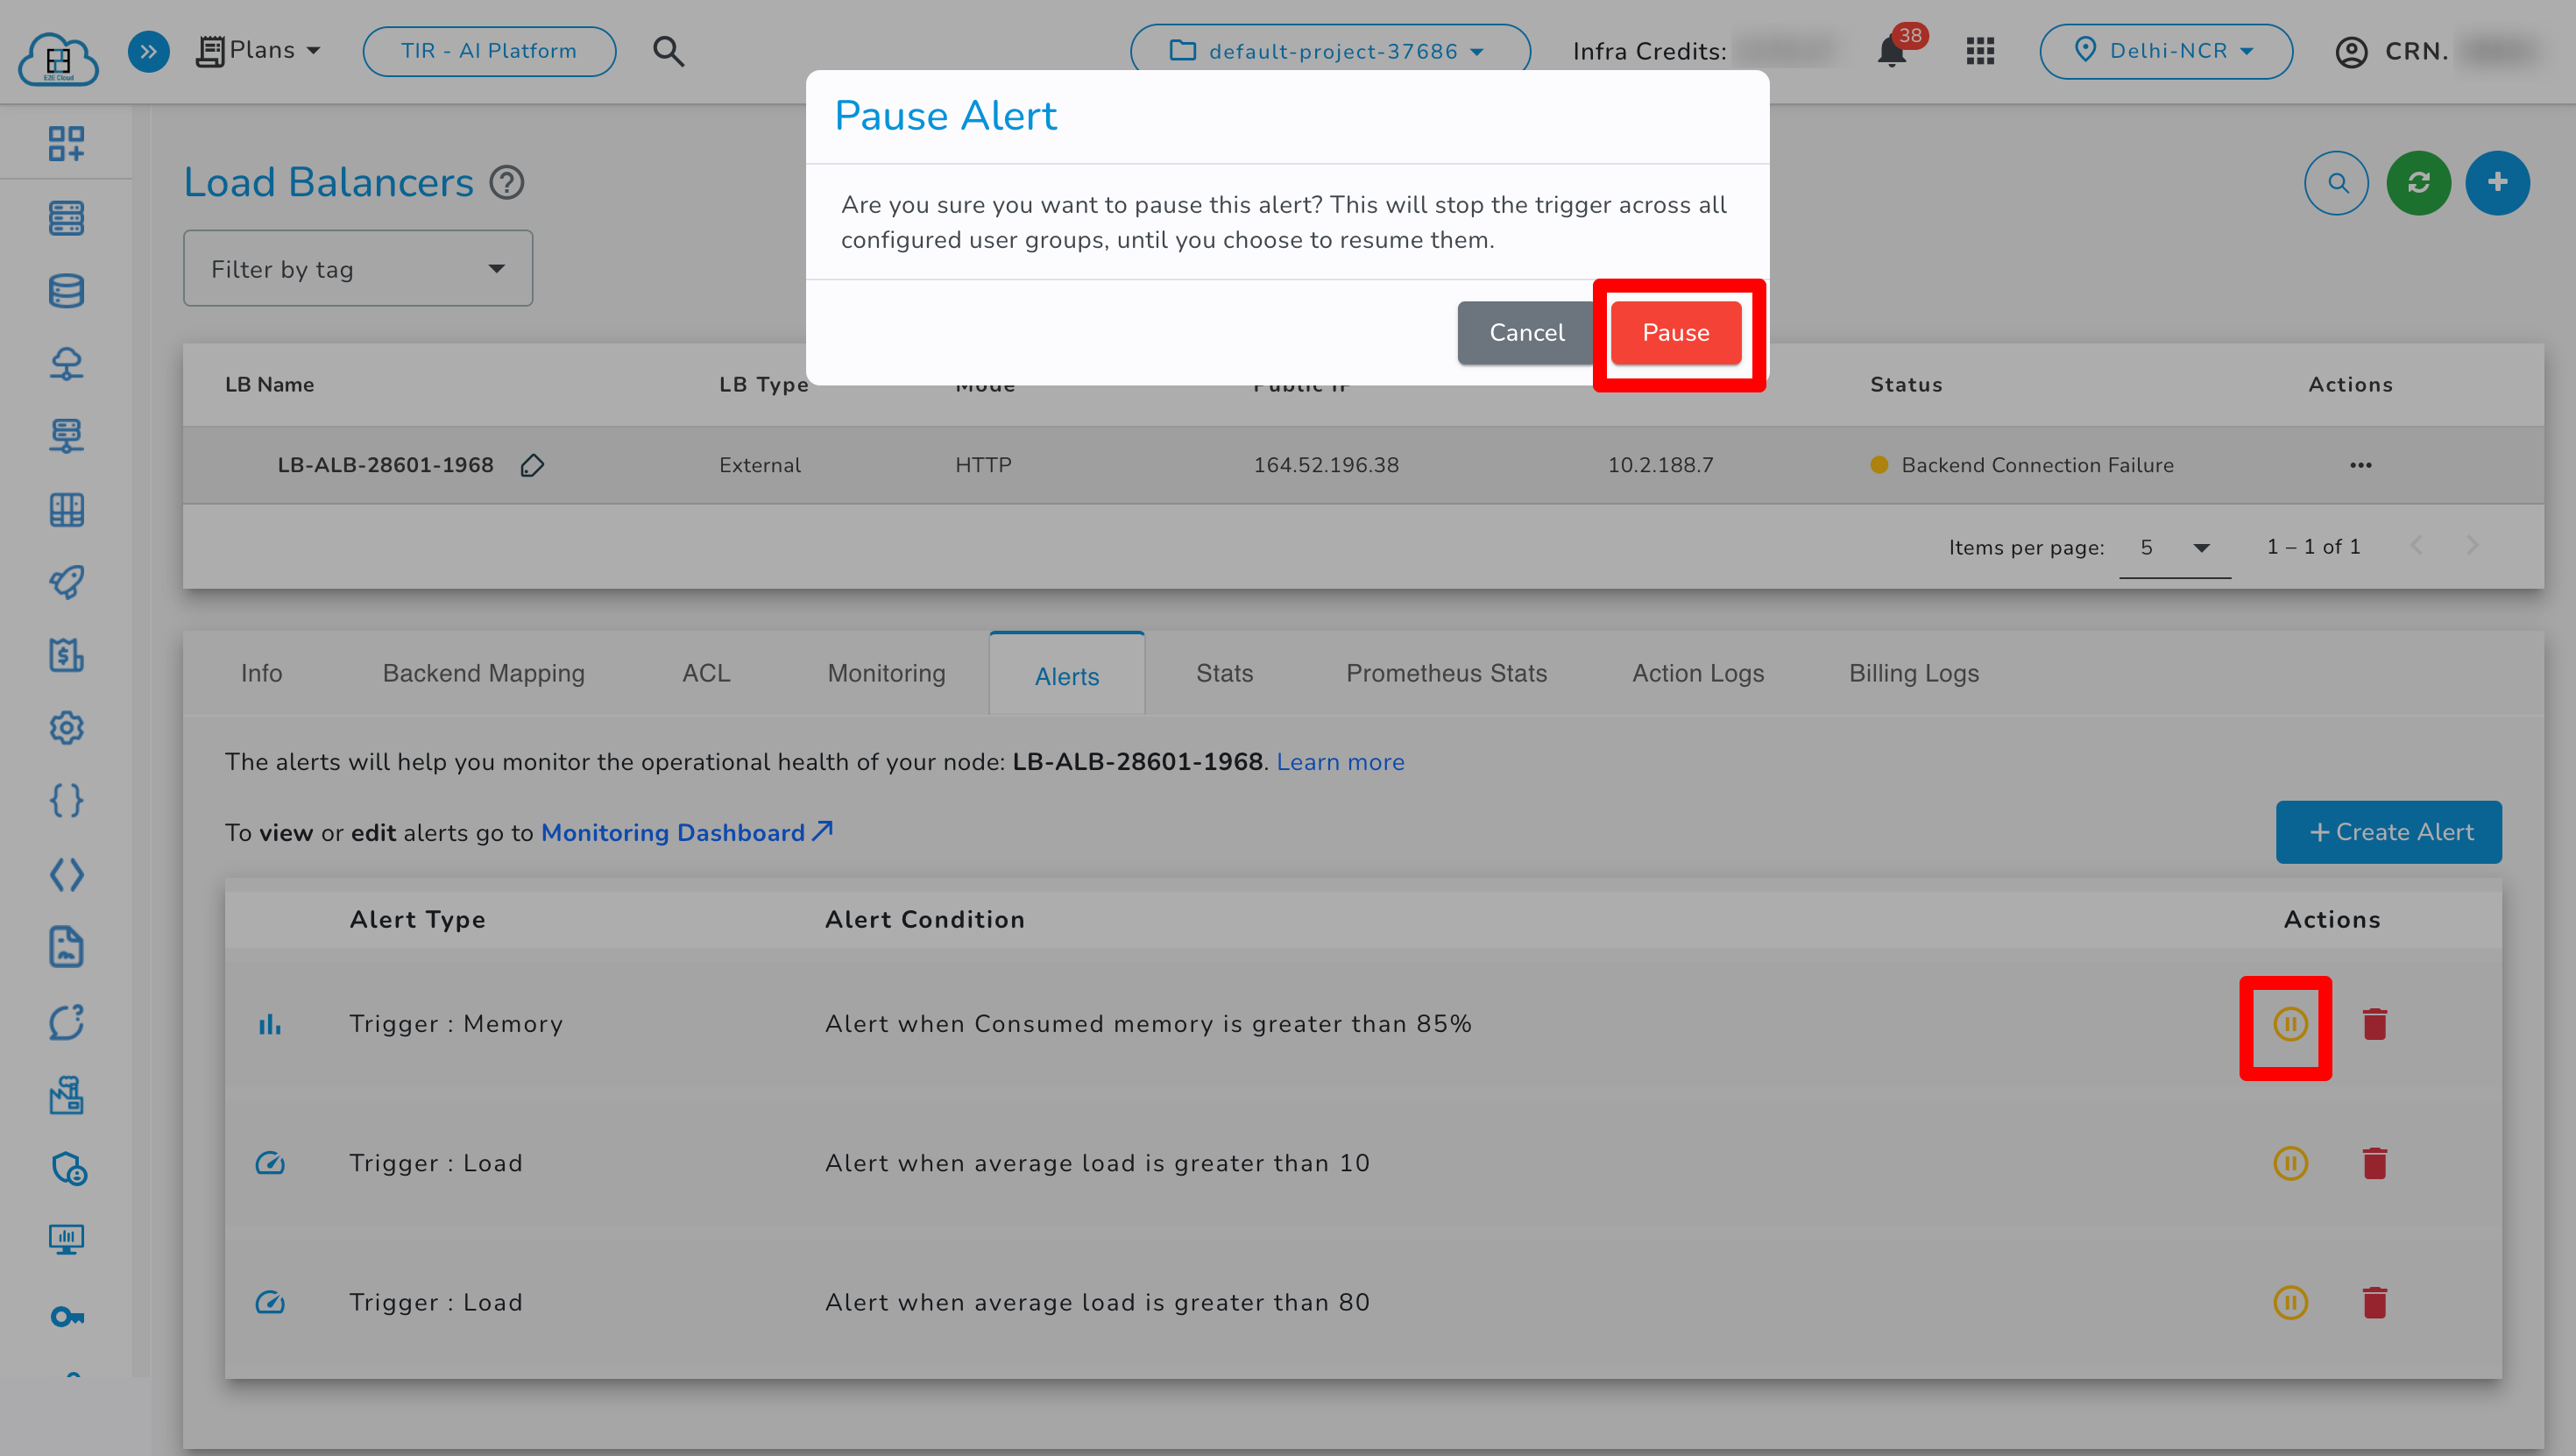
A confirmation popup will appear:
This will stop the trigger across all configured user groups until you choose to resume them.
-
Click Cancel to abort or Pause to confirm.
-
The alert status will be updated to reflect that the alert is paused. No alert notifications will be triggered until it is resumed.

Resume Load Balancer Alert
-
In the Manage Load Balancer → Alerts tab, locate the paused alert.
-
Click the resume icon in the Actions column.
-
A confirmation popup will appear:
Are you sure you want to resume this alert?
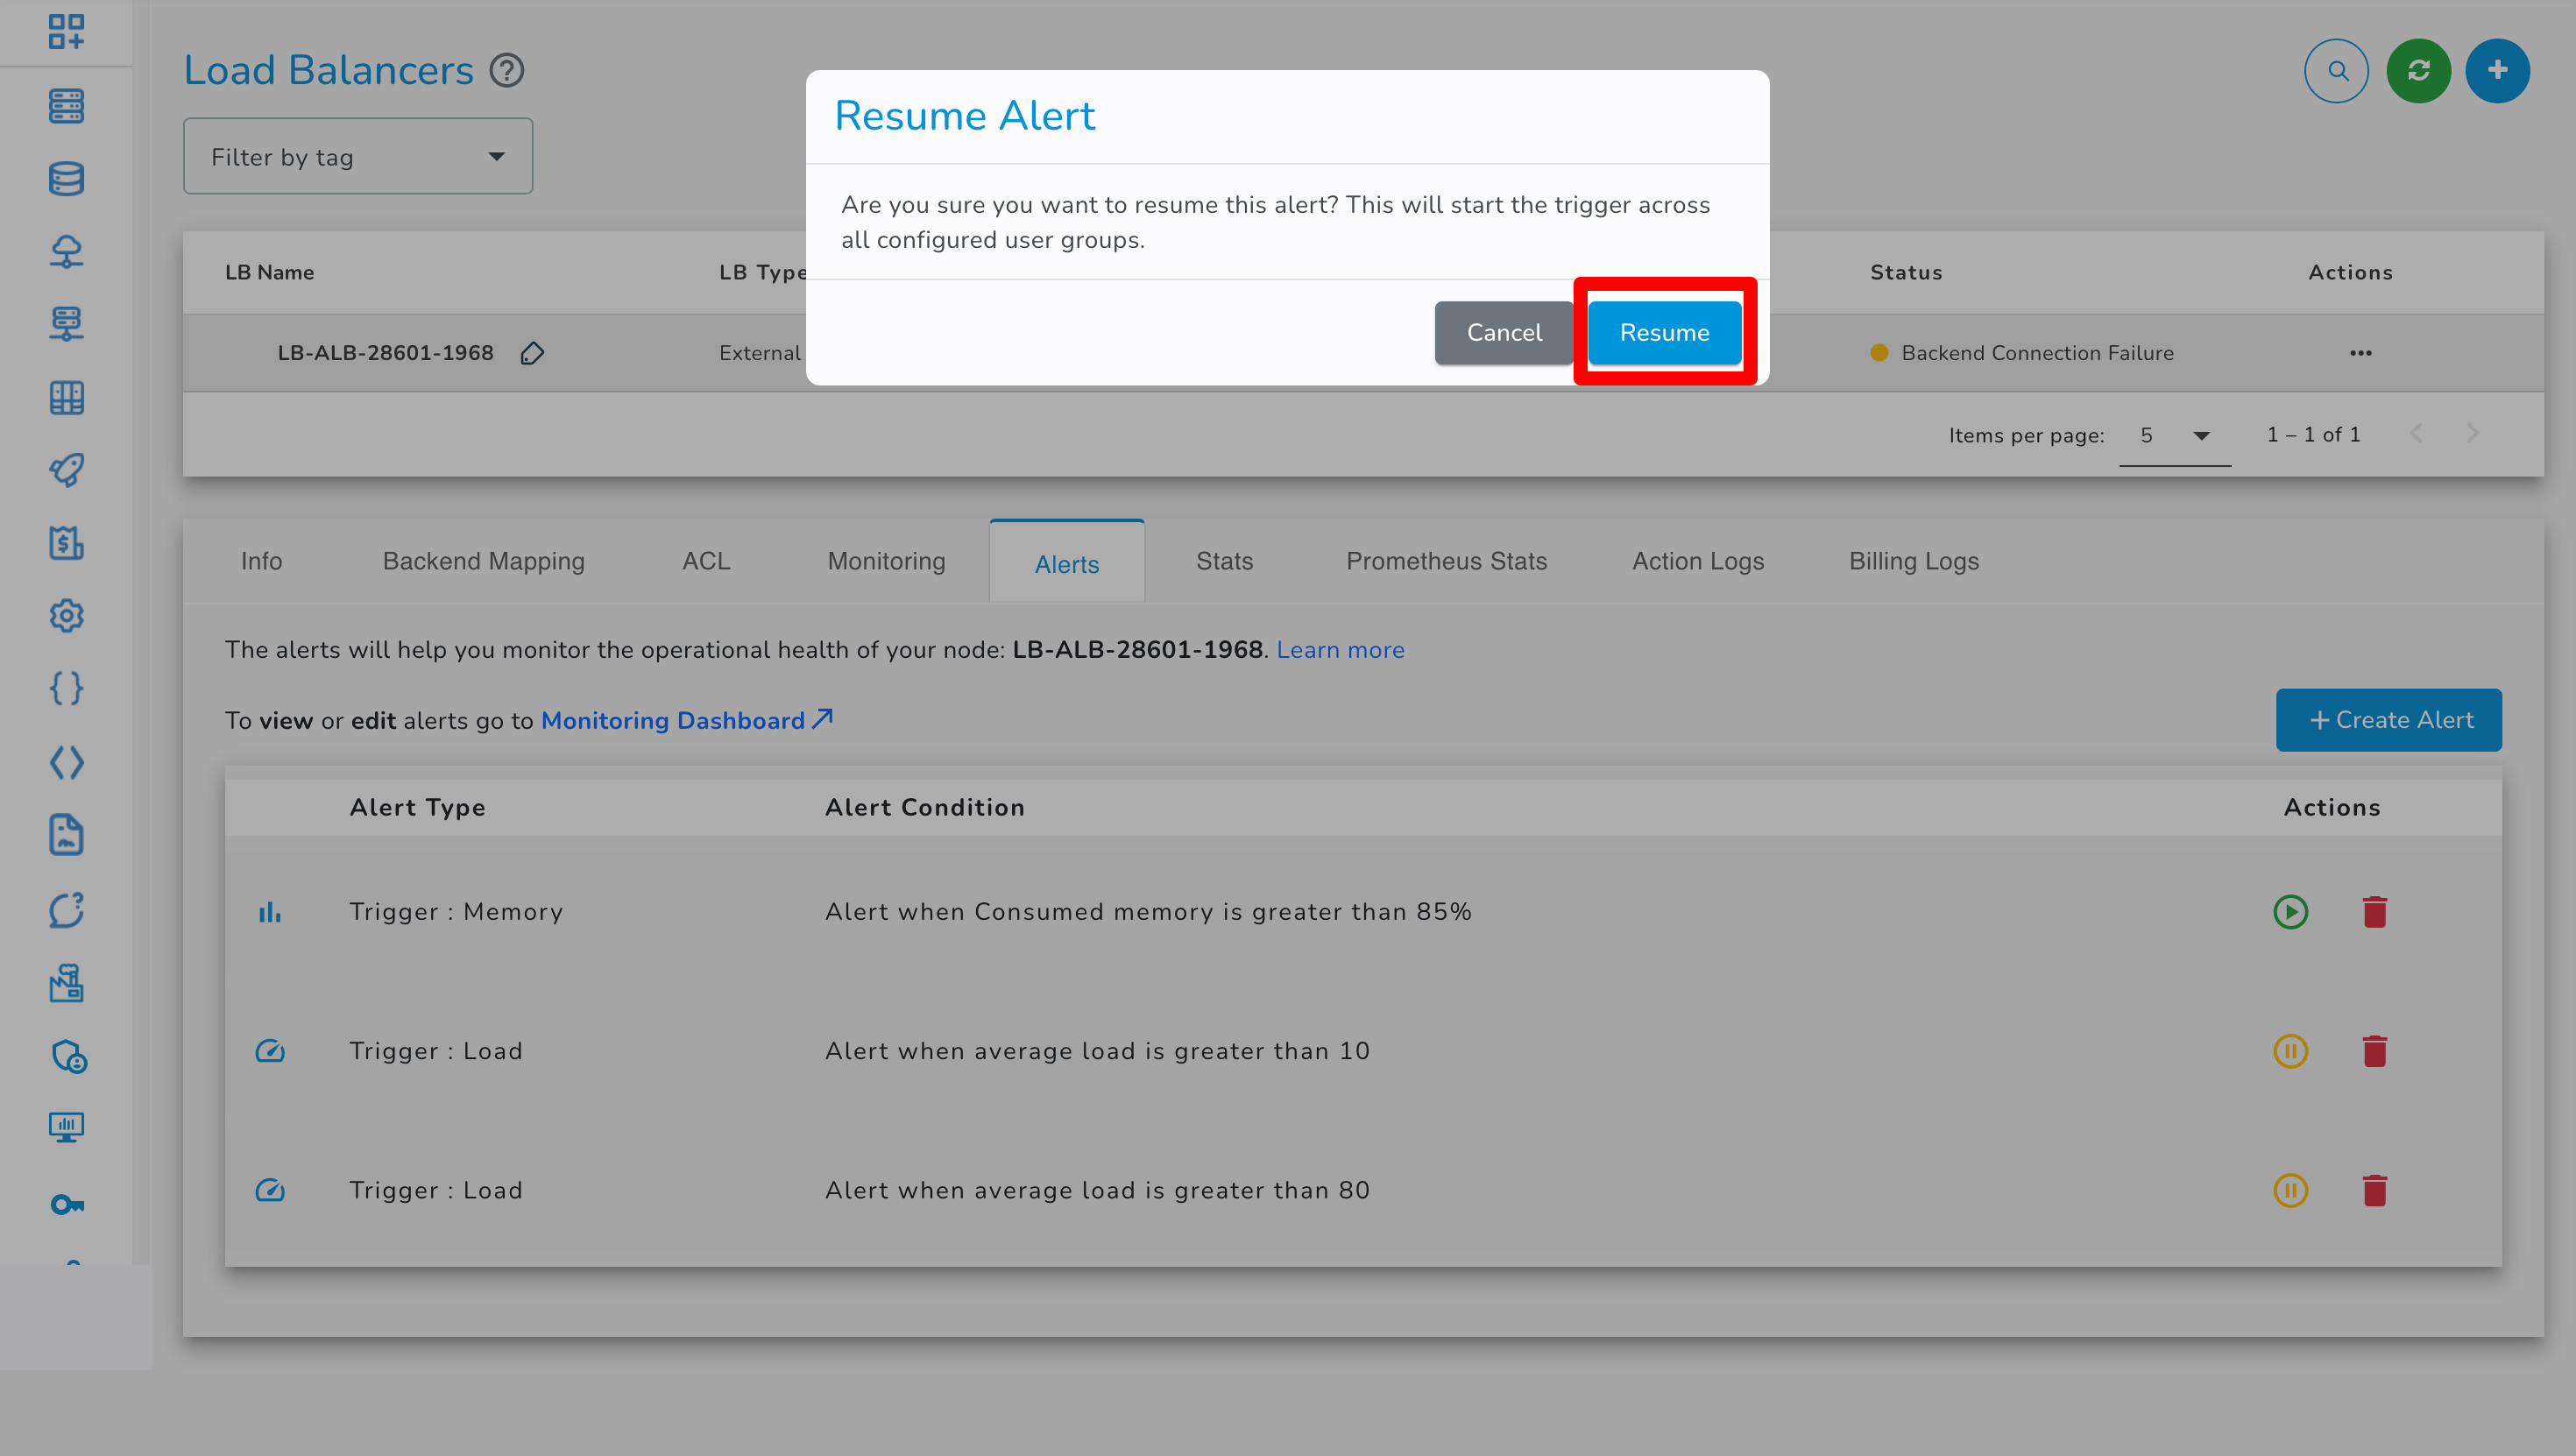
-
Click Cancel to dismiss or Resume to reactivate the alert.
-
The alert will now be active and begin triggering again based on the defined conditions.
✅ Note: Pause/Resume operations do not modify or delete your alert rules. They simply suspend or reactivate alert notifications as needed.
If an alert condition is met, users in the specified user groups will receive a notification.
Troubleshooting Steps if the Monitoring Data is not visible
Monitoring is pre-configured and data should be visible within 5–10 minutes post-launch. If data isn’t visible:
Step 1: Ensure Zabbix-agent is running
Check the agent's status:
service zabbix-agent status