How to Monitor Server Load on a Windows Server
What does Server Load stand for?
Verifying the load on a server allows you to calculate the server resources and confirm that they are sufficient for any application running. It enables you to troubleshoot Server slow performance and reliably pinpoint any server resource that may need attention. While there are many tools and options available, we focus on Windows Task Manager to help you quickly see what is going on, and interact with applications, processes, and services to identify the load.
How to Start the Windows Task Manager

Click on the Start menu and type task… then choose Task Manager
Right-click on the Taskbar area and choose Task Manager from the menu
Press Ctrl+Alt+End keys on the keyboard when in a Remote Desktop session
Run the command taskmgr
Let’s go through what the Windows Task Manager has to offer.
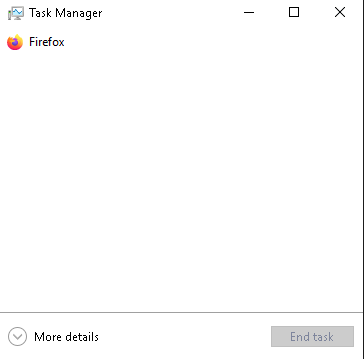
On Server Node where Task Manager has never been used, you may find Task Manager offering this very uninteresting display. You can click on More details to discover the treasure trove of information it is hiding. The Windows Task Manager provides quick access to Processes, Performance, Users, Details, and Services.
Windows Task Manager Processes Tab
The Task Manager Processes tab shows us everything that is running in the Server and the amount of CPU and Memory resources it is using. At the top, you can see the total CPU and Memory (RAM) utilization.
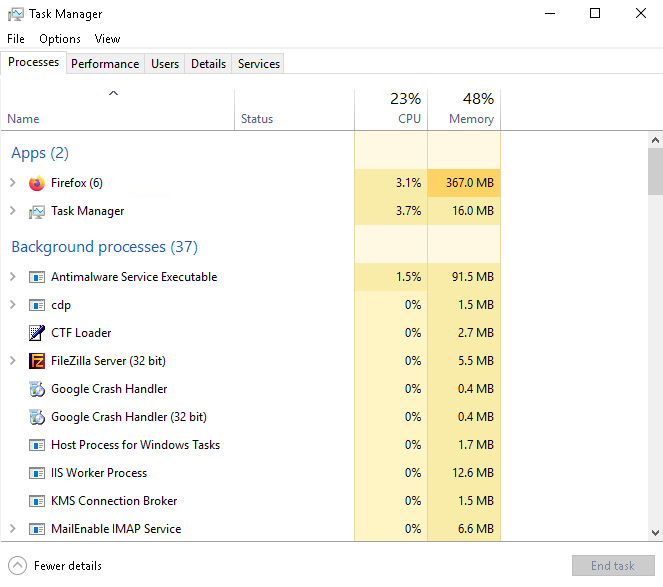
By clicking on the CPU or Memory column headings, you can sort the processes list by that criteria, and use the sort arrow to determine whether to sort from highest to lowest usage or vice-versa. You can click on any individual windows process and end the task, see resource usage, and more.
Windows Task Manager Performance Tab
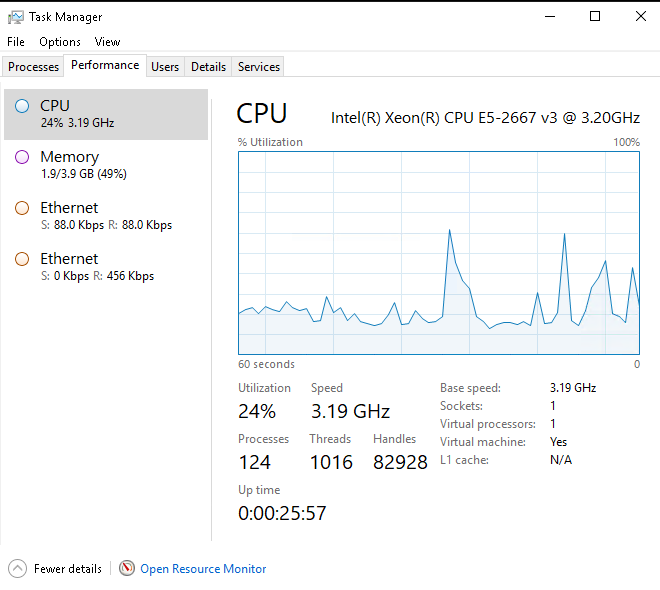
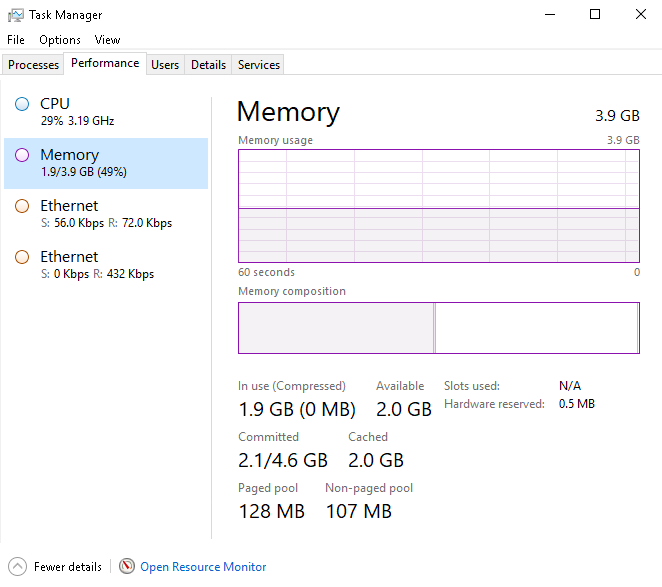
The Task Manager Performance tab has the most visual display of information and allows you to select from CPU, Memory, and Ethernet views to show activity over a 60-second period. With this view, you can identify spikes or see the trend over time to determine if a condition is temporary or sustained.
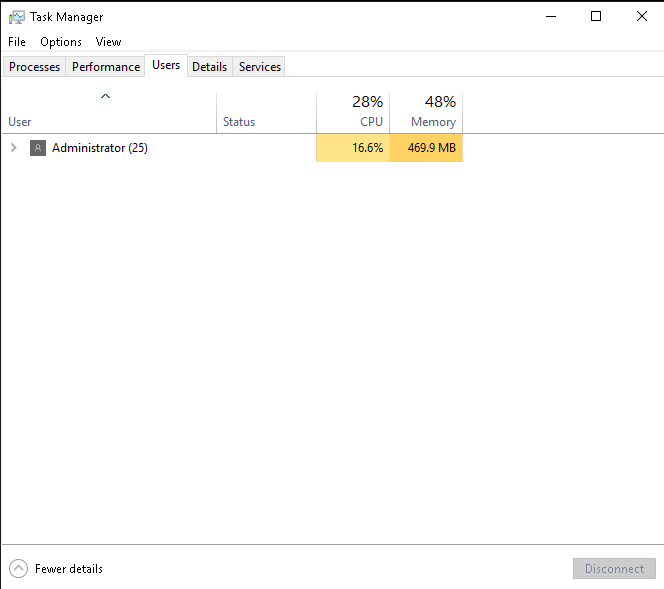
Windows Task Manager Users Tab
The Task Manager Users tab shows us a list of all the users connected to the server node and how much CPU and memory resources the user is utilizing. You can click on a specific user to disconnect them, send them a message, or take over their session if you have Administrator rights.
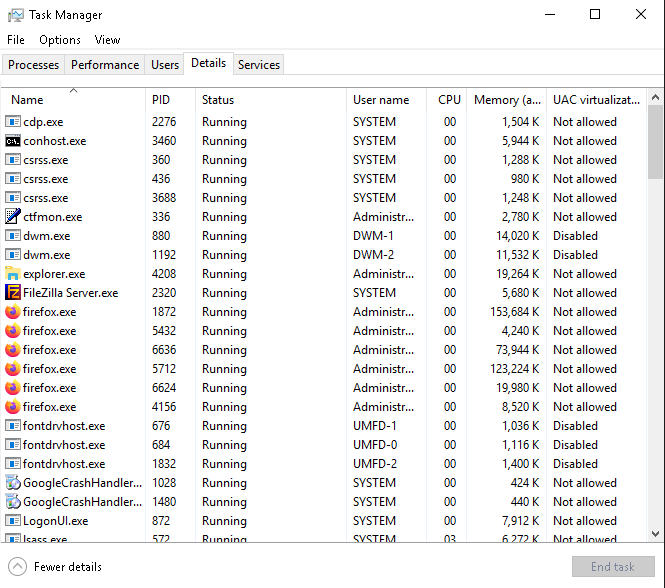
Windows Task Manager Details Tab
The Task Manager Details tab shows us a list of all the running applications and processes along with their PID (Process ID) number, whether the application is running or suspended, the username it is running under, the amount of CPU and Memory it is using, and a description of the process. You can click on any of the column names to sort by that column in highest to lowest or the opposite order. The PID number can be very helpful to track down a specific process that is referenced in event logs. Right-clicking on an item allows you to choose options including:
ending a process or process tree
set a priority for the running process
establish affinity to a specific processor or all processors
additional options
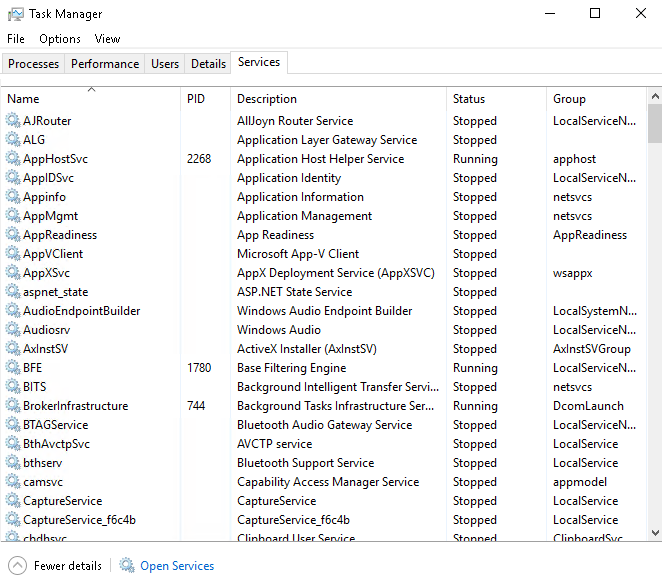
Windows Task Manager Services Tab
The Task Manager Services tab shows us a list of service names, their PID (Process ID) numbers, a description of the service, the status as either stopped or running and the Group the service is running under. Right-clicking on a service allows you to start, stop, restart, and access additional options. You should be careful not to change the status of some services as they depend on others, and stopping the wrong one could have unintended consequences on the system or devices. To learn more about a service, you can right-click on it and choose Search Online.
Windows Resource Monitor
You can also go through Windows Resource Monitor and monitor your server resource utilization. You’ll find Resource Monitor has more depth but it is very similar to the information available from Task Manager.
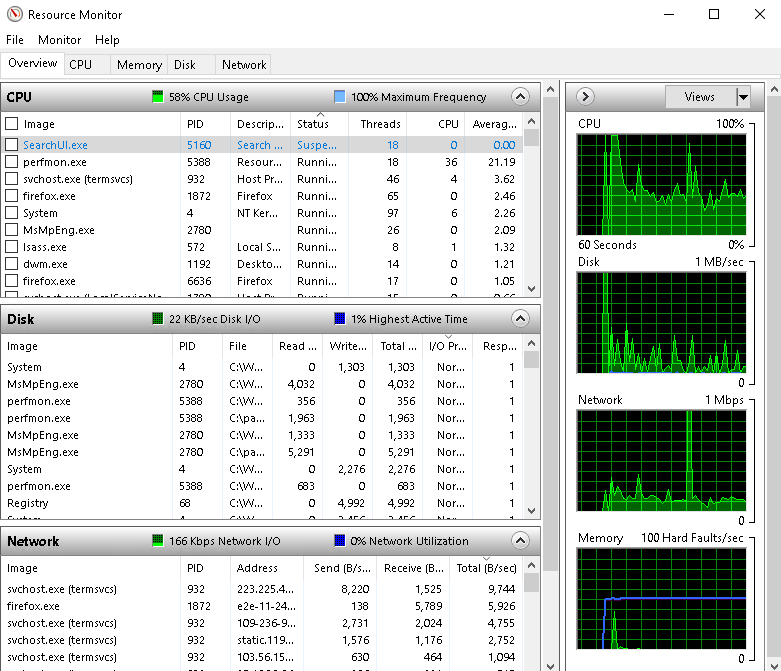
Monitor Network and Disk IO
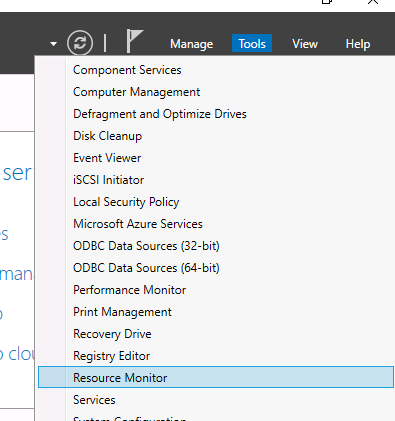
You can view more detailed information about Disk and Network usage, you can use “Resource Monitor”. Open Server Manager, click “Tools” and select it.
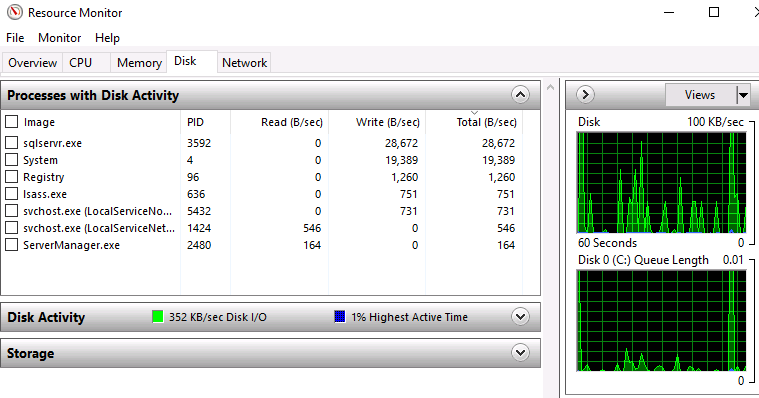
High disk usage might affect the normal functions of the server. When it is high, your server creates a queue executing one by one which can cause performance issues. You can view the relevant processes under the “Disk” Tab.
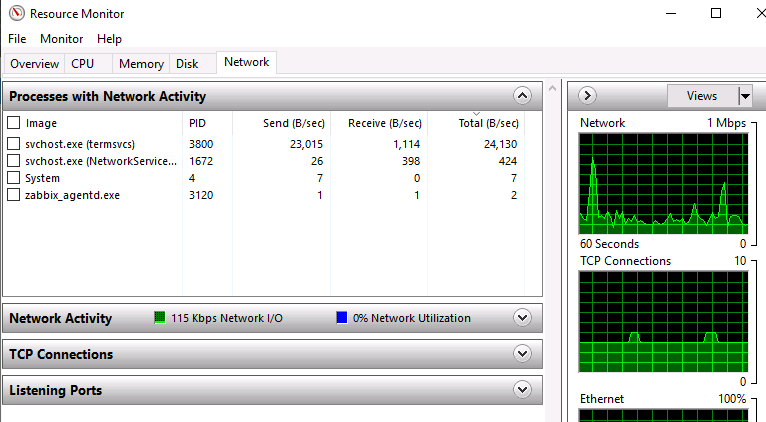
Similarly, when the network traffic reaches its peak, this might result in a slower performance of your server. You can view the same under the “Network” Tab.
If you have scheduled backup, You can avoid running backup during the peak hours, so that it will not impact during business hours. Also you can schedule downloading and installing windows updates in idle hours.
Finally, when you know which process is causing the problem, you should gather more information about that process. And if it is not relevant to your use cases, you can stop them by clicking on the “End Task” button available in the right bottom corner in the task manager.
If you are not sure about the process, Based on the process name you can also look on the web which might have relevant troubleshooting information and to overcome it.
For example, if you face issues with the process “Lsass.exe” you can refer to the Microsoft article here which will help to resolve it. Likewise, you can look for the relevant troubleshooting steps and act as required.
At last, if all the processes are genuine and still the server lacks performance you should consider upgrading the server to the next available plans. You can refer to the plans available with us here.
Scan Windows Server for Viruses or Malware
High CPU or RAM usage can be caused by running multiple heavy applications simultaneously which can be said to be the main reason for this. Apart from this, a virus attack which might use up all of the available CPU.
You can scan for Viruses or Malware using the antivirus software which you might have installed.
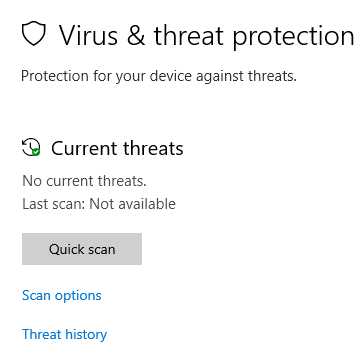
Or you can use the inbuilt Windows security tool. Open Start -> Settings -> Update & Security -> Windows security and Select “Virus & threat protection”.
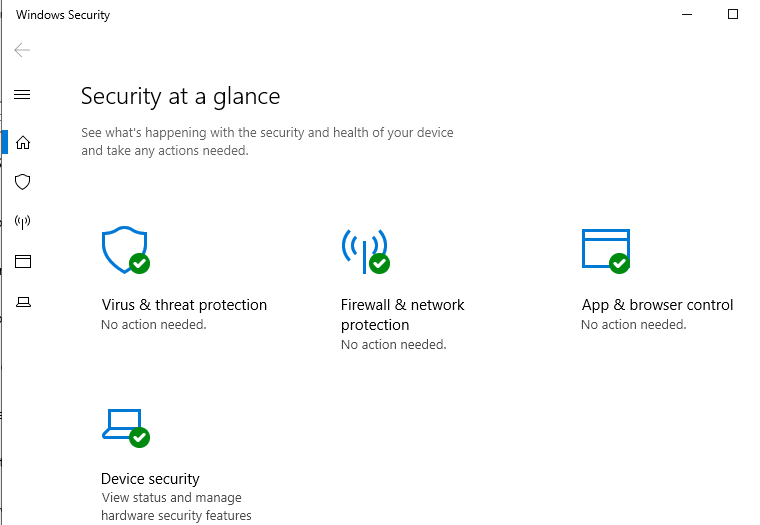
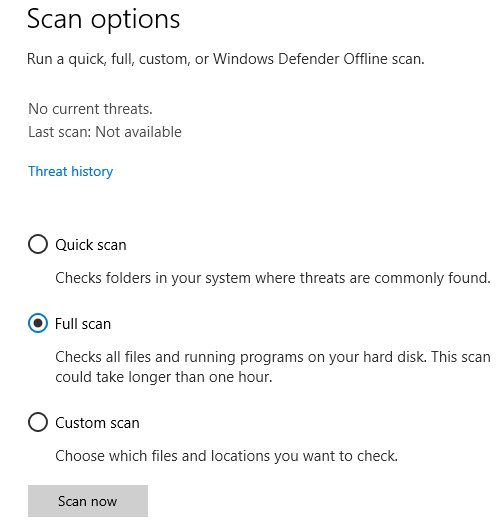
You can run a “Full scan” by modifying “Scan options” instead of running “Quick Scan”.
Remove if found any and observe the server performance.