Introduction
E2E Auto scaling enables you to dynamically scale compute nodes based on varying workloads and a defined policy. Using this feature, you can meet the seasonal or varying demands of infrastructure while optimizing the cost.
The core unit of EAS is a scale group. The following list covers the features and capabilities of scale groups:
Rule based Policy setup for adding nodes based on workload
Integration with Load Balancer to automatically list or de-list backend servers
Automatic removal of nodes when utilization falls below a set threshold
SSH access to each node enables activities like log viewing, debugging etc
Before you define your first scale group, we recommend familiarizing yourself with concepts and terminologies.
Concepts
Application Scaling helps you offer consistent performance for your end-users during high demand and also reduce your spend during periods of low demand. The following section covers the key terminologies used through this document:
Scaler
Scaler is E2E service that manages Application Scaling functionality.
Scale Group
Scale Groups represent the nodes launched by Scaler. Each group is destined to adhere to a scaling policy (e.g. Add a compute node when CPU utilization on an existing node hovers at 70% for 20 seconds).
Group nodes
The nodes in a scale group are dynamically added or removed. These nodes will be referred to as Group nodes or just nodes in the rest of the document.
The lifecycle of group nodes starts with the creation of scale groups and ends with the termination of the group. You will be charged for the time between start action of a node and the time of termination.
Saved Image
Due to the dynamic nature of nodes, you would want to automate the launch sequence of the application too. This is where the saved image comes into play. A saved image is nothing but a compute node that you had saved and has the capability to launch your application at the startup.
Compute Plan
The compute plan or plan is where you select infrastructure or hardware requirements for your group nodes. It need not be same as the plan you had used to create your saved image.
This is a plan sequence you are most likely to follow when defining application scaling:
Create a node with a conservative plan for application (e.g. C Series 1 CPU 1GB)
Add launch sequence to auto-install and start your application during startup
Create a scale group with an actual plan you need for your production servers (e.g. C series 16 CPU 64 GB)
Scaling Policy
A scaling policy determines the lifecycle of group nodes. It consists of an expression that contains the following factors:
Min. nodes
Max. nodes
Desired nodes or Cardinality
Watch Period and Period Duration
Cooldown
A scaling policy determines how you want to add a node to the group. A negative policy is automatically created by Scaler to handle termination of nodes. For example: When a user sets an expression of CPU > 80 for upscaling, the scaler will automatically create a downscaling policy of CPU < 80. The downscaling policies will be internally managed by the scaler.
Min and Max nodes
Min and Max nodes determine the maximum or minimum guarantees from your scale group.
Cardinality or Desired Nodes
Though the actual number of group nodes is decided by scaler through policy configuration, you have an option to influence this setting on certain occasions.
One of such occasions is when you perform code or image updates. You could launch extra nodes that will absorb the changes and then manually delete the existing nodes that have an older version of your code.
Keep it simple! Start with 2 nodes and let the scale group take over
Performance or Target Metric
At this time, a scaling policy only supports CPU Utilization.
Watch Periods
It is normal to see CPU spikes on the servers but what you want is a consistent spike that lasts for a period of time to make a scaling decision. A watch period has two parts: Periods and Period Duration
A duration determines how long a period lasts and the number of periods determines how long the watch lasts. Let’s go through an example to understand this better.
Note
Consider this scaling policy:
Expression: CPU > 75
Watch Period: 2
Period Duration: 10 seconds
The scaler will watch out for 2 consecutive periods (of 10 seconds each) when the CPU Utilization stays at above 75%. And when such condition occurs the scaling operation will be initiated.
Cooldown
A cooldown is a full period when all scaling operations are blocked. It typically starts right after a scaling operation. The idea of cooldown is to wait and watch for impact of a scale operation before taking further actions. The default is 150 secs.
Load Balancer
Load balancers form the entry doors when your scaling applications. While the actual group nodes (and their IP) may keep on changing, the load balancer will enable consistent access for the external world.
Tip
Always bundle your scale groups with a load balancer.
Define Scale Groups
Application scaling helps you optimize your infrastructure by automatically adjusting the number of compute nodes based on a predefined policy. You can define a scale group (a pool of compute nodes) for any web frontend or backend application and provide consistent performance to your end-users.
Before you Begin
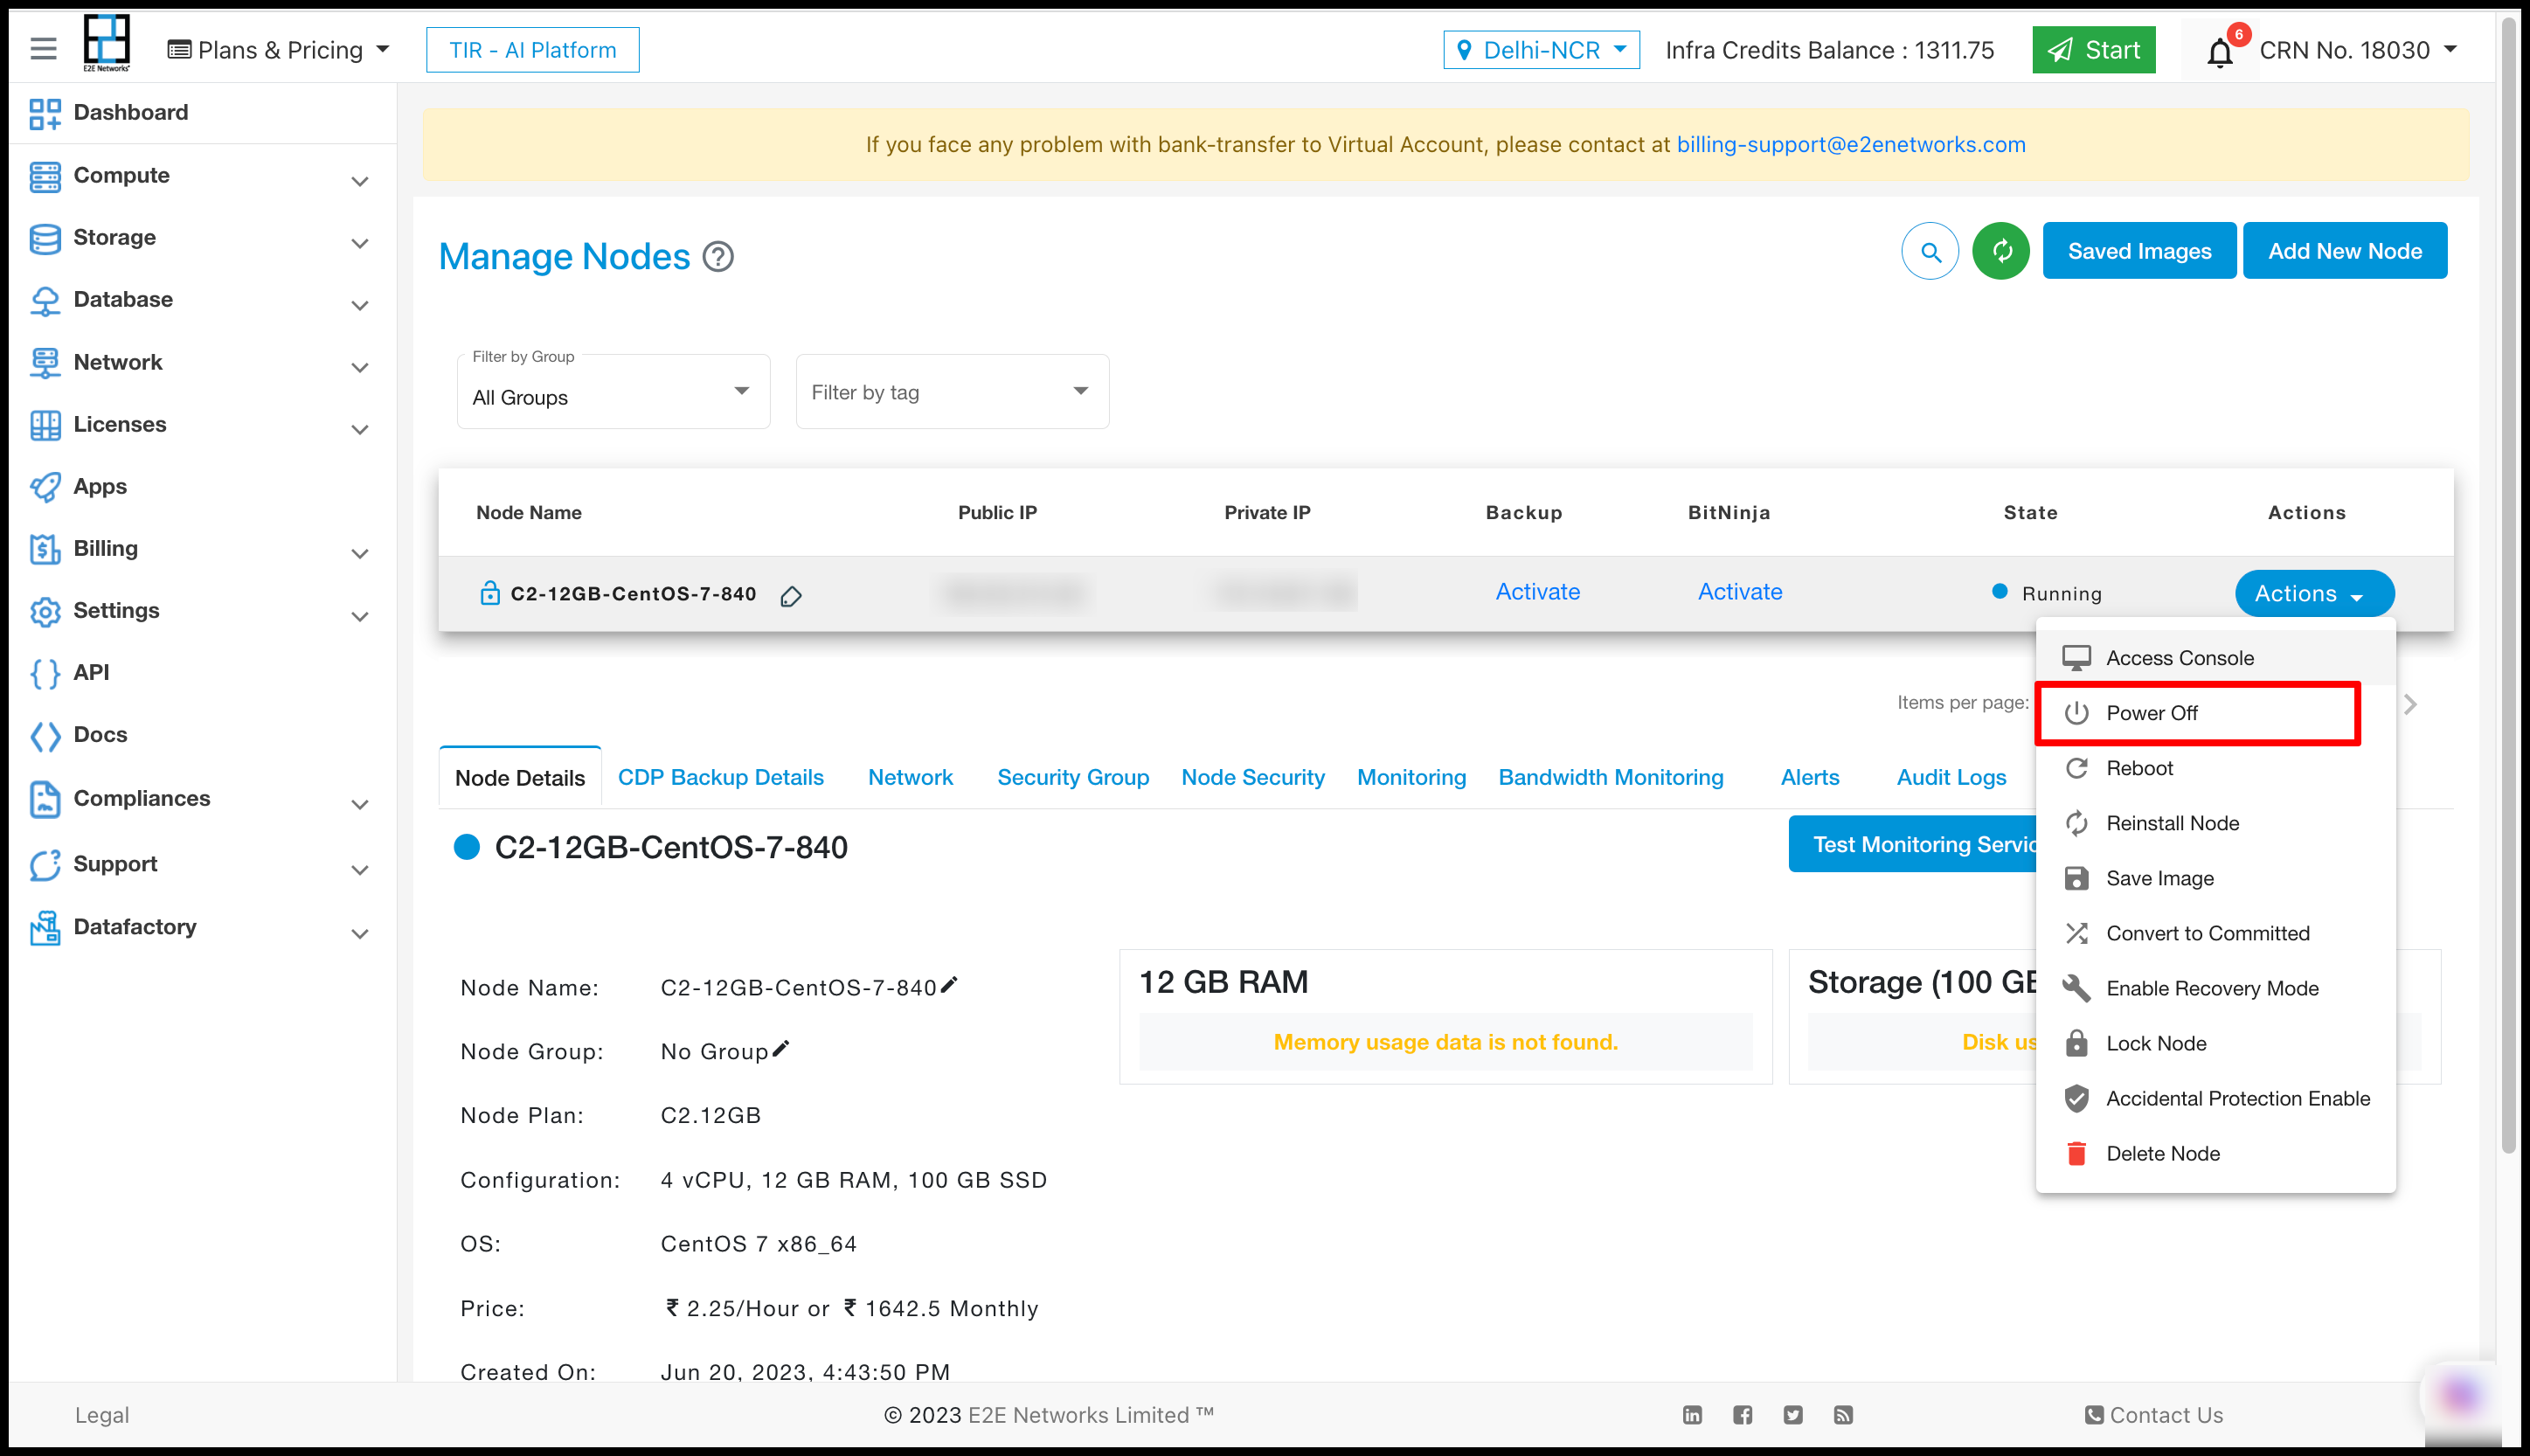
To save an image of a Virtual Node, it must be powered down. For this, click on the Power Off under the Actions section.
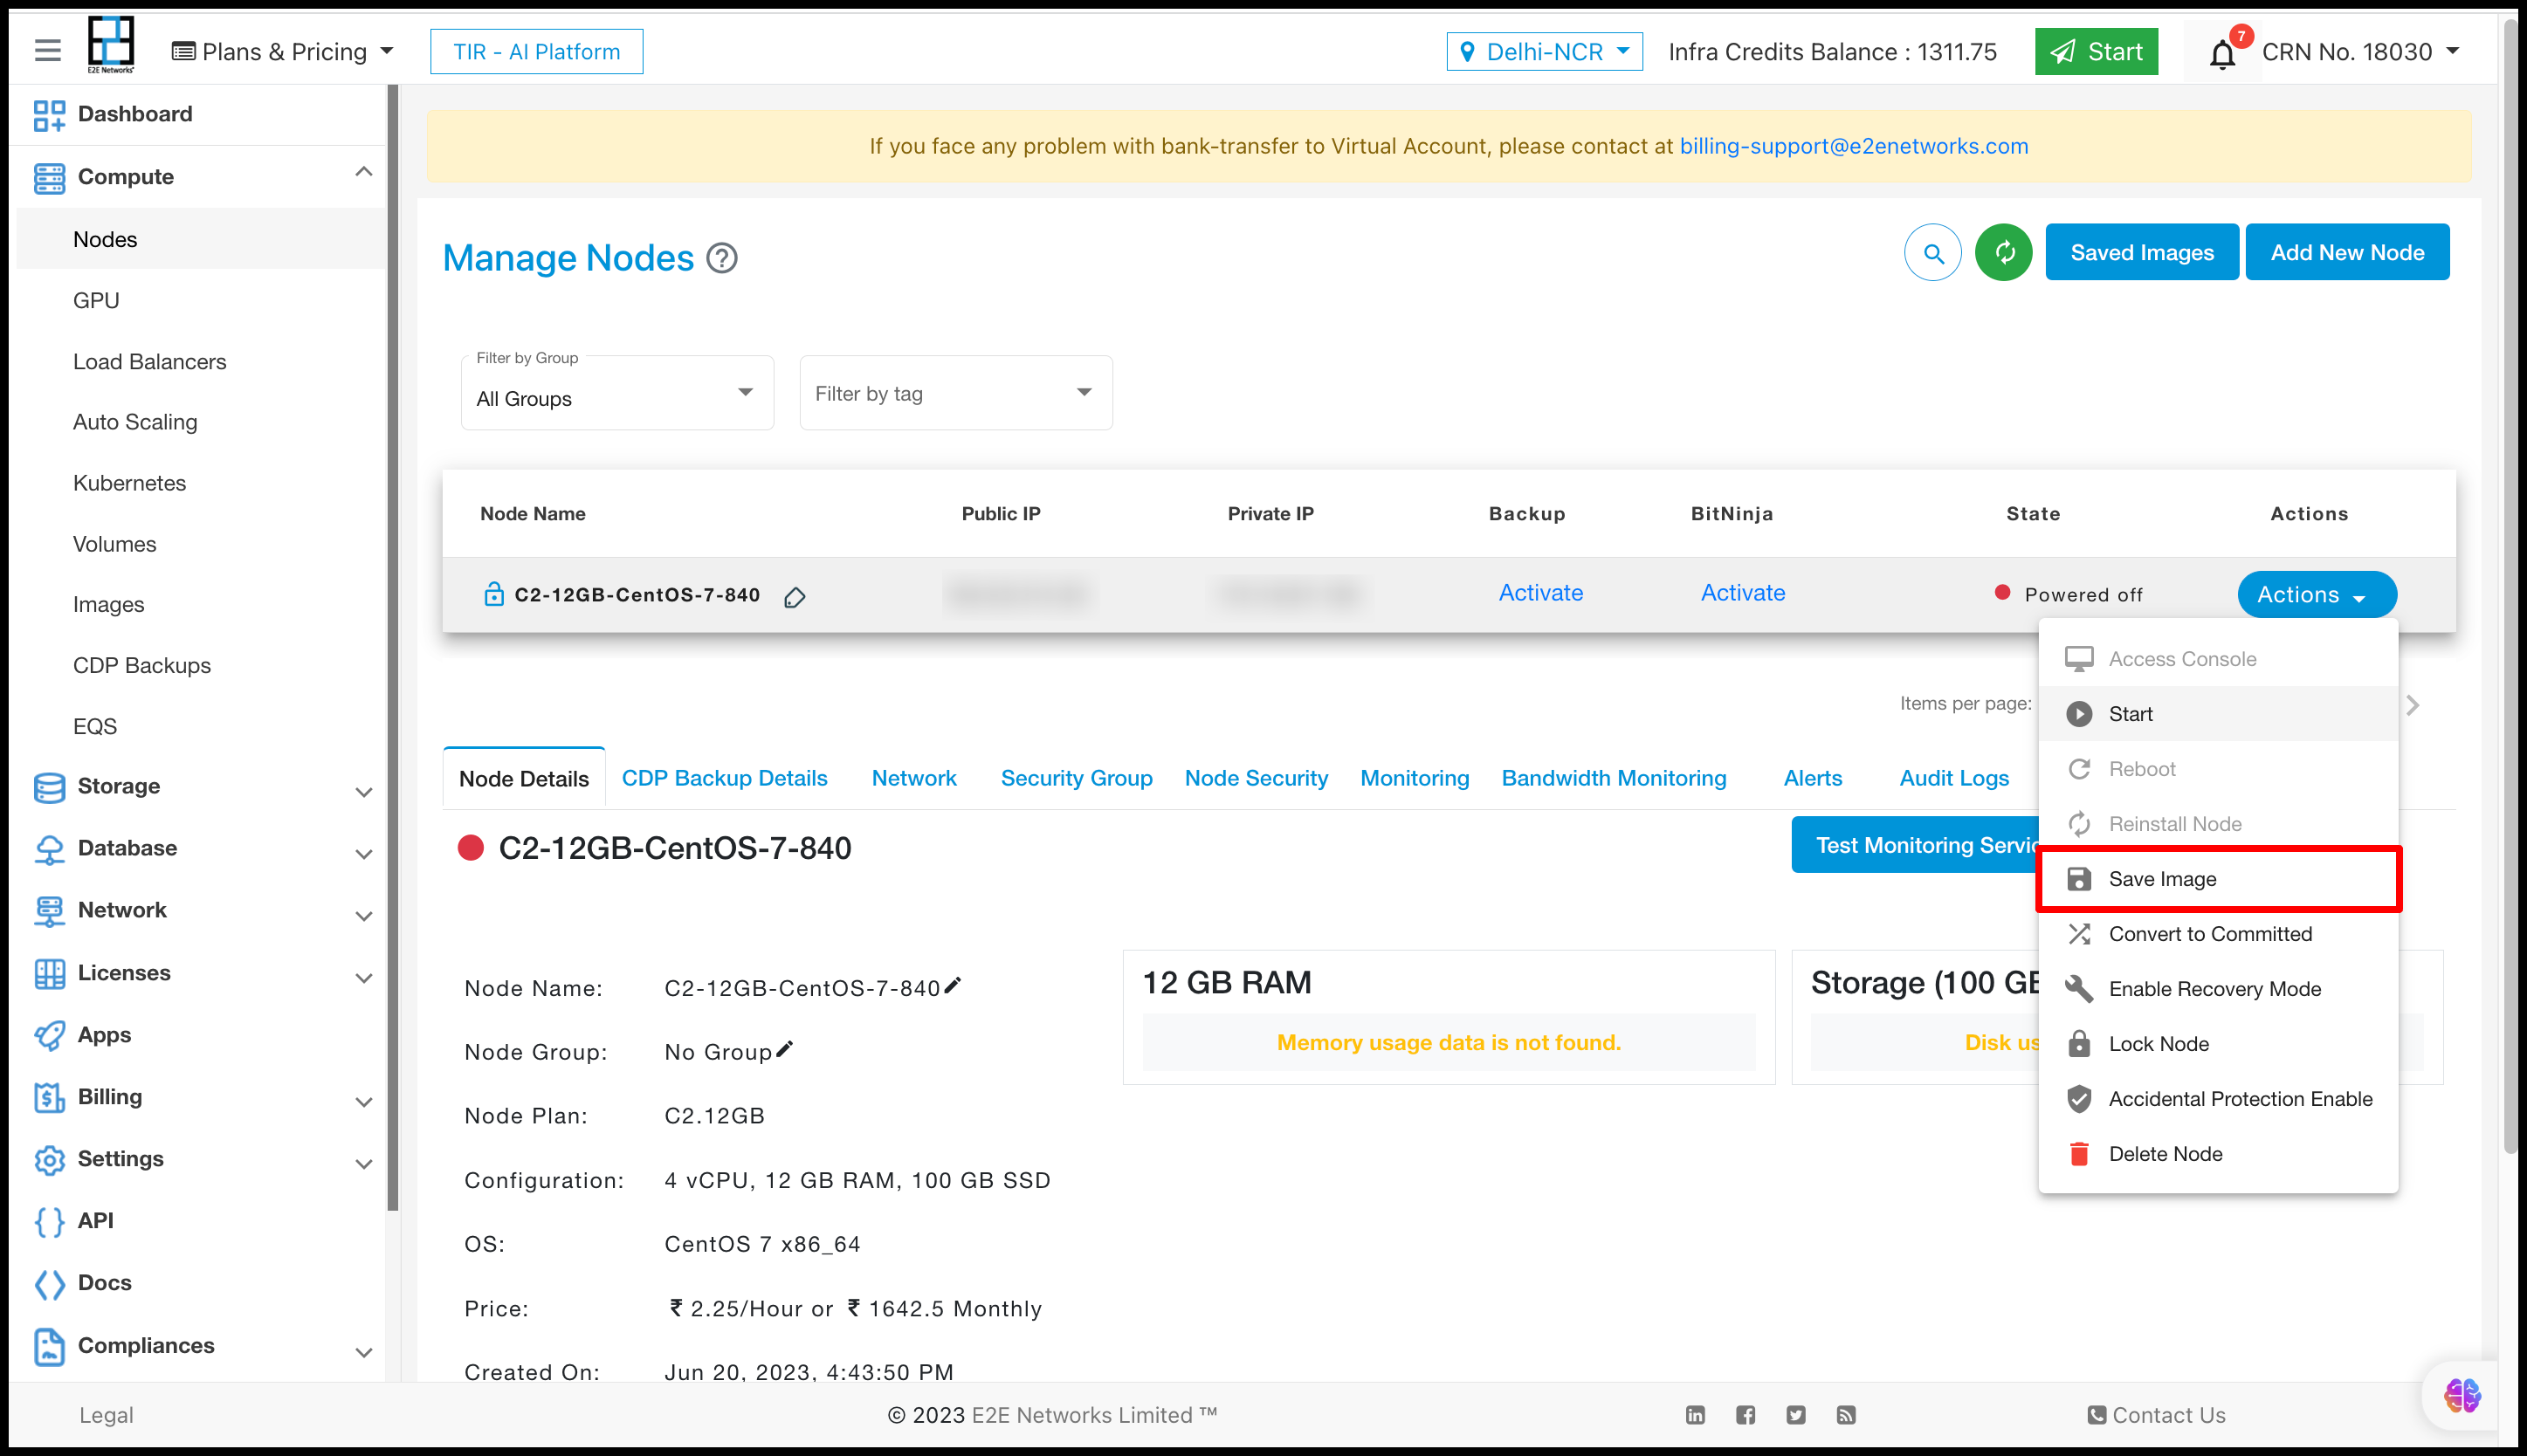
After powering off Node now again click on Action button and then click on Save Image button.
Steps to Define Scale Groups
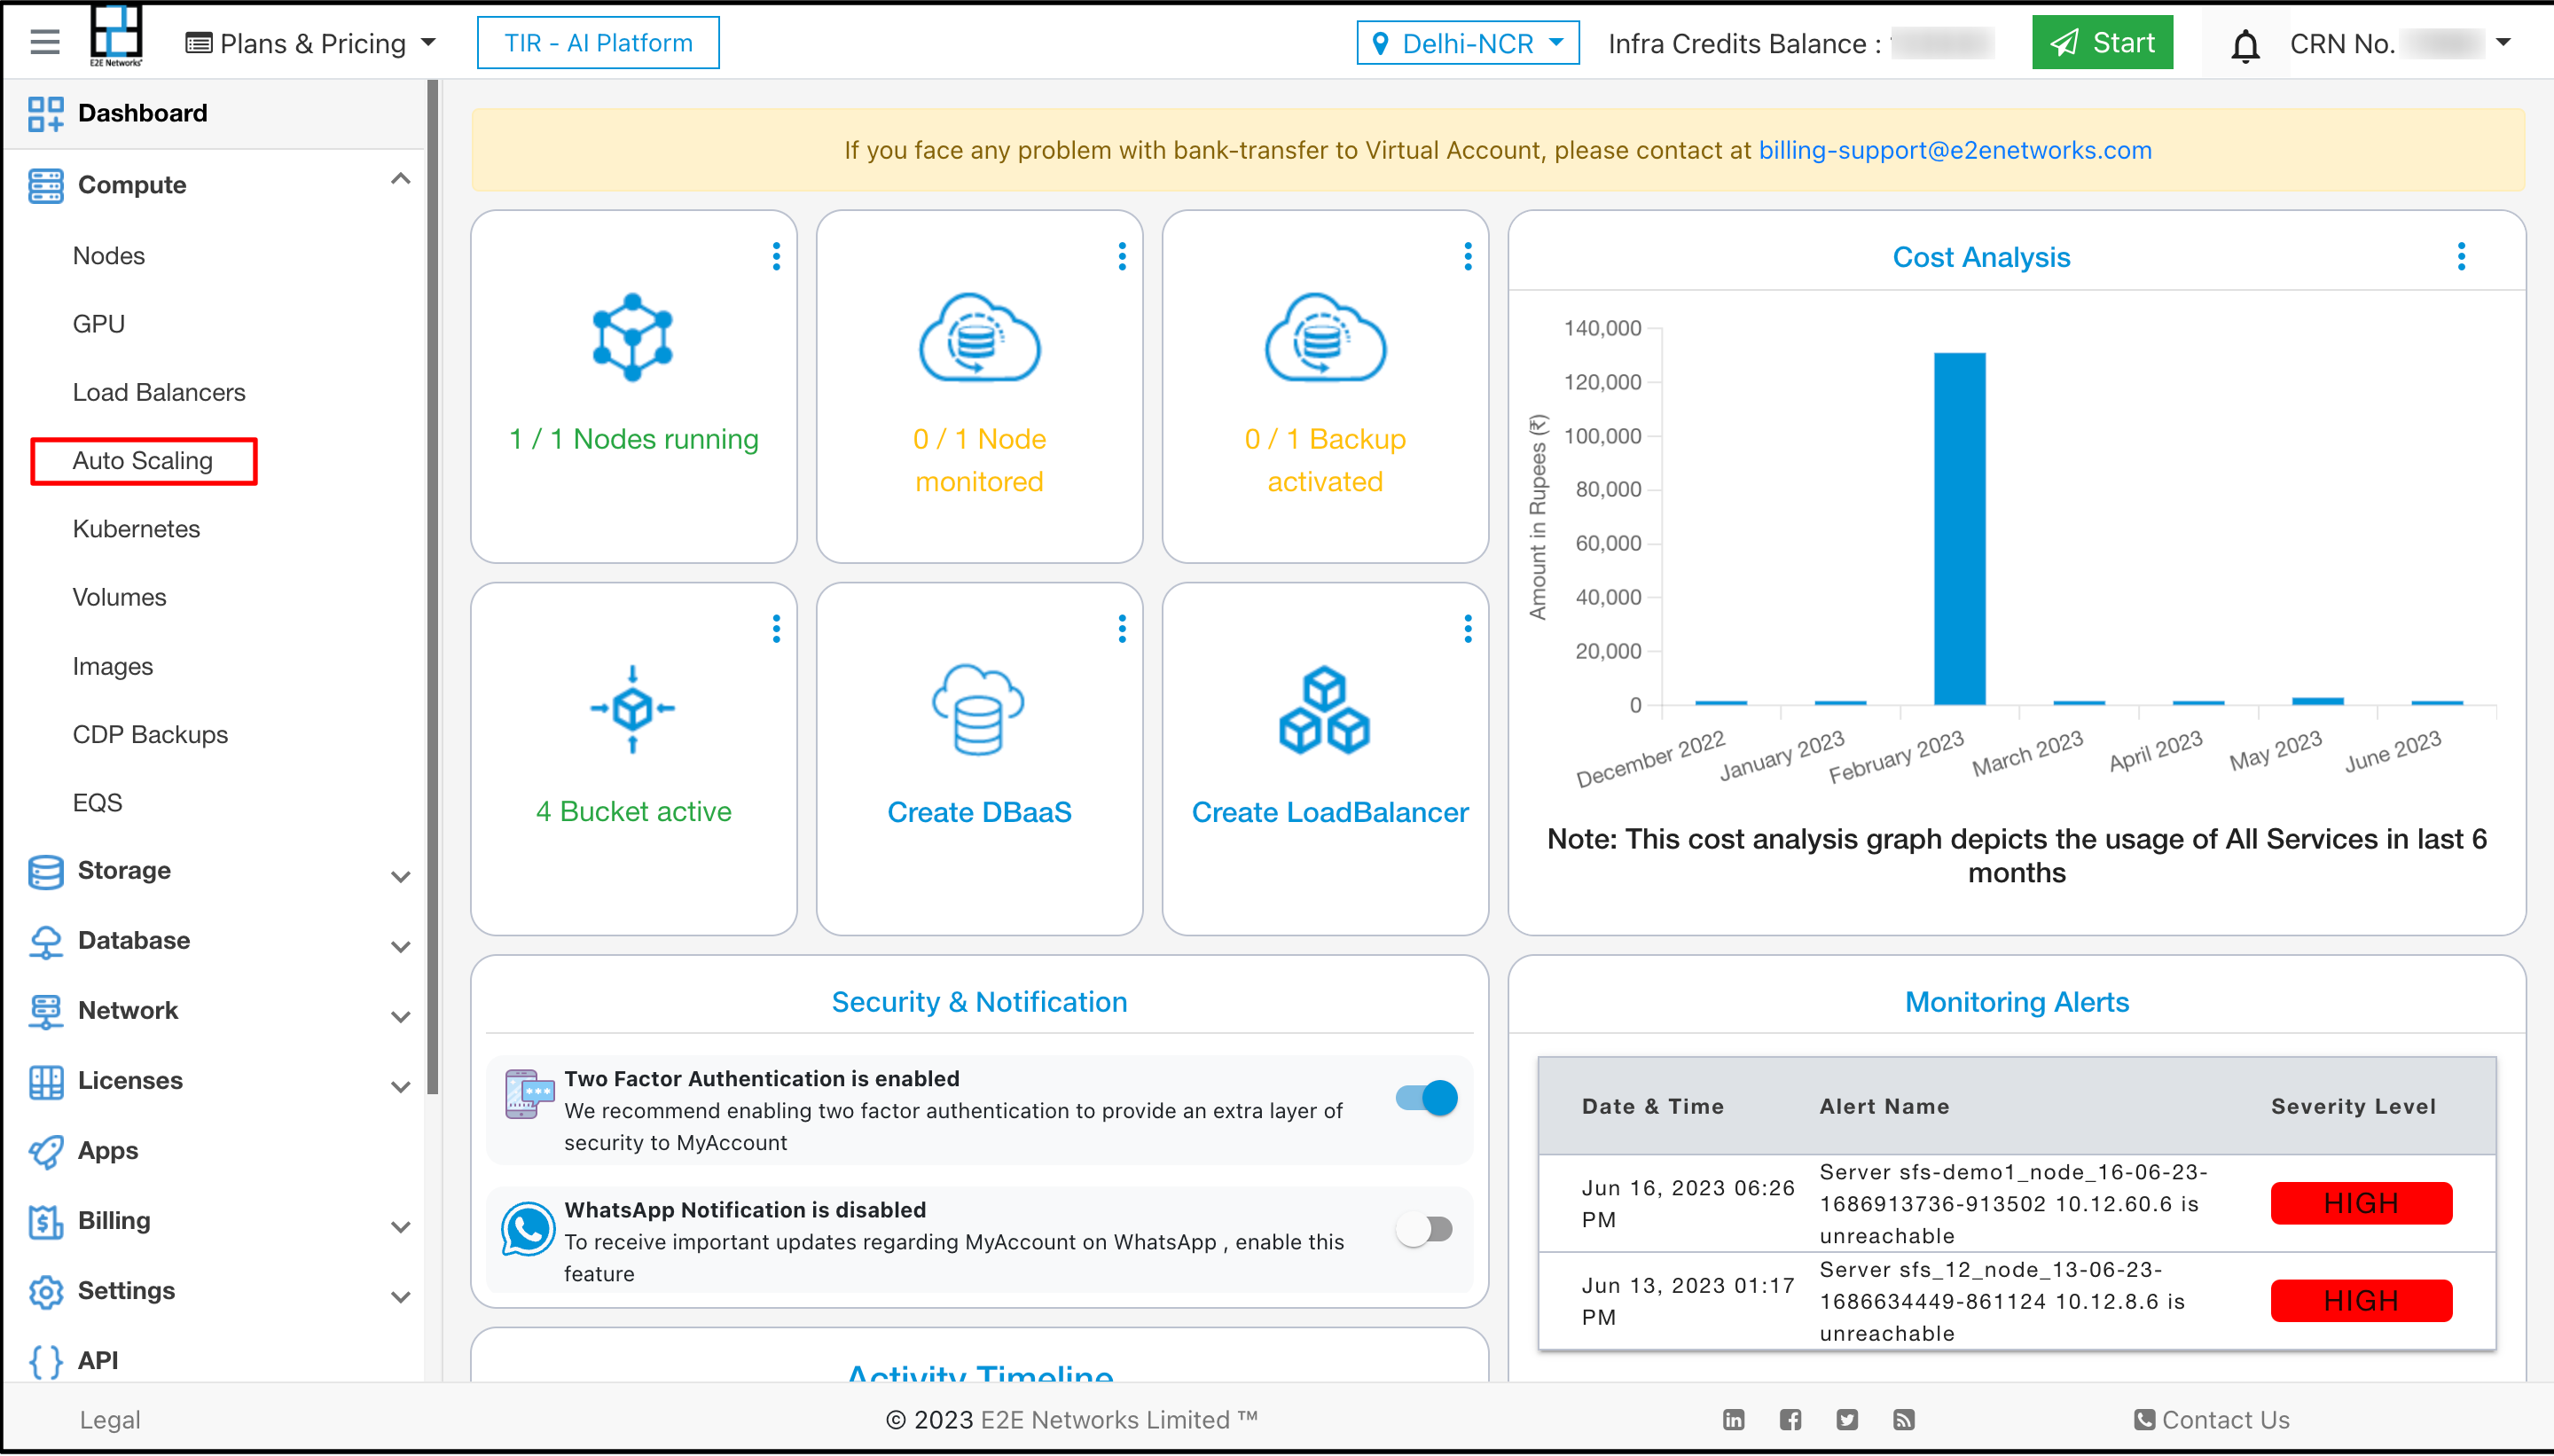
Go to My Account
Go to Compute > Auto Scaling
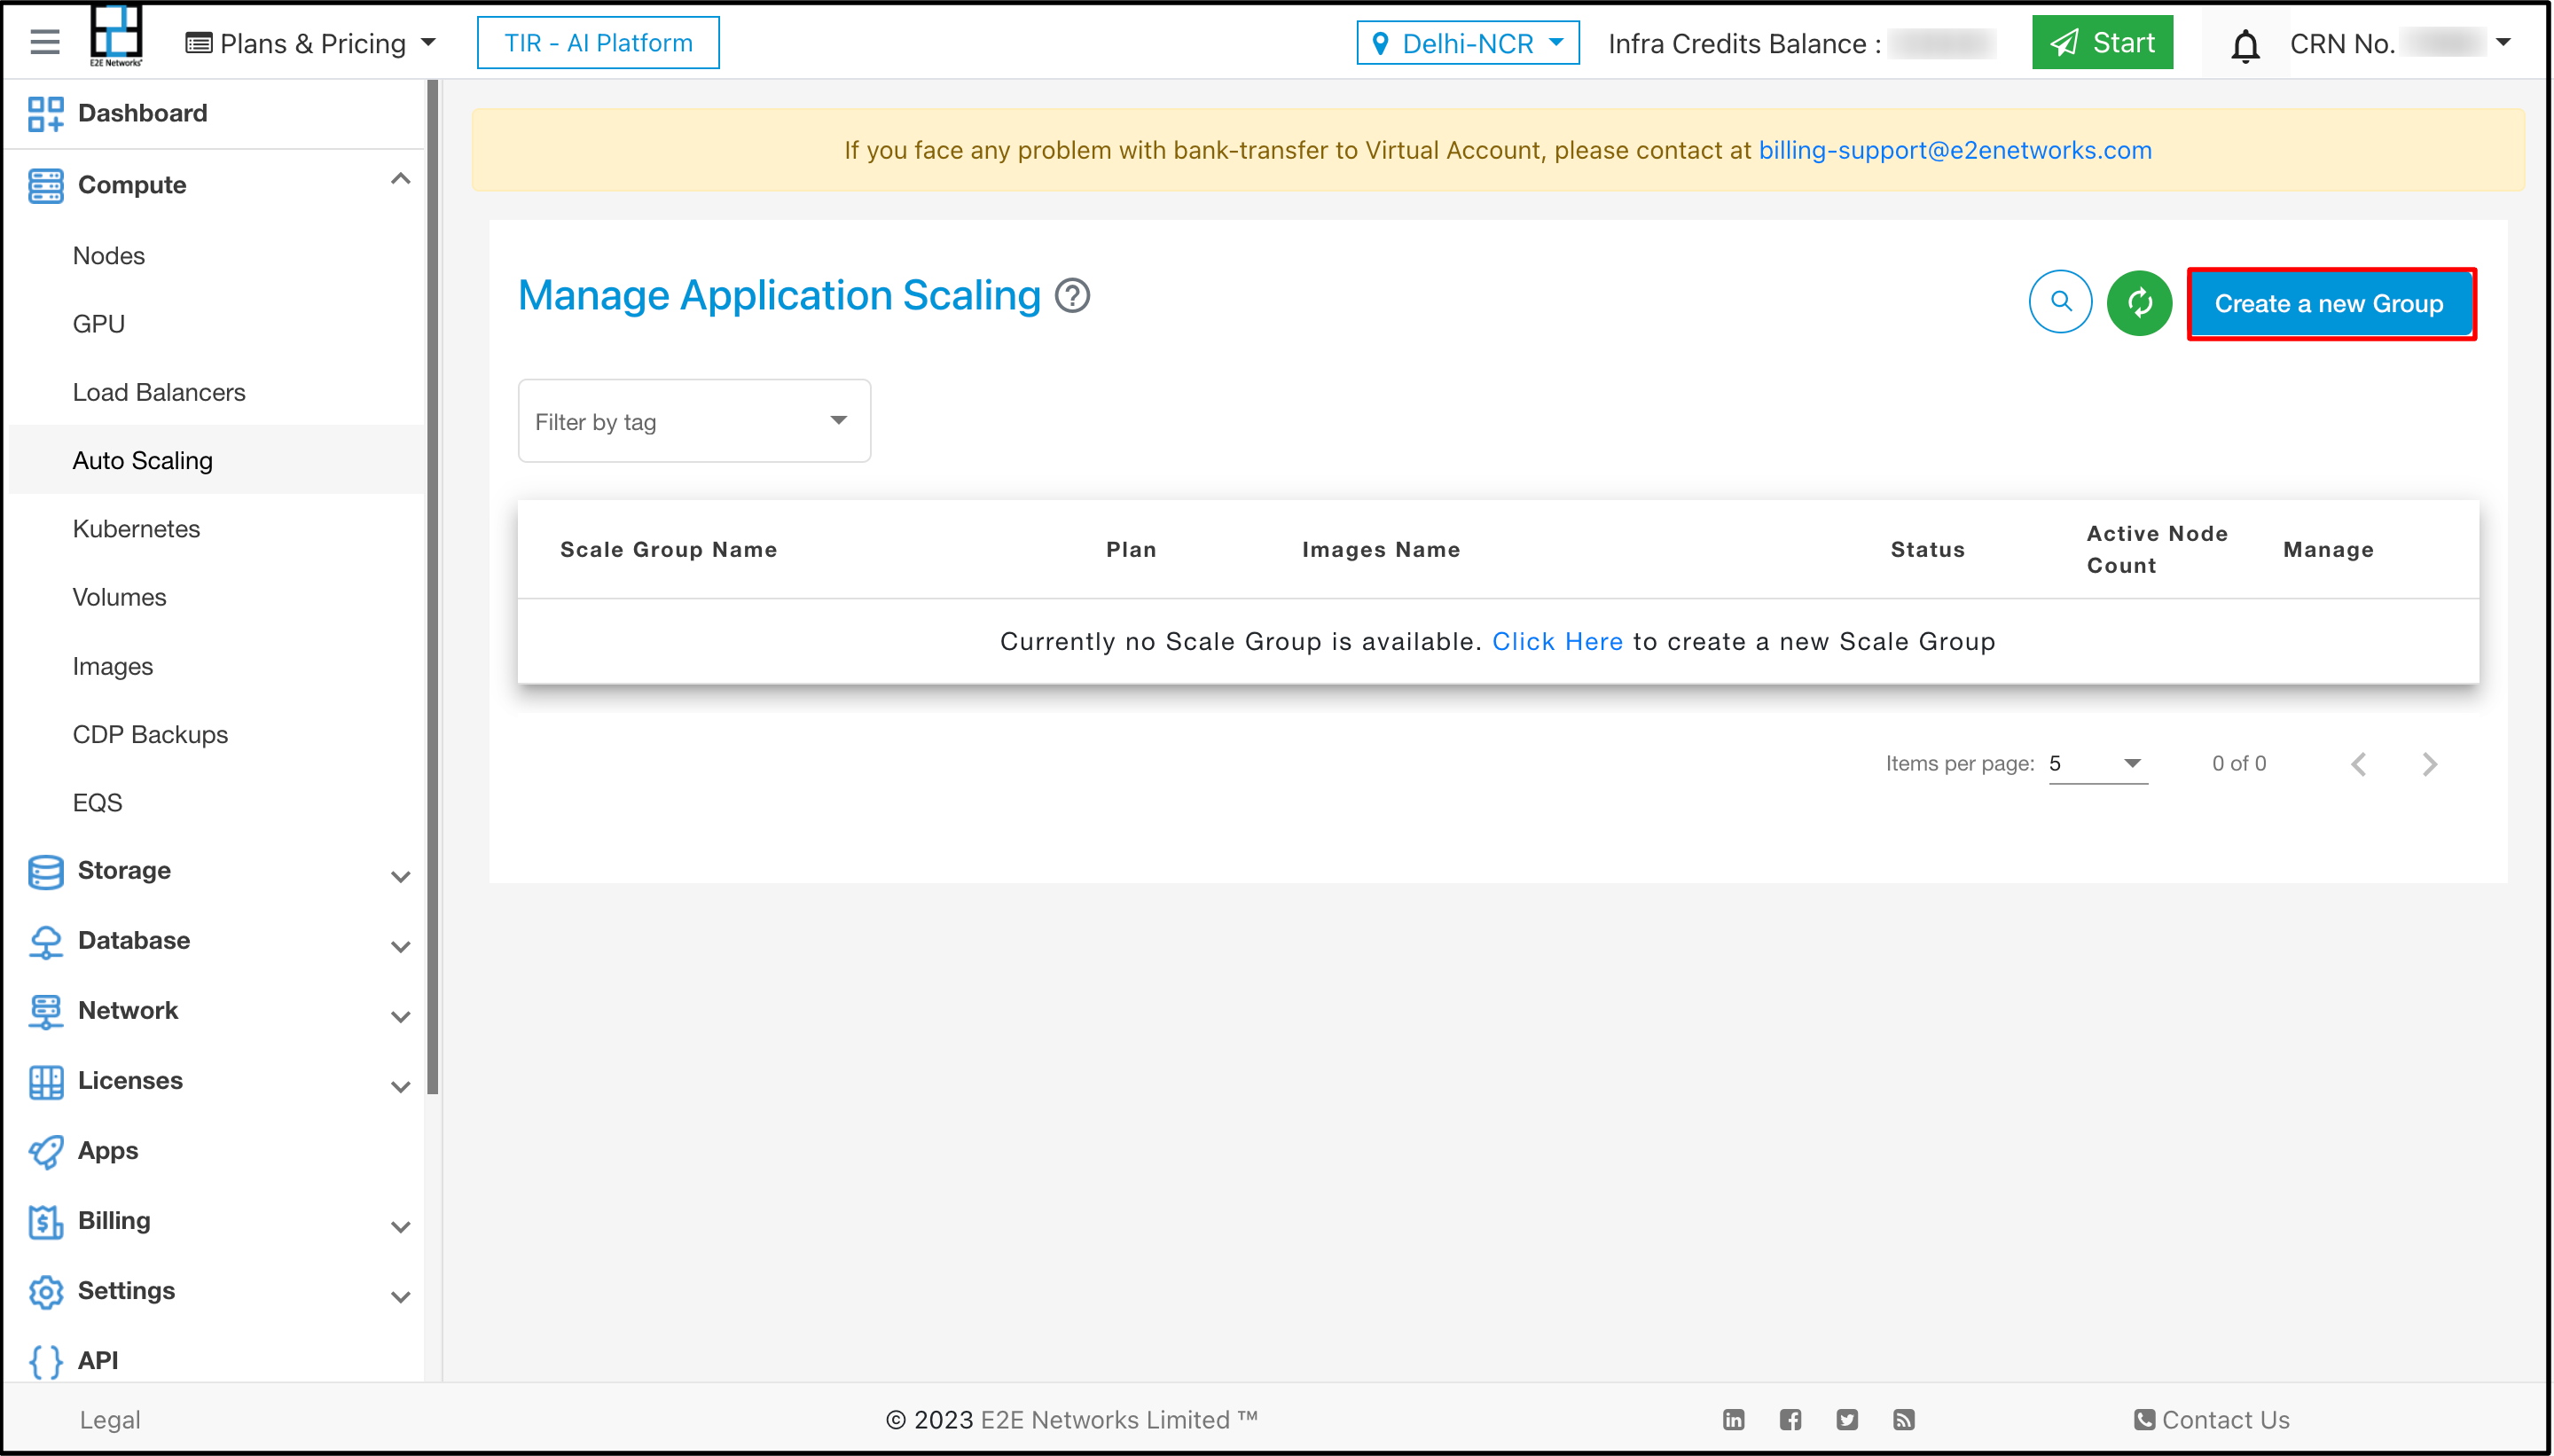
Click on Create a new Group.
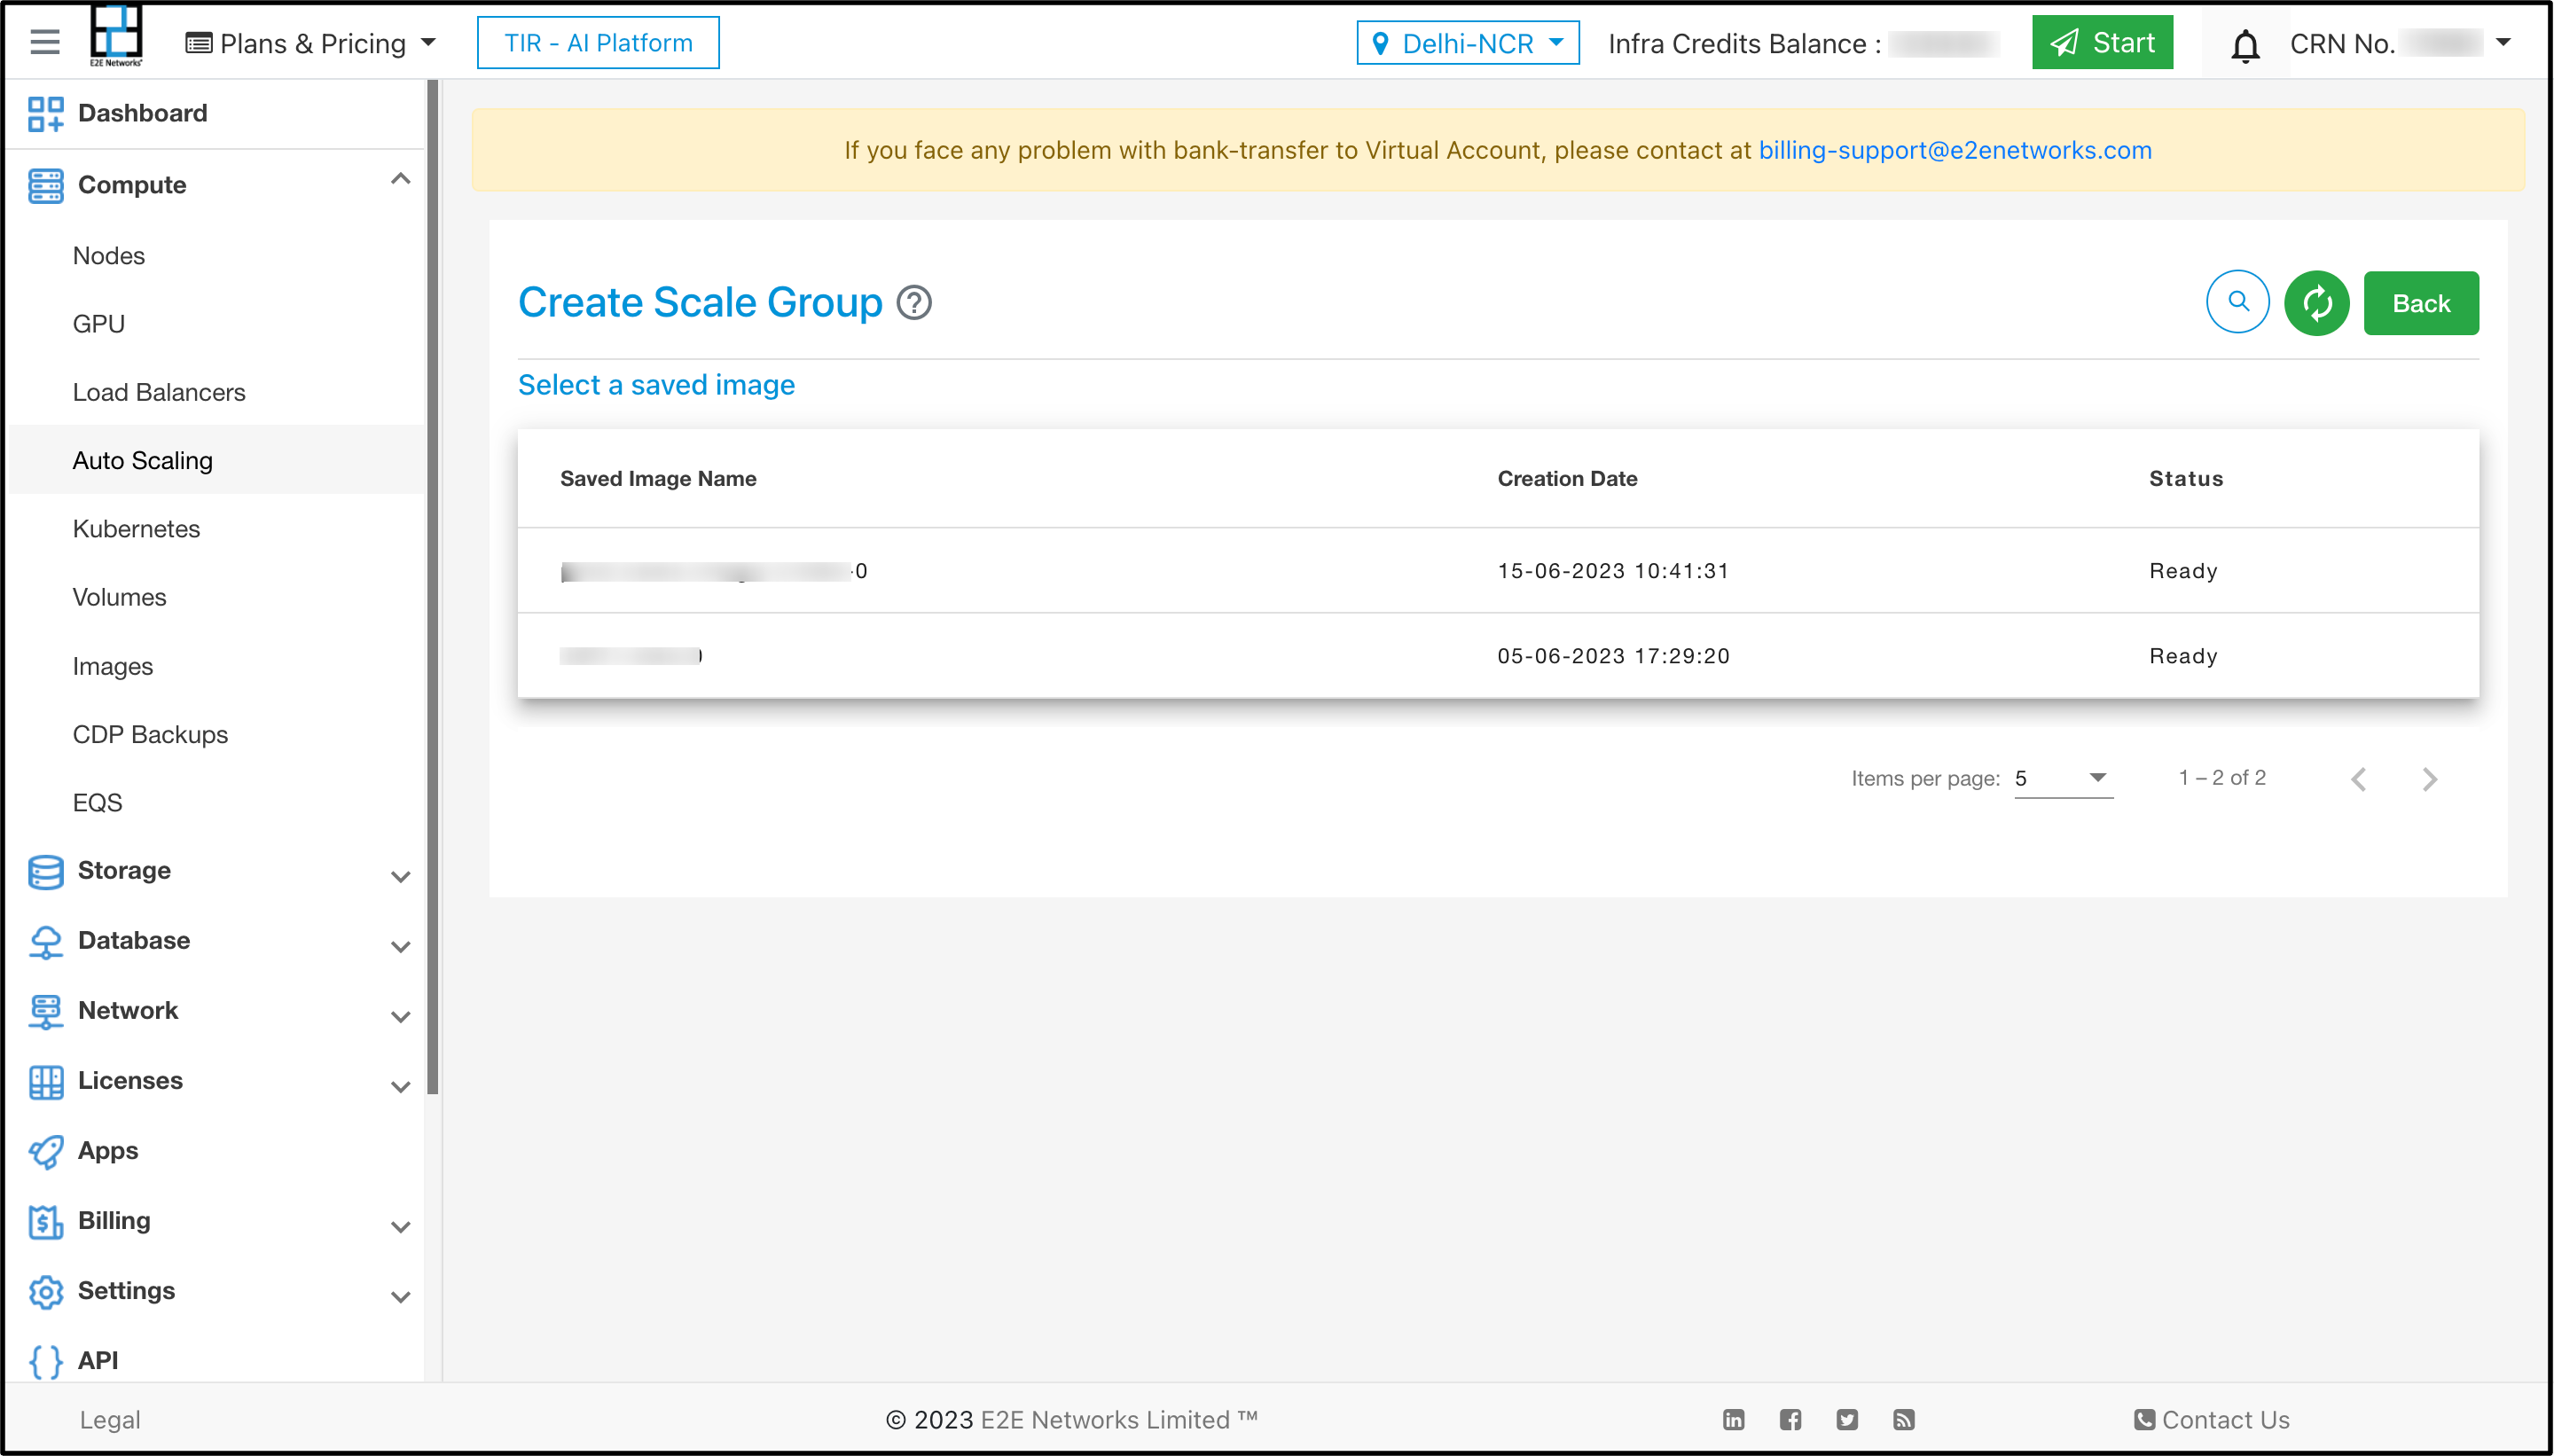
Select a Saved Image that can launch your application at startup
To create a new group click on Create a new Group button
Select the image you want to use to create a new group
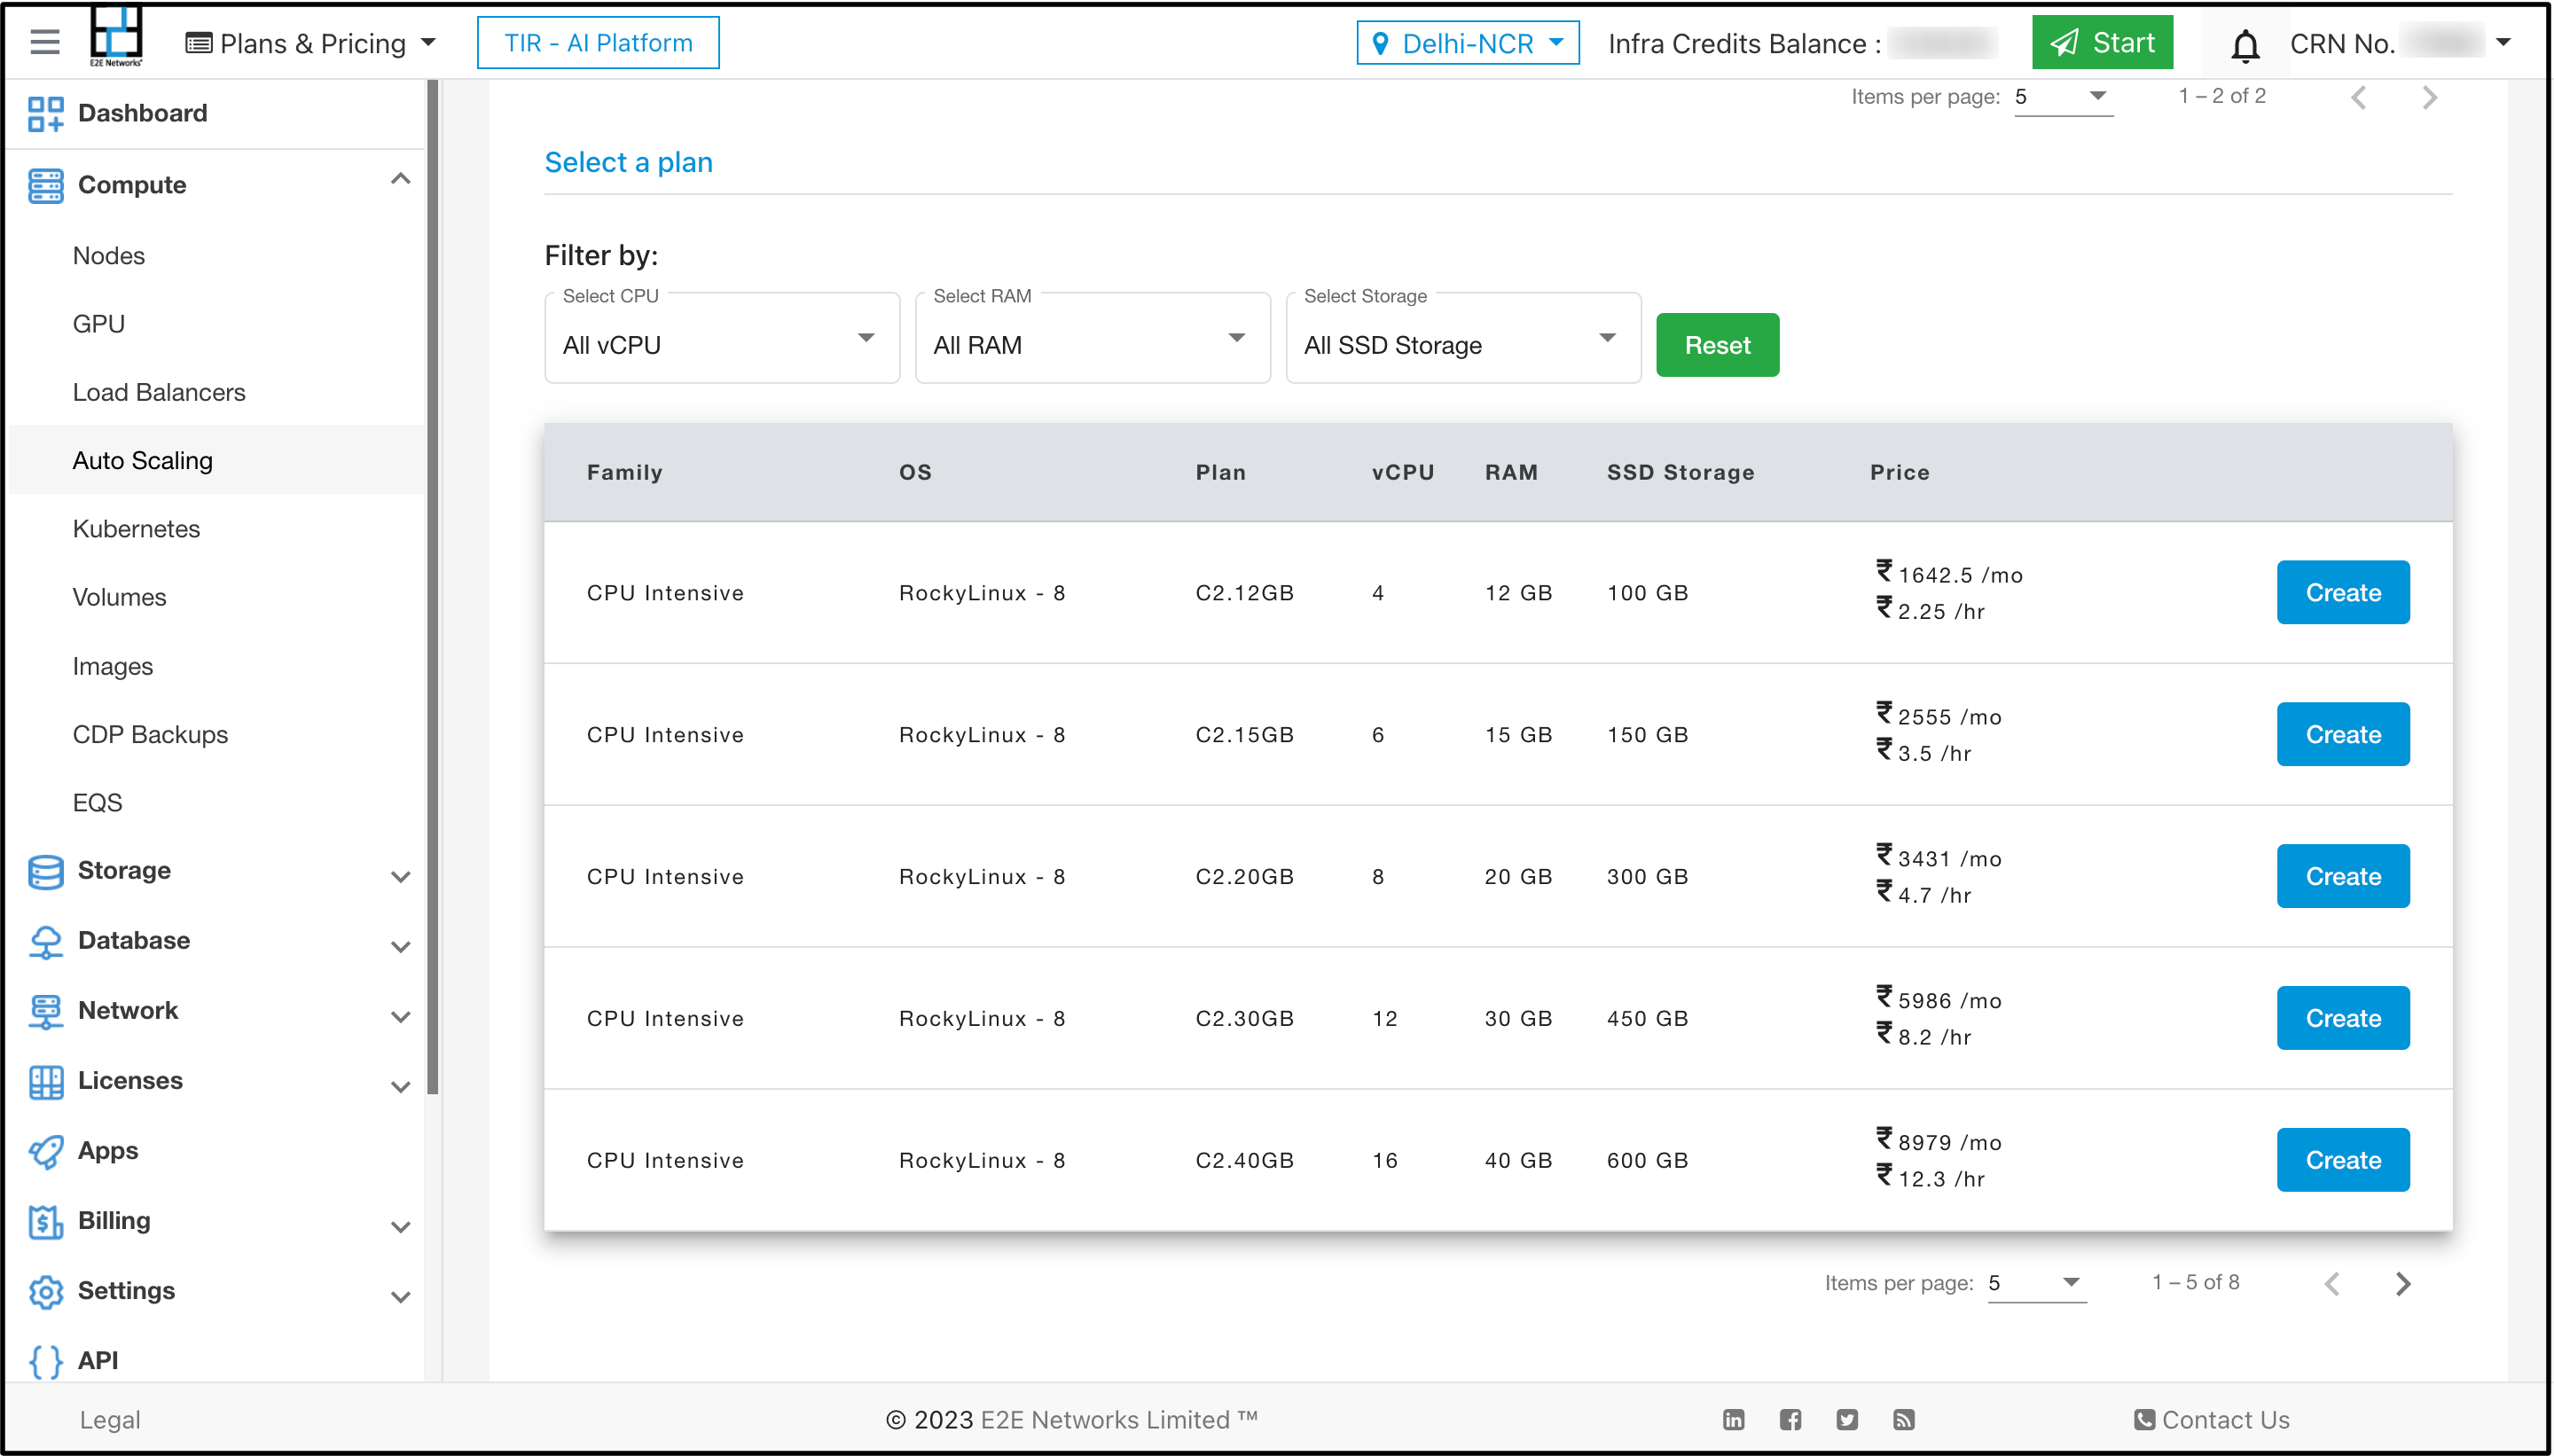
After selecting the image select the plan according to your requirement
Elastic Policy
Elastic policies are designed to ensure that the infrastructure scales up or down automatically based on predefined conditions or metrics. These conditions or metrics can include CPU utilization, network traffic, request latency, or any other relevant performance indicators.
After selecting the plan, give the name of your scale group, select the parameters, and select policy.
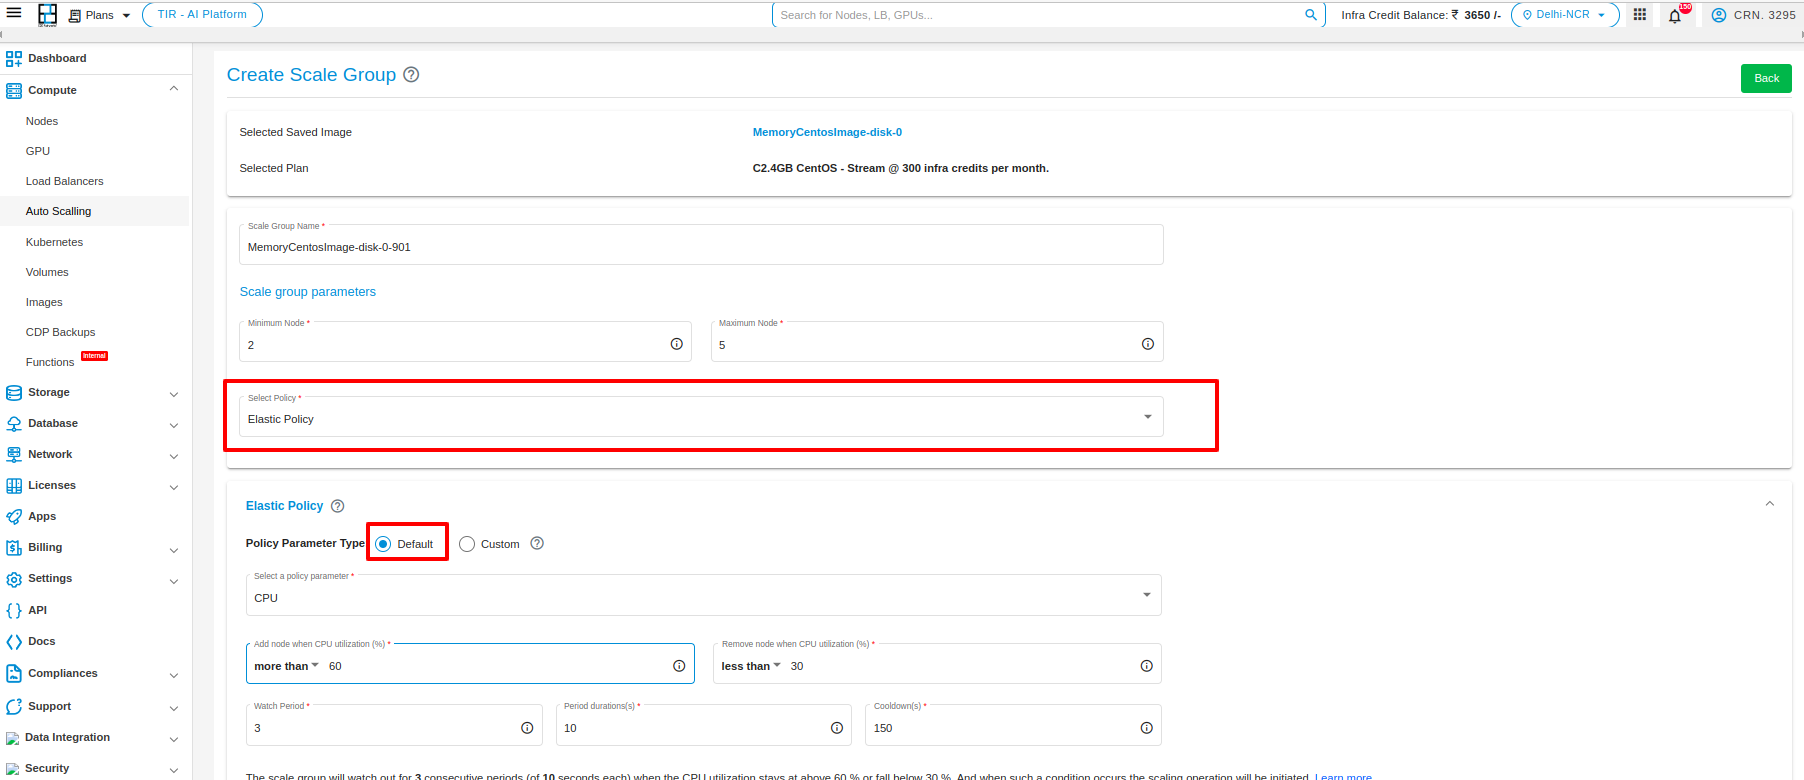
The Elastic Policy allows you to choose between two scaling policies: Default or Custom. If you choose Default, the scaling will be based on CPU or Memory utilization. If you choose Custom, you can specify a custom attribute that will be used to determine the scaling.
Here is a more detailed explanation of the two policies, you have two types of policy parameters. “DEFAULT” and “CUSTOM”
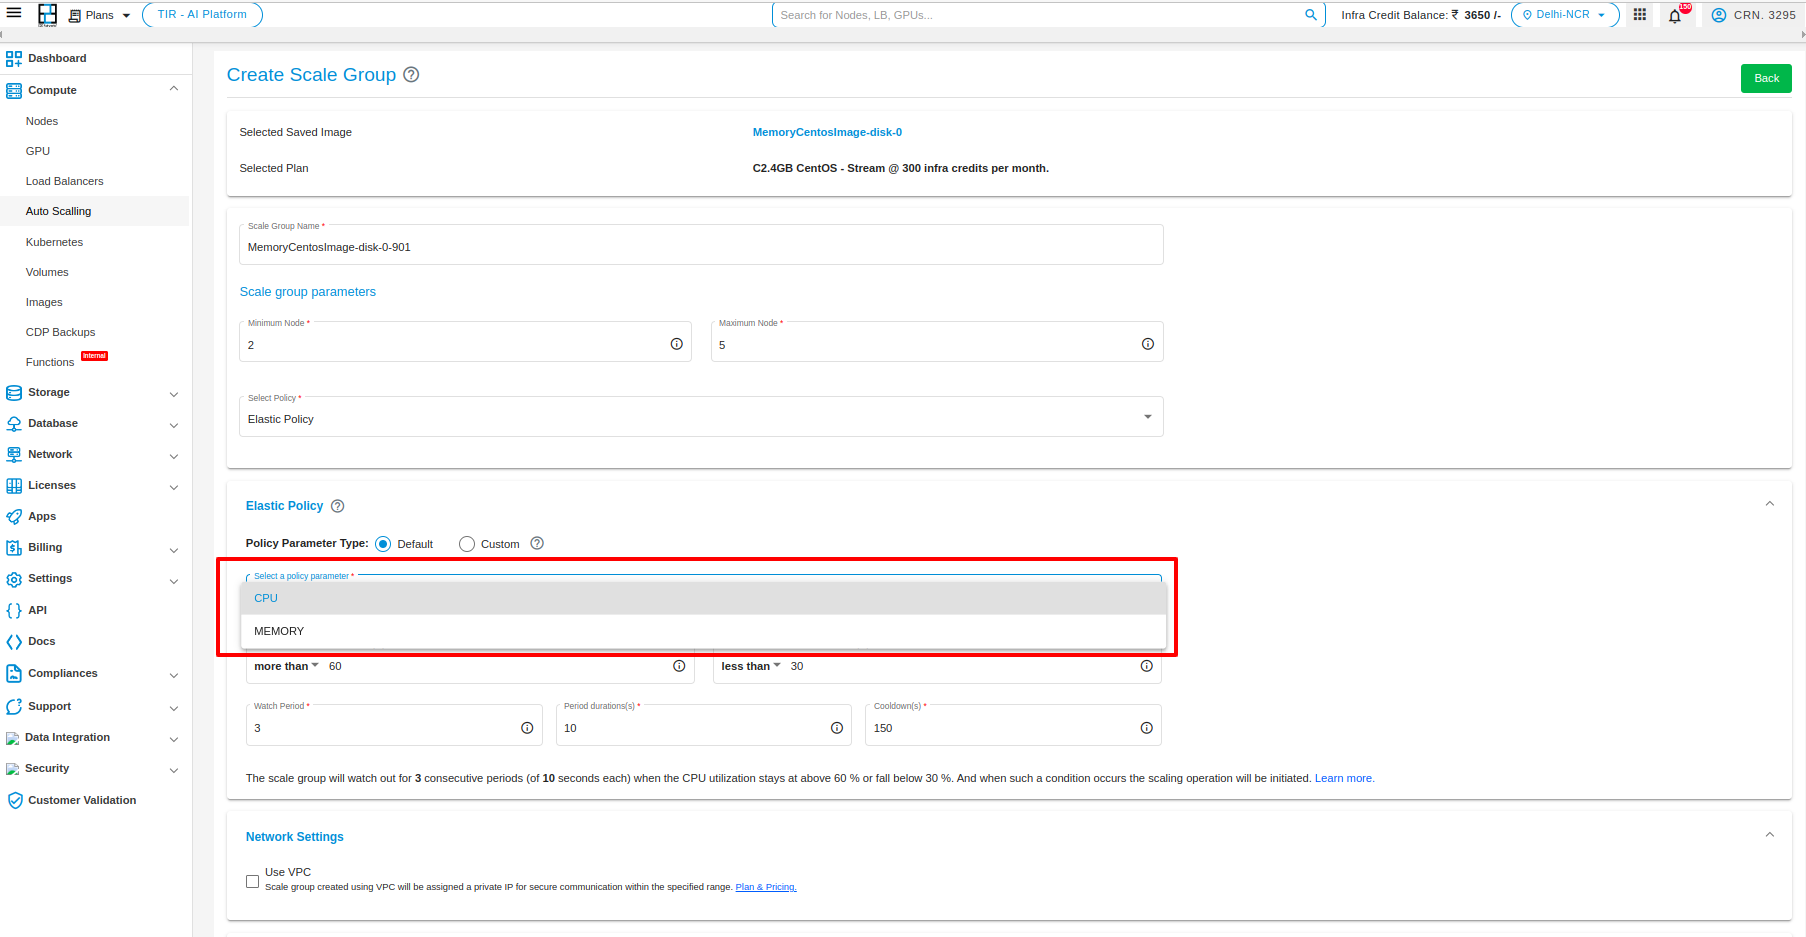
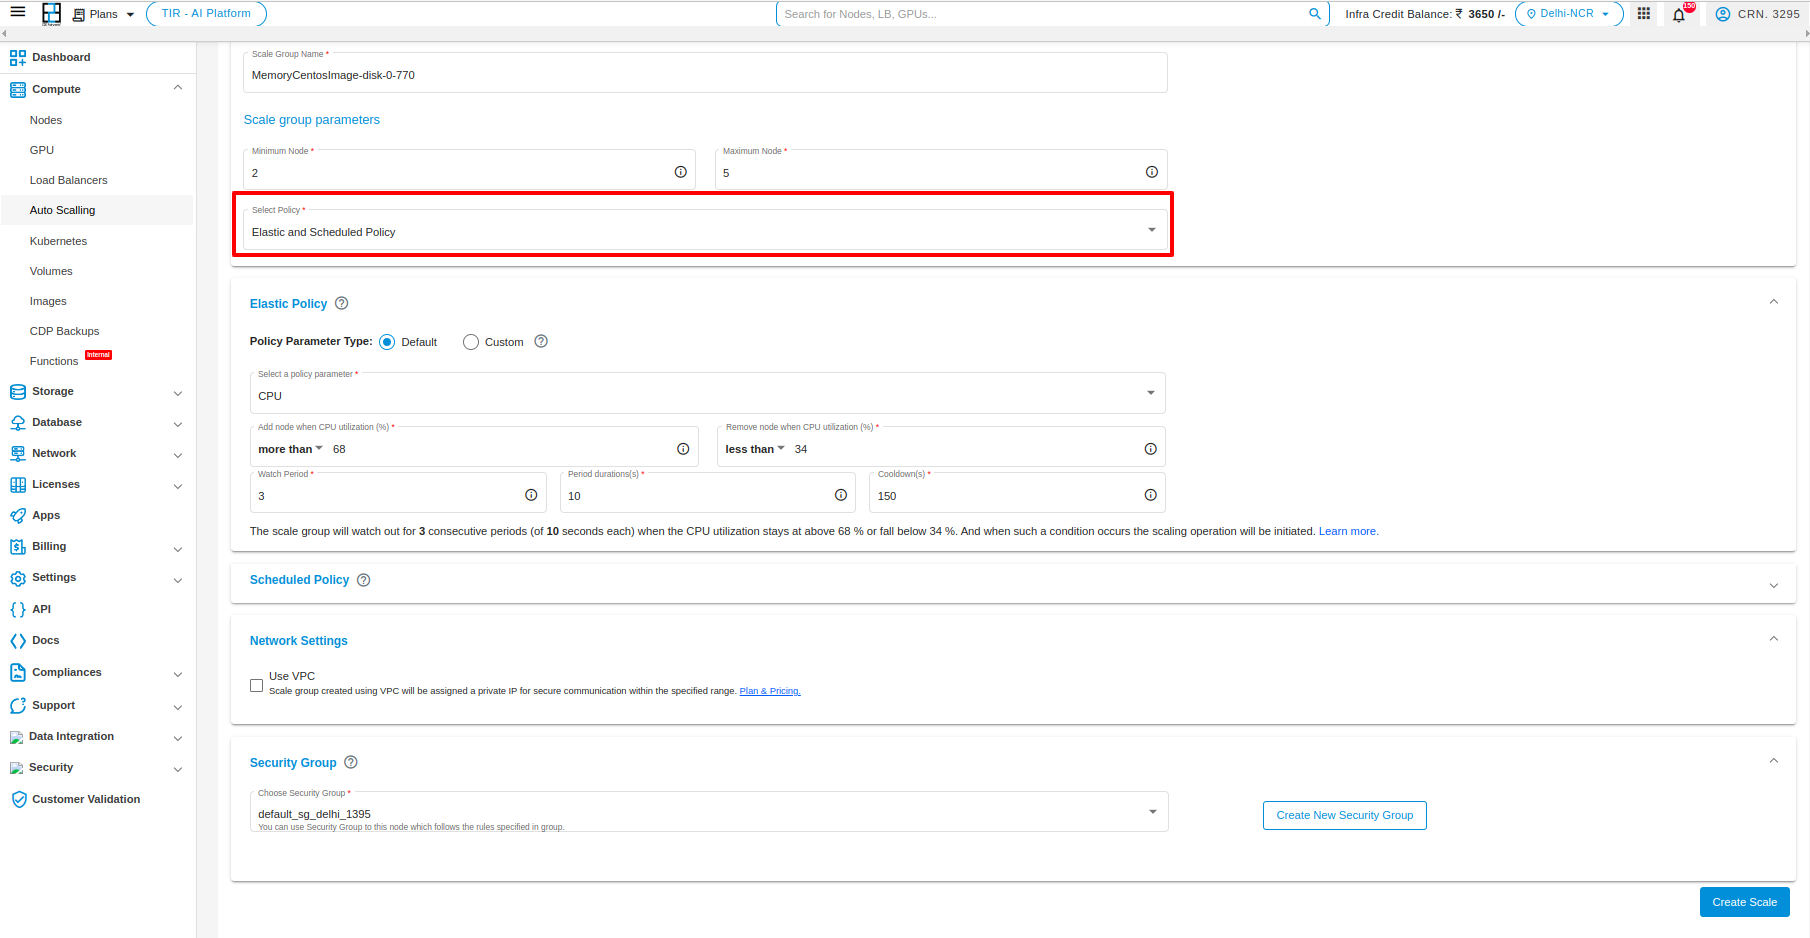
Default In Default, you can select policy parameter type “CPU” or “MEMORY”
CPU: This policy scales the number of resources based on the CPU utilization. When the CPU utilization reaches a certain threshold, the number of resources will be increased according to the policy which you have set. When the CPU utilization decreases, the number of resources will be decreased.
Memory: This policy scales the number of resources based on the Memory utilization. When the Memory utilization reaches a certain threshold, the number of resources will be increased according to the policy which you have set. When the Memory utilization decreases, the number of resources will be decreased.
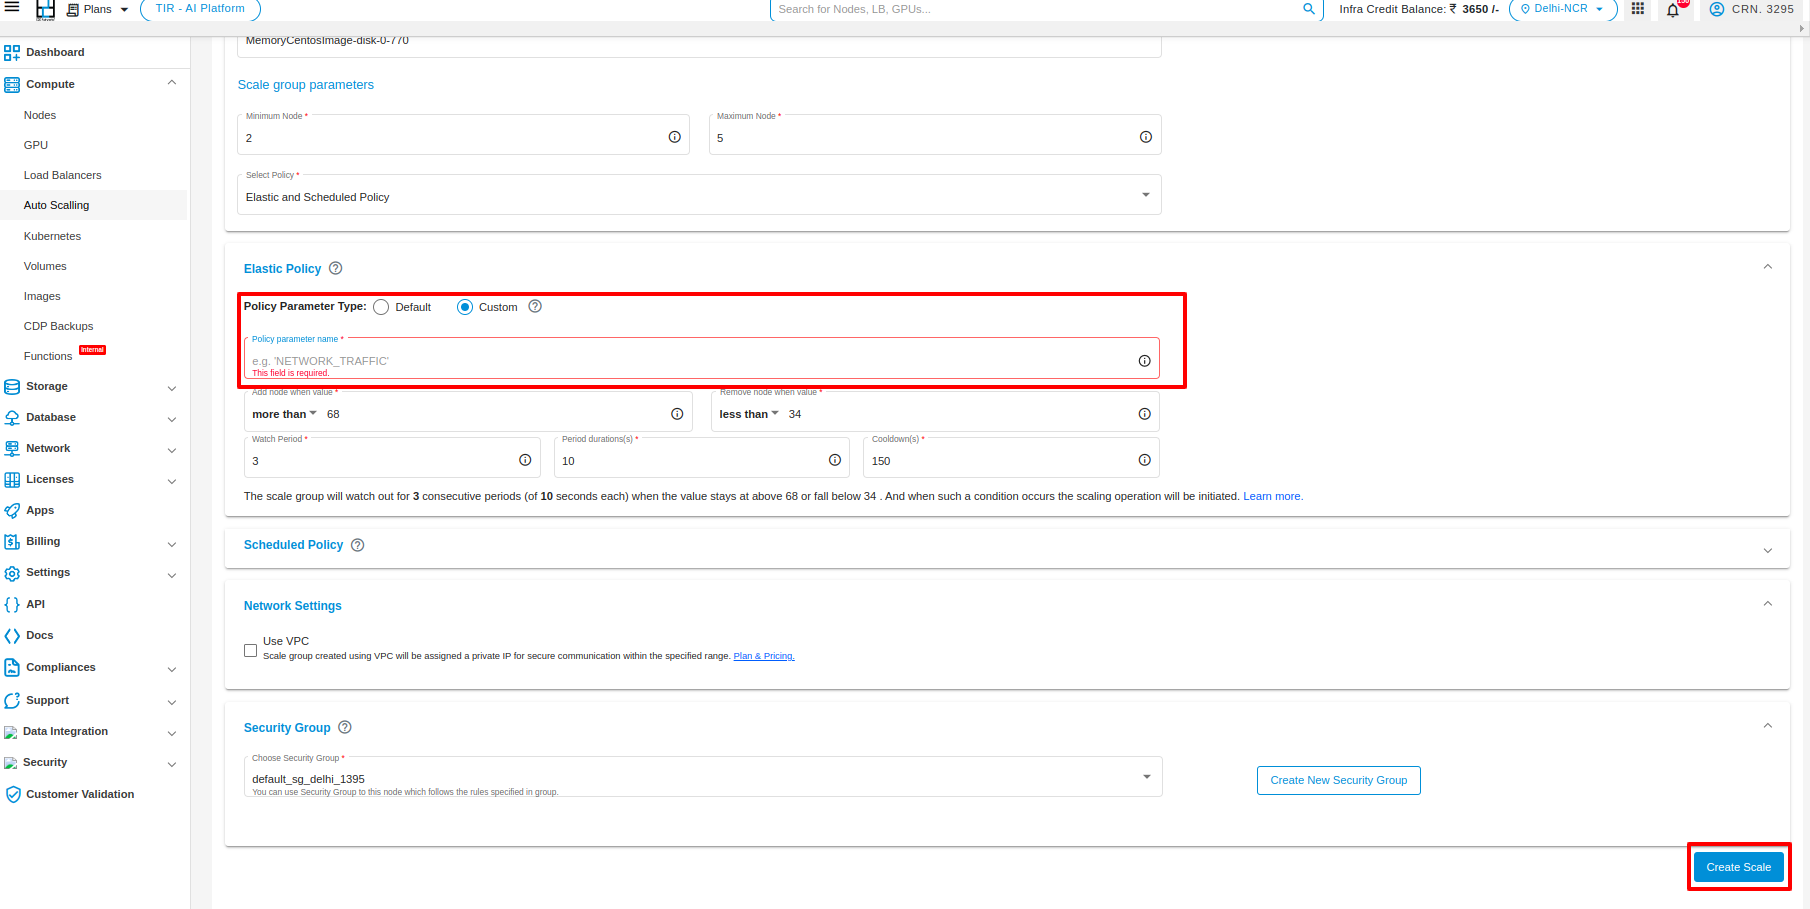
Custom: In a Custom policy, you have two methods to specify a custom attribute.
1. This policy allows you to specify a custom attribute that will be used to determine the scaling. For example, you could specify the memory utilization or the number of requests. When the value of the custom attribute reaches a certain threshold, the number of resources will be increased. When the value of the custom attribute decreases, the number of resources will be decreased.
Note: policy parameter name” field is mendatory.
2. Once an auto-scaling configuration is created with custom parameters, you’ll receive a CURL command for updating the custom parameter value. This command can be used within scripts, hooks, cron jobs, and similar actions. When the value of this custom parameter reaches a specific threshold, the number of resources will increase. Conversely, when the value decreases, the number of resources will decrease.
Note: Please note that the default value of the custom parameter is set to 0.
The choice of which policy to use depends on your specific needs. If you want the scaling to be based on CPU utilization, then the CPU policy is a good choice. If you want the scaling to be based on a custom attribute, then the Custom policy is a good choice.
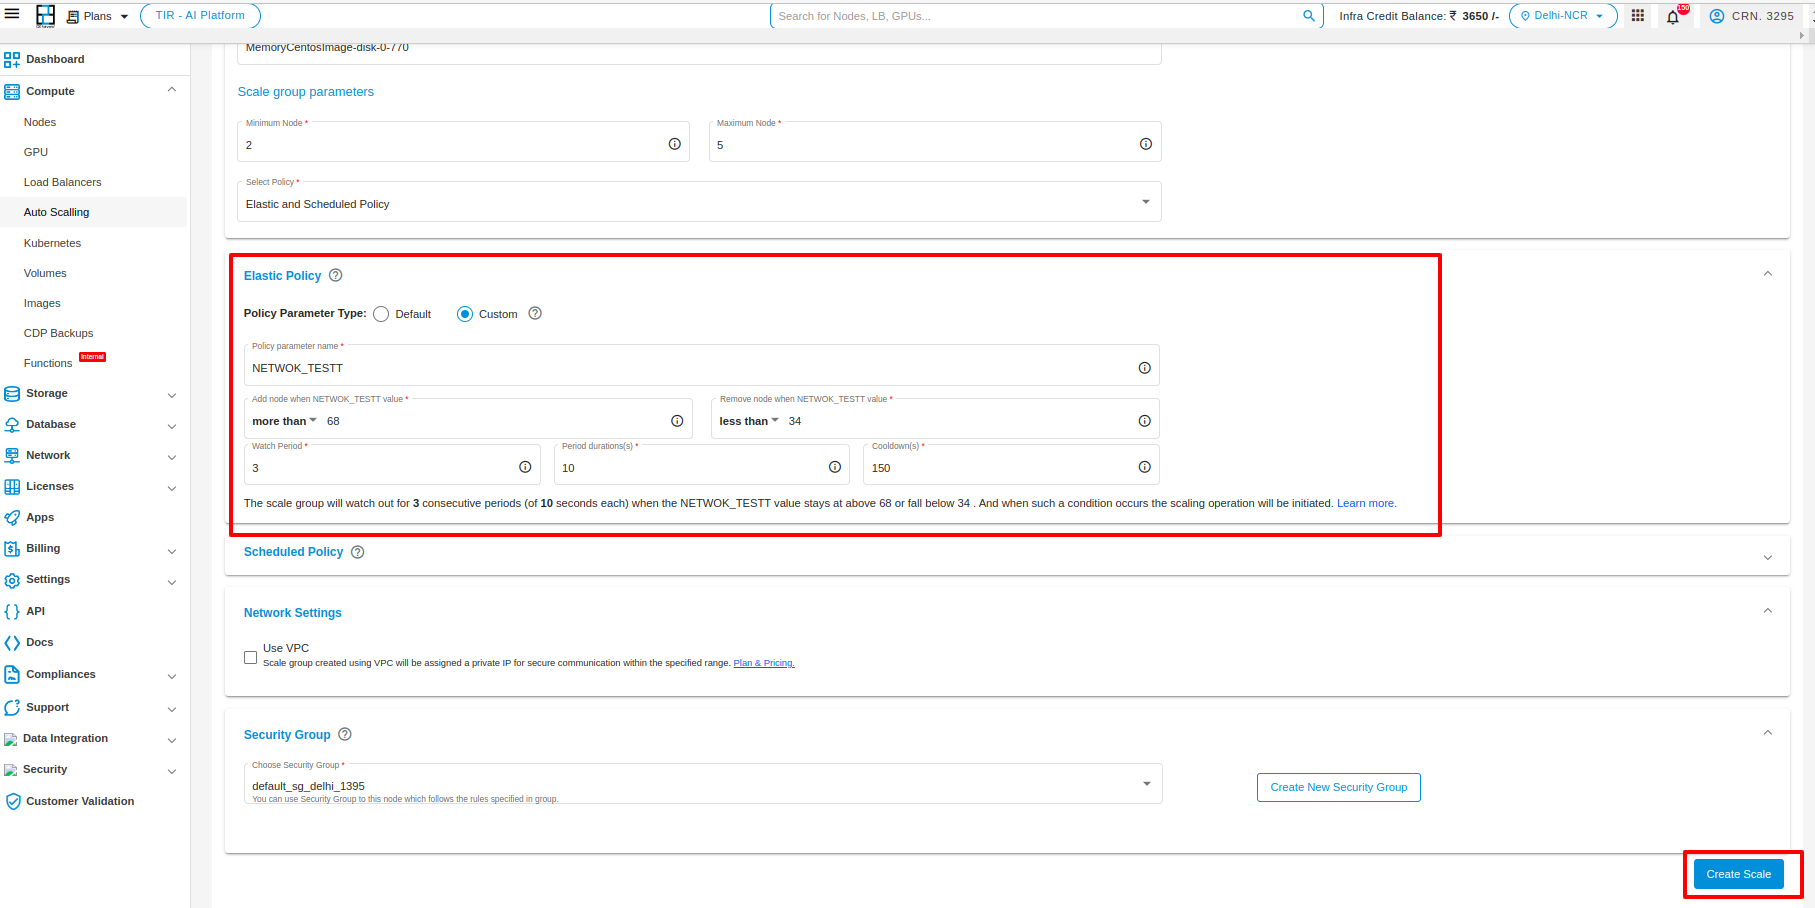
Custom Policy
If you select the custom policy then specify any custom attribute such as memory/diskiops or any other custom policy name.
After selecting the options click on Create Scale button
Manage Custom policy
The custom policy feature in auto scaling enables you to define your own custom attribute. The auto scaling service utilizes this attribute to make scaling decisions. The customer is responsible for setting this value on the service VM. To configure the custom attribute on the VM, the customer should first set up the attribute on an existing VM. Afterward, they need to create a saved image from that VM and use it to create the scaler service.
Note
The custom policy attribute must be configured on the image used to create the Scaler service.
Custom Policy Name:
The Custom Policy Name field is where you enter the name of the custom attribute that you want to use to monitor your service. This attribute can be any name that you choose, but it is helpful to use names that are descriptive of the aspect of your service that you are monitoring. For example, you could use the names “MEMORY” for memory usage, “NETTX” for Network traffic, “DISKWRIOPS” for disk write operations etc.
Node utilization section:
Specify the values that will trigger a scale-up (increase in cardinality) or scale-down (decrease in cardinality) operation based on your preferences.
Scaling Period Policy:
You need to define the watch period, duration of each period, and cooldown period.
Note
If your custom policy names are MEMORY, NETTX, NETRX, DISKWRIOPS, DISKRDIOPS, DISKWRBYTES, or DISKWRIOPS, you do not need to worry about anything else. However, if you wish to adjust the cardinality of your auto-scaling service based on different attributes, you must configure them through your node. Scaling (incrementing and decrementing) occurs based on the average value of the custom policy attribute.
To set custom attributes on service nodes, follow these steps:
Create a new node.
Establish an SSH connection to that node.
Add the script provided below to your node and may set up a cron job for it.
Let us assume that you have set Custom policy name as “CUSTOM_ATT,” and max utilization is set at 60 units and minimum utilization is set at 30 units, then the cardinality will get increase when the value of the CUSTOM_ATT goes more than 60 units and the cardinality will get decrease, if the value of the CUSTOM_ATT falls below 30 units:
If your goal is to adjust the cardinality based on the percentage of memory utilization, you need to assign the CUSTOM_ATT attribute to the node. This attribute will monitor memory utilization through the script. To achieve this, create a cron job that monitors memory utilization and updates the attribute periodically.
When writing the script, you’ll need to obtain the following information: ONEGATE_ENDPOINT, TOKENTXT, and VMID.
You can find these details at the following location:
/var/run/one-context/one_env.
To create the script in a .sh file, follow these steps:
Create or update the file with the desired file name like (file_name.sh).
Inside the script file file_name.sh, you can begin writing your script.
Now you have two options to write a script inside the file file_name.sh either use the option1 or option 2 to write a script.
Option1
TMP_DIR=`mktemp -d`
  echo "" > $TMP_DIR/metrics

  MEM_TOTAL=`grep MemTotal: /proc/meminfo | awk '{print $2}'`
  MEM_FREE=`grep MemFree: /proc/meminfo | awk '{print $2}'`
  MEM_USED=$(($MEM_TOTAL-$MEM_FREE))
  MEM_USED_PERC="0"

  if ! [ -z $MEM_TOTAL ] && [ $MEM_TOTAL -gt 0 ]; then
      MEM_USED_PERC=`echo "$MEM_USED $MEM_TOTAL" | \
          awk '{ printf "%.2f", 100 * $1 / $2 }'`
  fi

  CUSTOM_ATTR=$MEM_USED_PERC

  echo "CUSTOM_ATTR = $CUSTOM_ATTR" >> $TMP_DIR/metrics

  VMID=$(source /var/run/one-context/one_env; echo $VMID)

  ONEGATE_ENDPOINT=$(source /var/run/one-context/one_env; echo $ONEGATE_ENDPOINT)

  ONEGATE_TOKEN=$(source /var/run/one-context/one_env; echo $TOKENTXT)

  curl -X "PUT" $ONEGATE_ENDPOINT/vm \
      --header "X-ONEGATE-TOKEN: $ONEGATE_TOKEN" \
      --header "X-ONEGATE-VMID: $VMID" \
      --data-binary @$TMP_DIR/metrics
Option2
MEM_TOTAL=`grep MemTotal: /proc/meminfo | awk '{print $2}'`
 MEM_FREE=`grep MemFree: /proc/meminfo | awk '{print $2}'`
 MEM_USED=$(($MEM_TOTAL-$MEM_FREE))
 MEM_USED_PERC="0"

  if ! [ -z $MEM_TOTAL ] && [ $MEM_TOTAL -gt 0 ]; then
      MEM_USED_PERC=`echo "$MEM_USED $MEM_TOTAL" | \
          awk '{ printf "%.2f", 100 * $1 / $2 }'`
  fi

  VMID=$(source  /var/run/one-context/one_env; echo $VMID)

  onegate vm update $VMID --data CUSTOM_ATTR=$MEM_USED_PERC
Now To make the (file_name.sh) file executable, execute the following command:
chmod +x file_name.sh
To run the file_name.sh script, use the following command:
./file_name.sh":
This will execute the script and perform its intended actions.
But for continuous monitoring of your attribute there is a need to make a cron of your script. So for this in the terminal execute :
crontab -e
You will be prompted to specify a file where you need to provide the scheduled time for the cron job and the location of the script.
Example:
* * * * * /path/to/your/file_name.sh (/root/file_name.sh)
Afterward, create an image of that node.
Launch your auto scale group using a custom policy name (make sure to use the same name during configuration).
This setup will monitor the percentage of memory utilization and store it in the specified custom attribute (CUSTOM_ATTR). Based on the values which you have provided for cardinality increment and decrement, your scheduled actions will be performed.
Note
Upscaling and downscaling will be determined based on the average attribute value across all launched nodes.
To see the set attributes you can use given blow command -
$ onegate vm show VMID --json
After run above command the detail will be shown like this:-
{
  "VM": {
    "NAME": "machine_name",
    "ID": "machine_id",
    "STATE": "machine_state",
    "LCM_STATE": "machine_lcm_state",
    "USER_TEMPLATE": {
      "CUSTOM_ATTR": "set_attribute",
      "DISTRO": "distro",
      "HOT_RESIZE": {
        "CPU_HOT_ADD_ENABLED": "NO",
        "MEMORY_HOT_ADD_ENABLED": "NO"
      },
      "HYPERVISOR": "kvm",
      "INPUTS_ORDER": "",
      "LOGO": "images/logos/centos.png",
      "LXD_SECURITY_PRIVILEGED": "true",
      "MEMORY_UNIT_COST": "MB",
      "MY_ACCOUNT_DISPLAY_CATEGORY": "Linux Virtual Node",
      "OS_TYPE": "CentOS-7.5",
      "SAVED_TEMPLATE_ID": "0",
      "SCHED_DS_REQUIREMENTS": "ID=\"0\"",
      "SCHED_REQUIREMENTS": "ID=\"10\" | ID=\"11\"",
      "SKU_TYPE": "sku_type",
      "TYPE": "Distro"
    },
    "TEMPLATE": {
      "NIC": [
        {
          "IP": "ip_add",
          "MAC": "mac_add",
          "NAME": "nic_name",
          "NETWORK": "your_network"
        }
      ],
      "NIC_ALIAS": [
      ]
    }
  }
}
To see the VMID, you can use given blow command -
$ onegate vm show
Output will be like this:
VM 8
NAME              : web_0_(service_1)
STATE             : RUNNING
IP                : 192.168.122.23
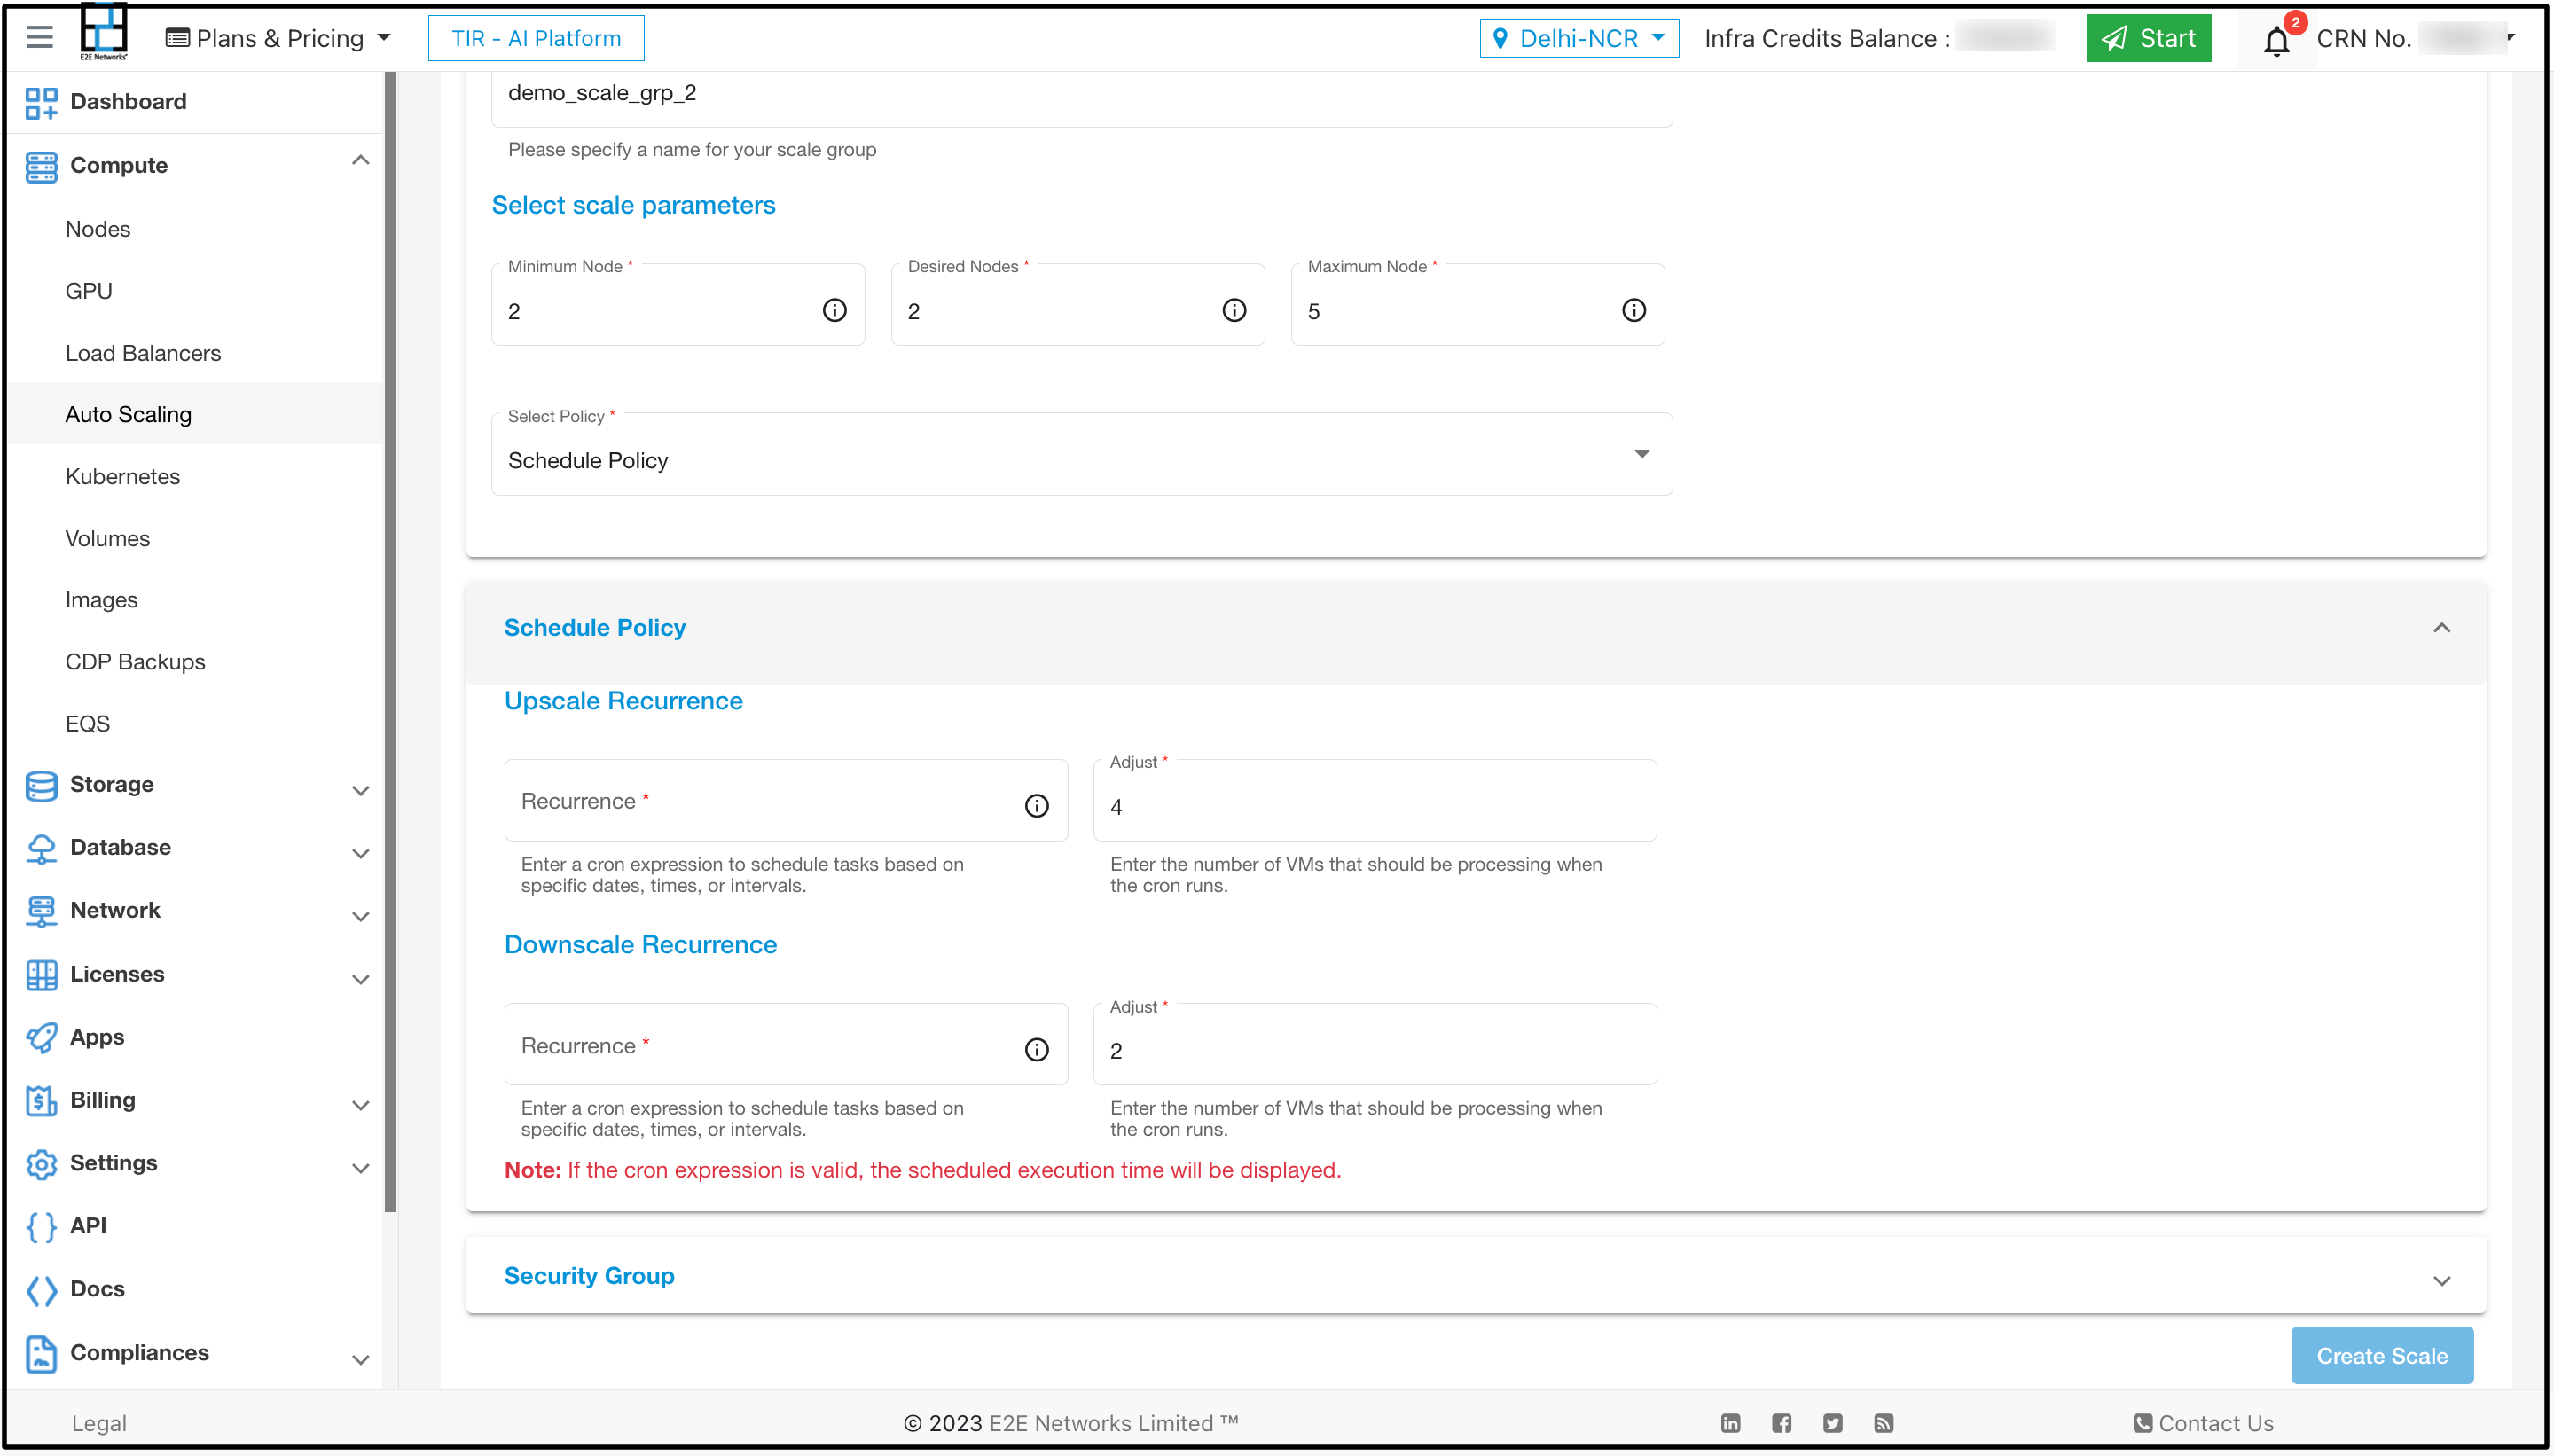
Schedule Policy
Schedule Policy - Autoscaling schedule policy is a feature that allows you to define a predetermined schedule for automatically adjusting the capacity of your resources. A scheduled autoscaling policy is a type of scaling policy that allows you to scale your resources based on a defined schedule. For example, you may use a scheduled autoscaling policy to increase the number of instances in your service during peak traffic hours and then decrease the number of instances during off-peak hours.
Recurrence - In auto scaling, recurrence refers to the ability to schedule scaling actions to occur on a recurring basis. This can be useful for applications that experience predictable traffic patterns, such as a website that receives more traffic on weekends or a web application that receives more traffic during peak business hours.
Upscale and downscale recurrence in auto scaling refers to the process of increasing and decreasing the number of resources in an Auto Scaling group, respectively. This can be done on a recurring basis, such as every day, week, or month.
Cron - To configure recurrence in auto scaling, you need to specify a cron expression. A cron expression is a string that specifies the time and frequency of the scaling action. For example, the cron expression 0 0 * * * specifies that the scaling action should be run at 00:00 (midnight) every day.
Upscale recurrence: You can specify the cardinality of nodes at a specific time by adjusting the field in the cron settings. Ensure that the value is lower than the maximum number of nodes you had previously set.
Downscale recurrence: You can specify the cardinality of nodes at a specific time by adjusting the field in the cron settings. Ensure that the value is greater than the maximum number of nodes you had previously set.
Now if you want to choose scheduled policy as your choice of option then select Schedule Policy in place of Elastic Policy and then set the upscale and downscale recurrence and click on Create Scale button
Elastic and Scheduled Policy
If the user desires to create a scaler service using both options, they can choose the “Both” policy option, configure the parameters, and proceed with creating the scalar service.
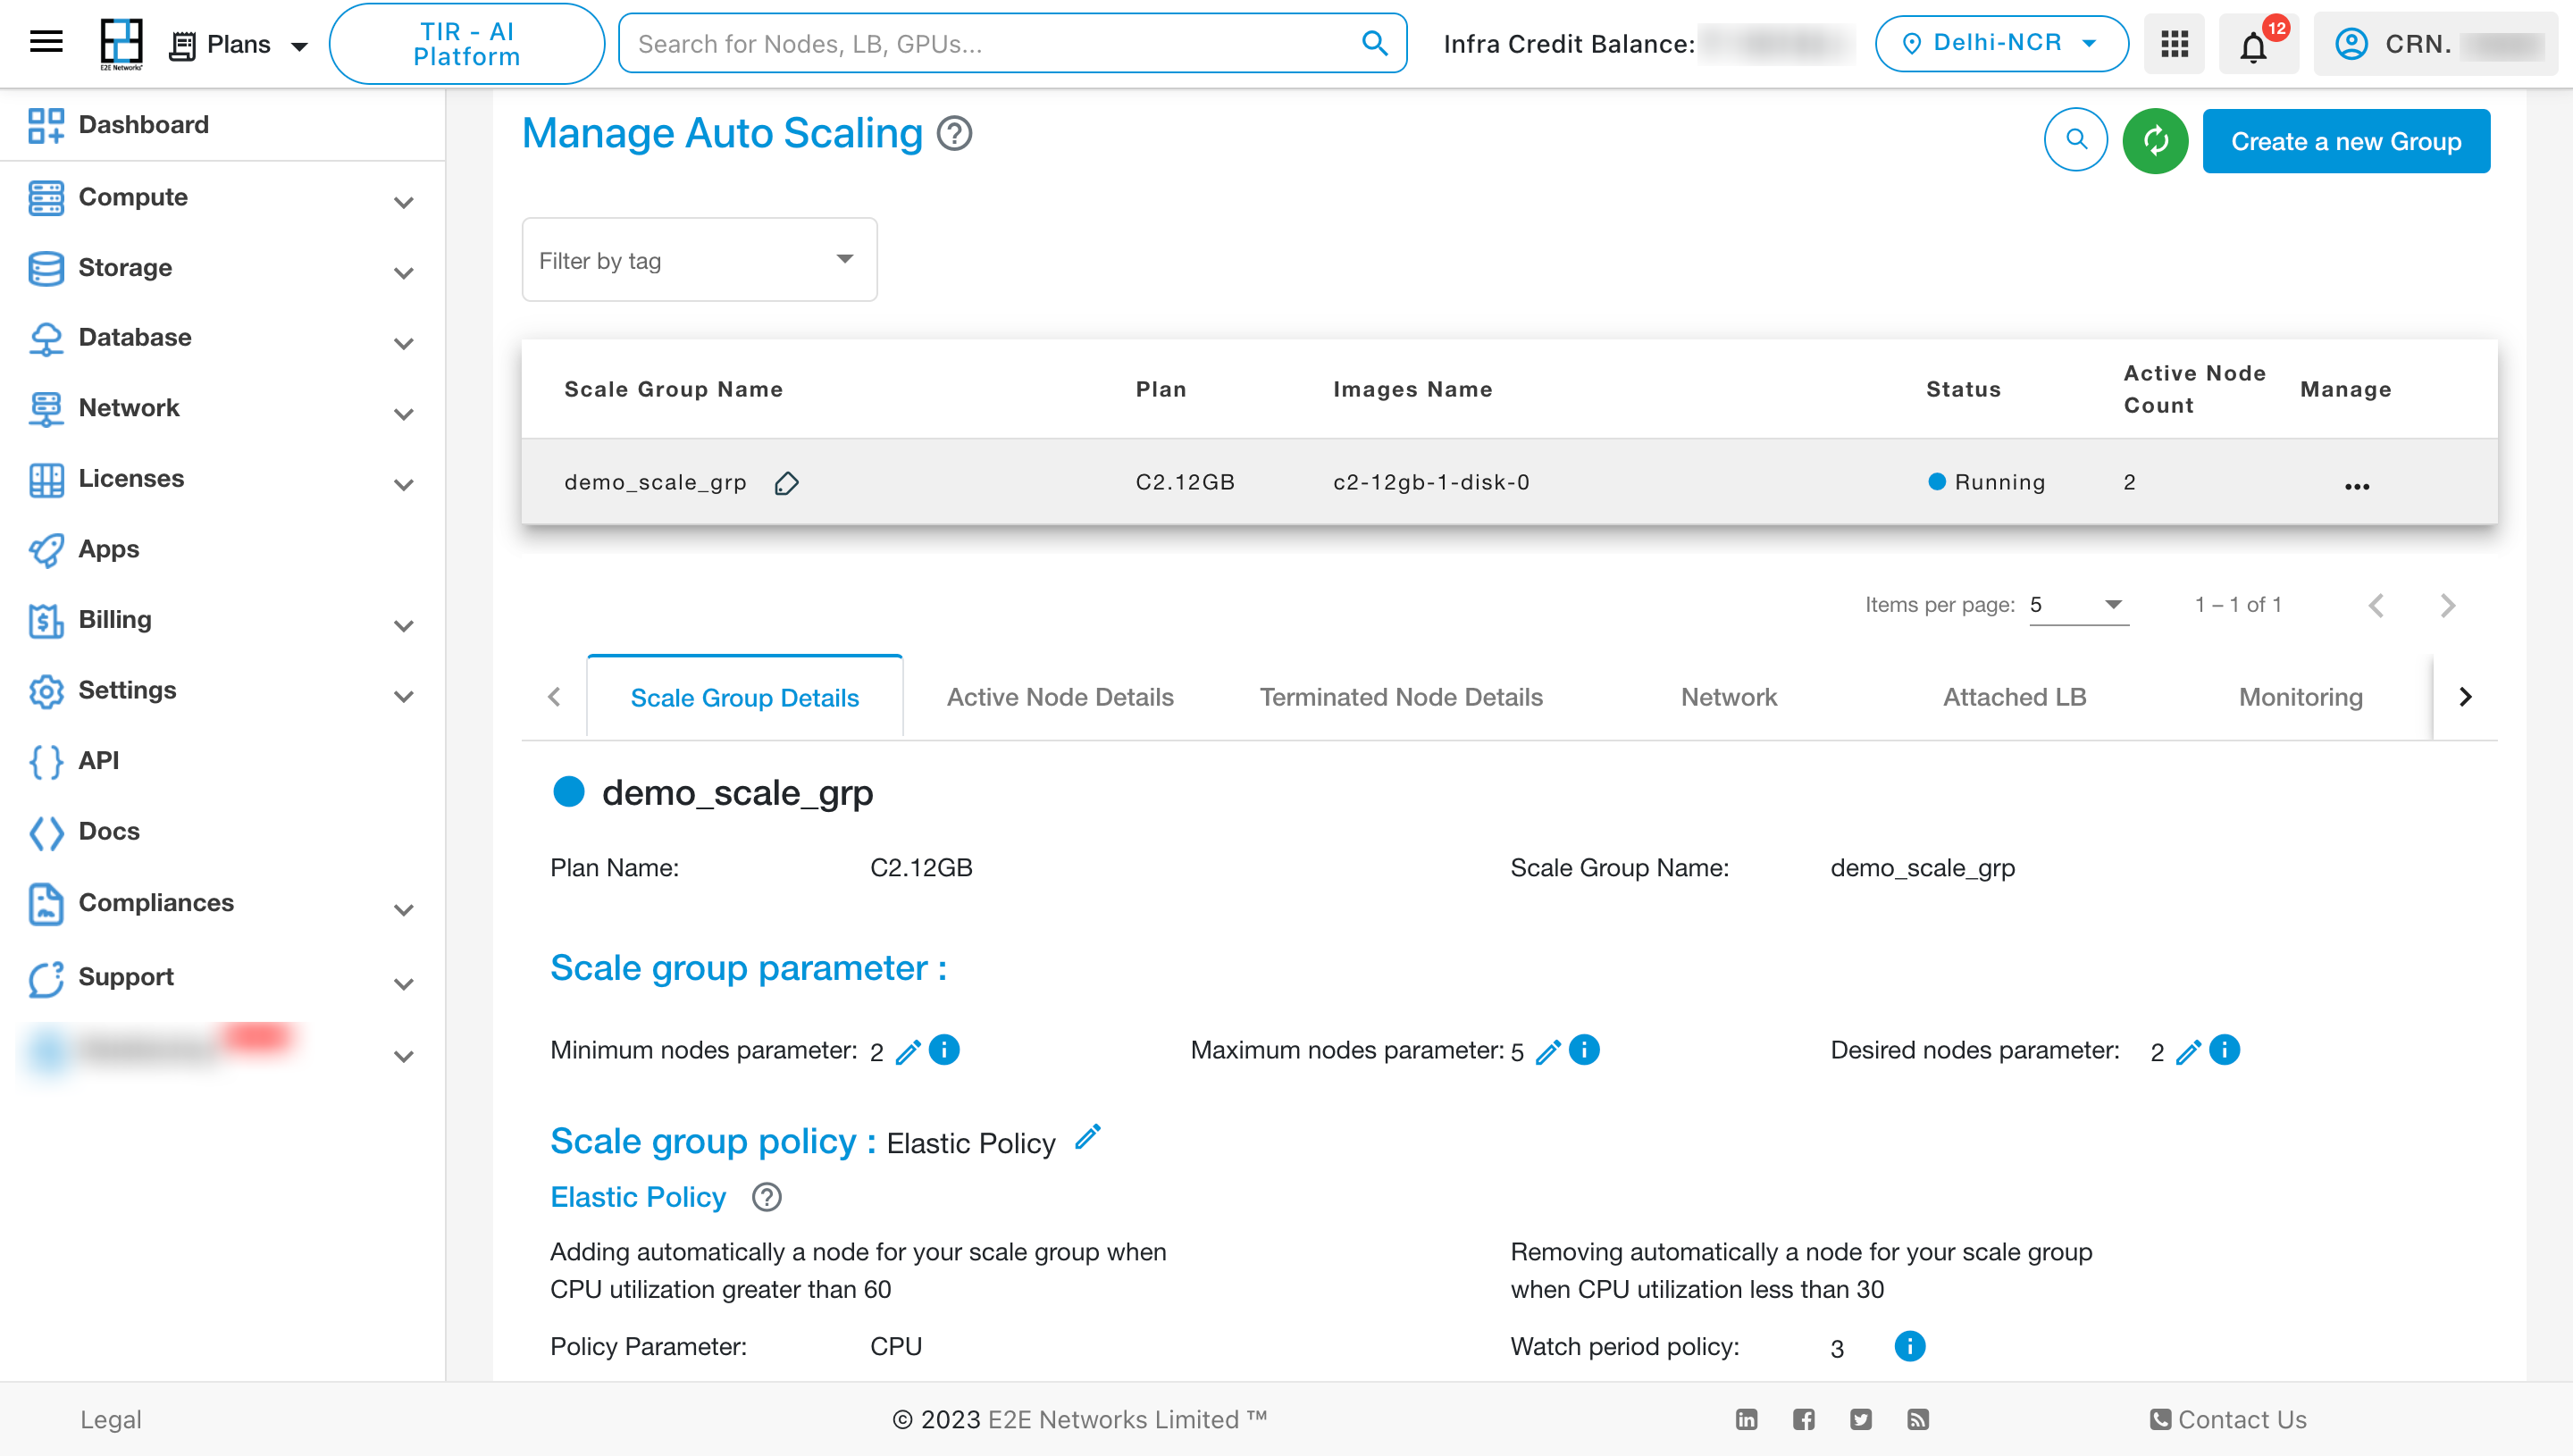
To see the details of the scale group click on Scale Group Details
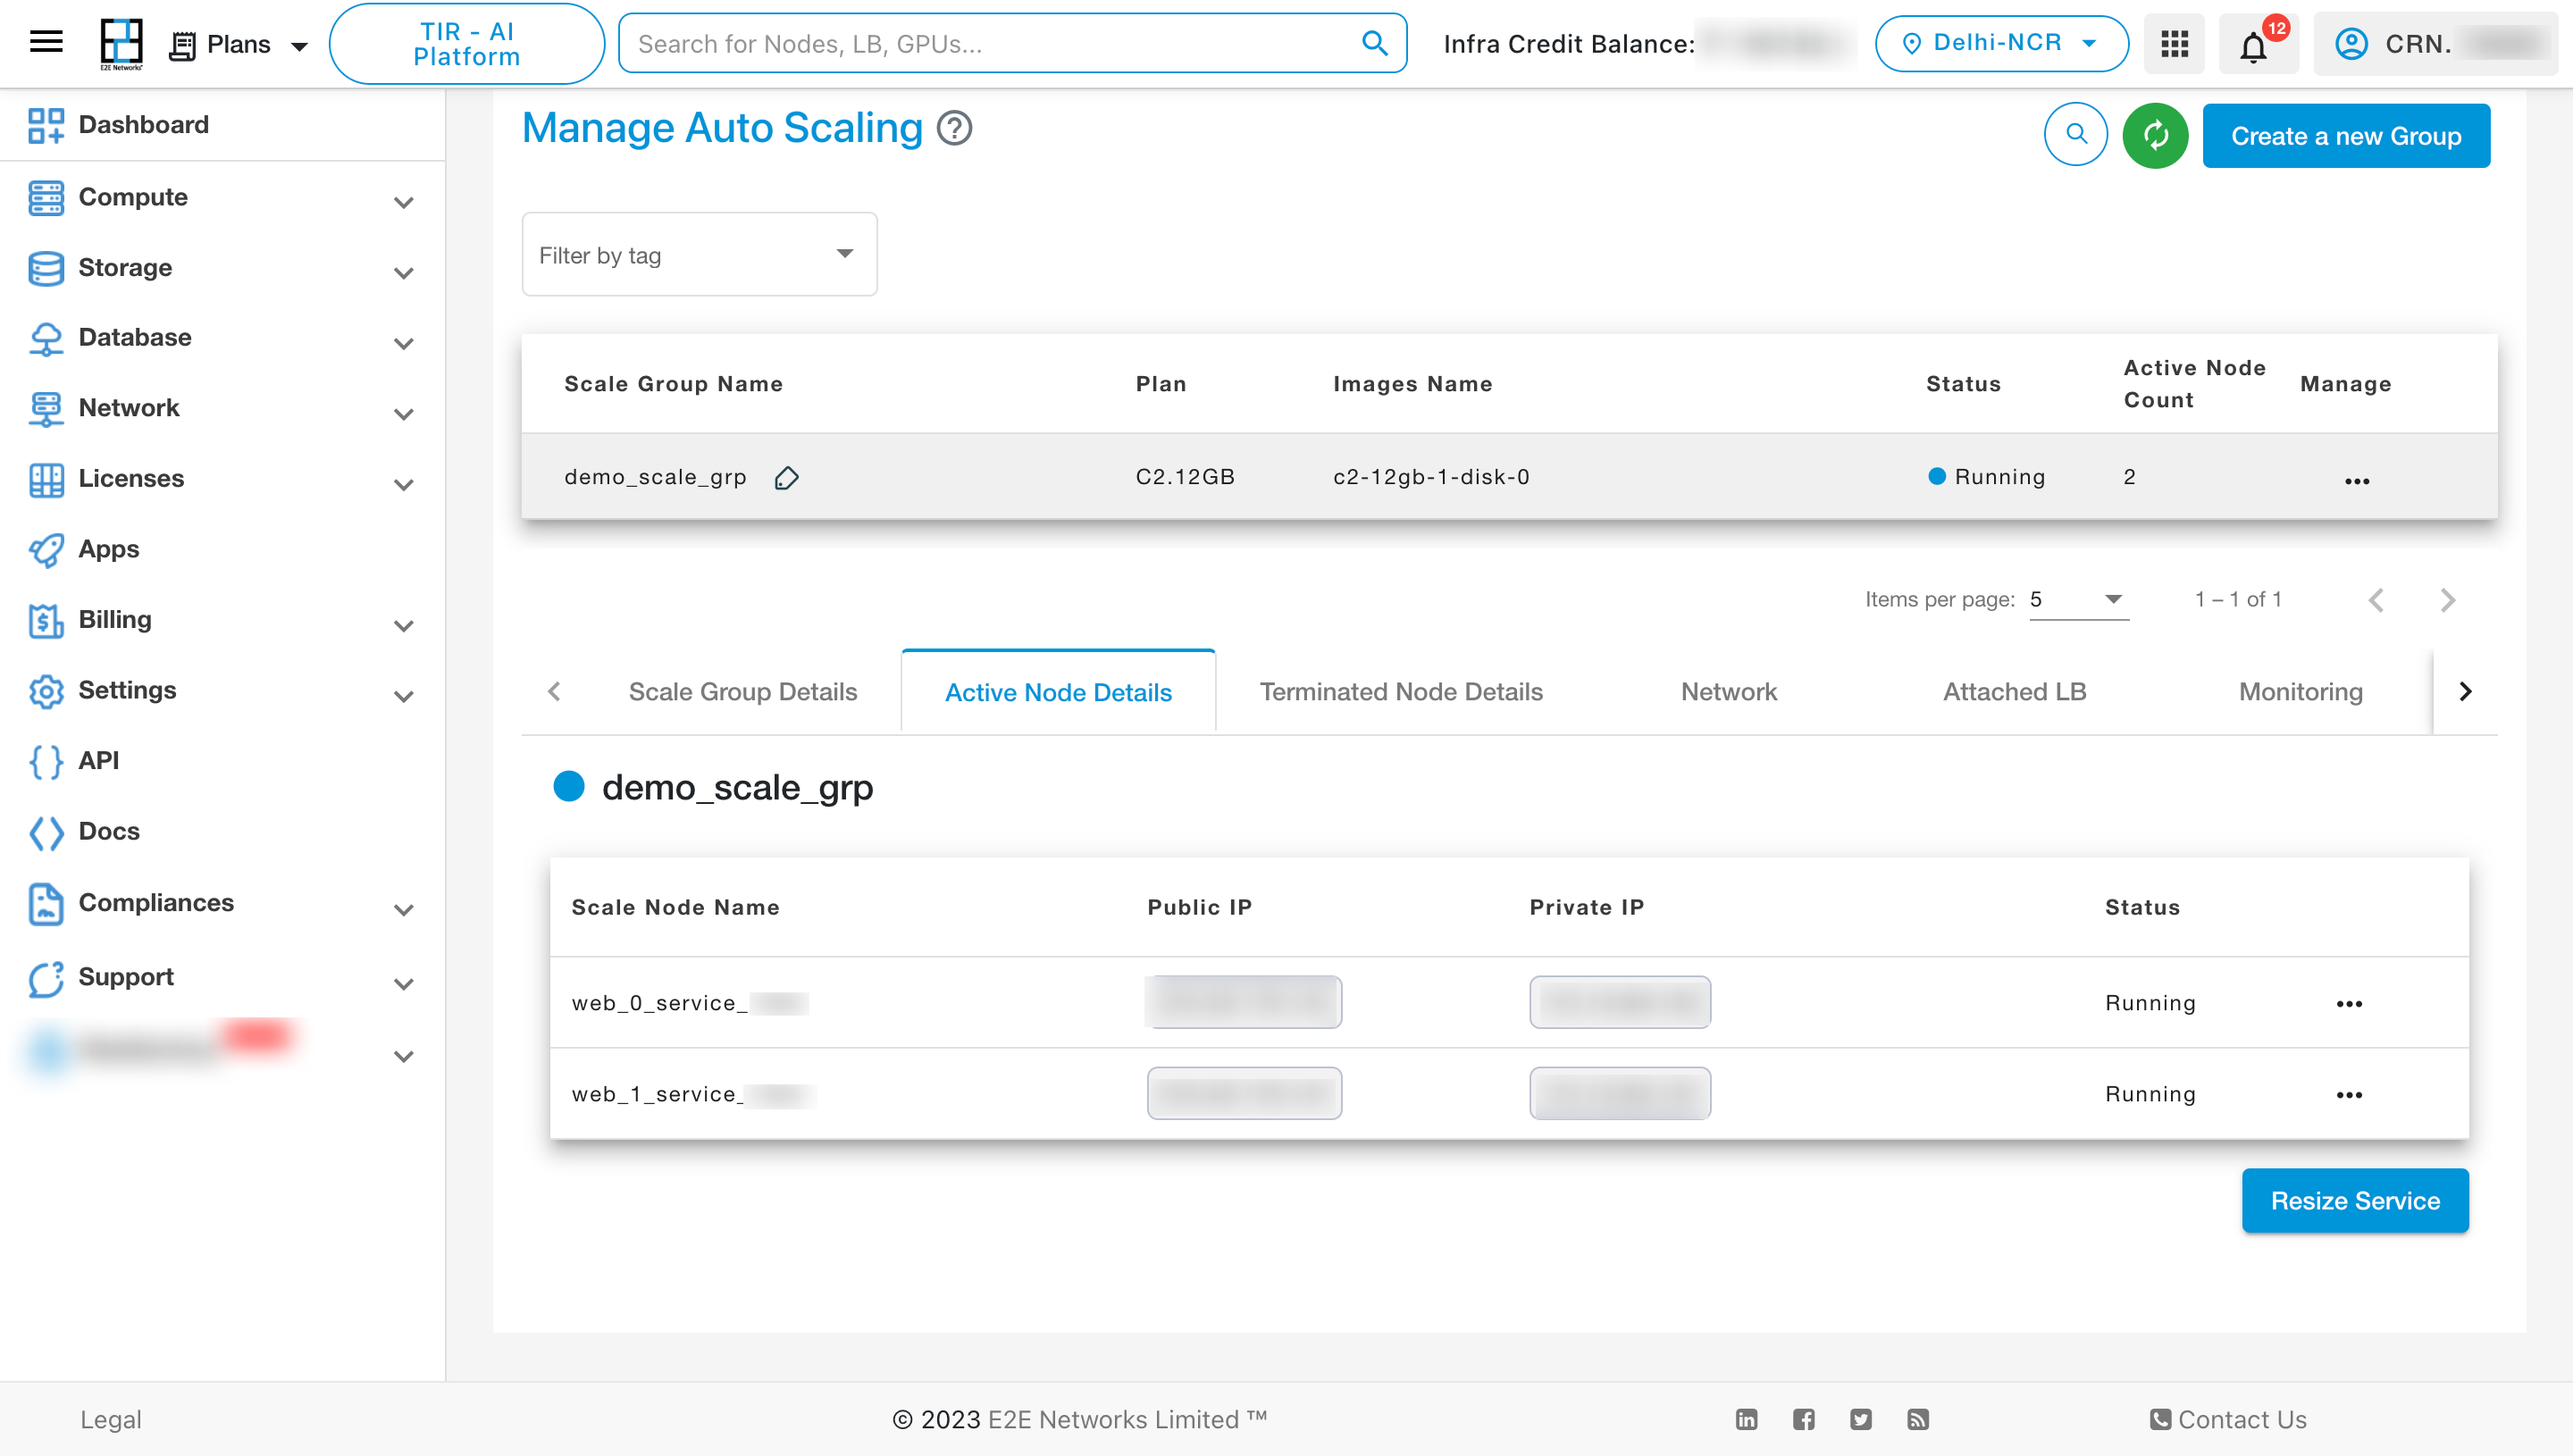
To view the details of the active nodes, click on “Active Node Details” tab.
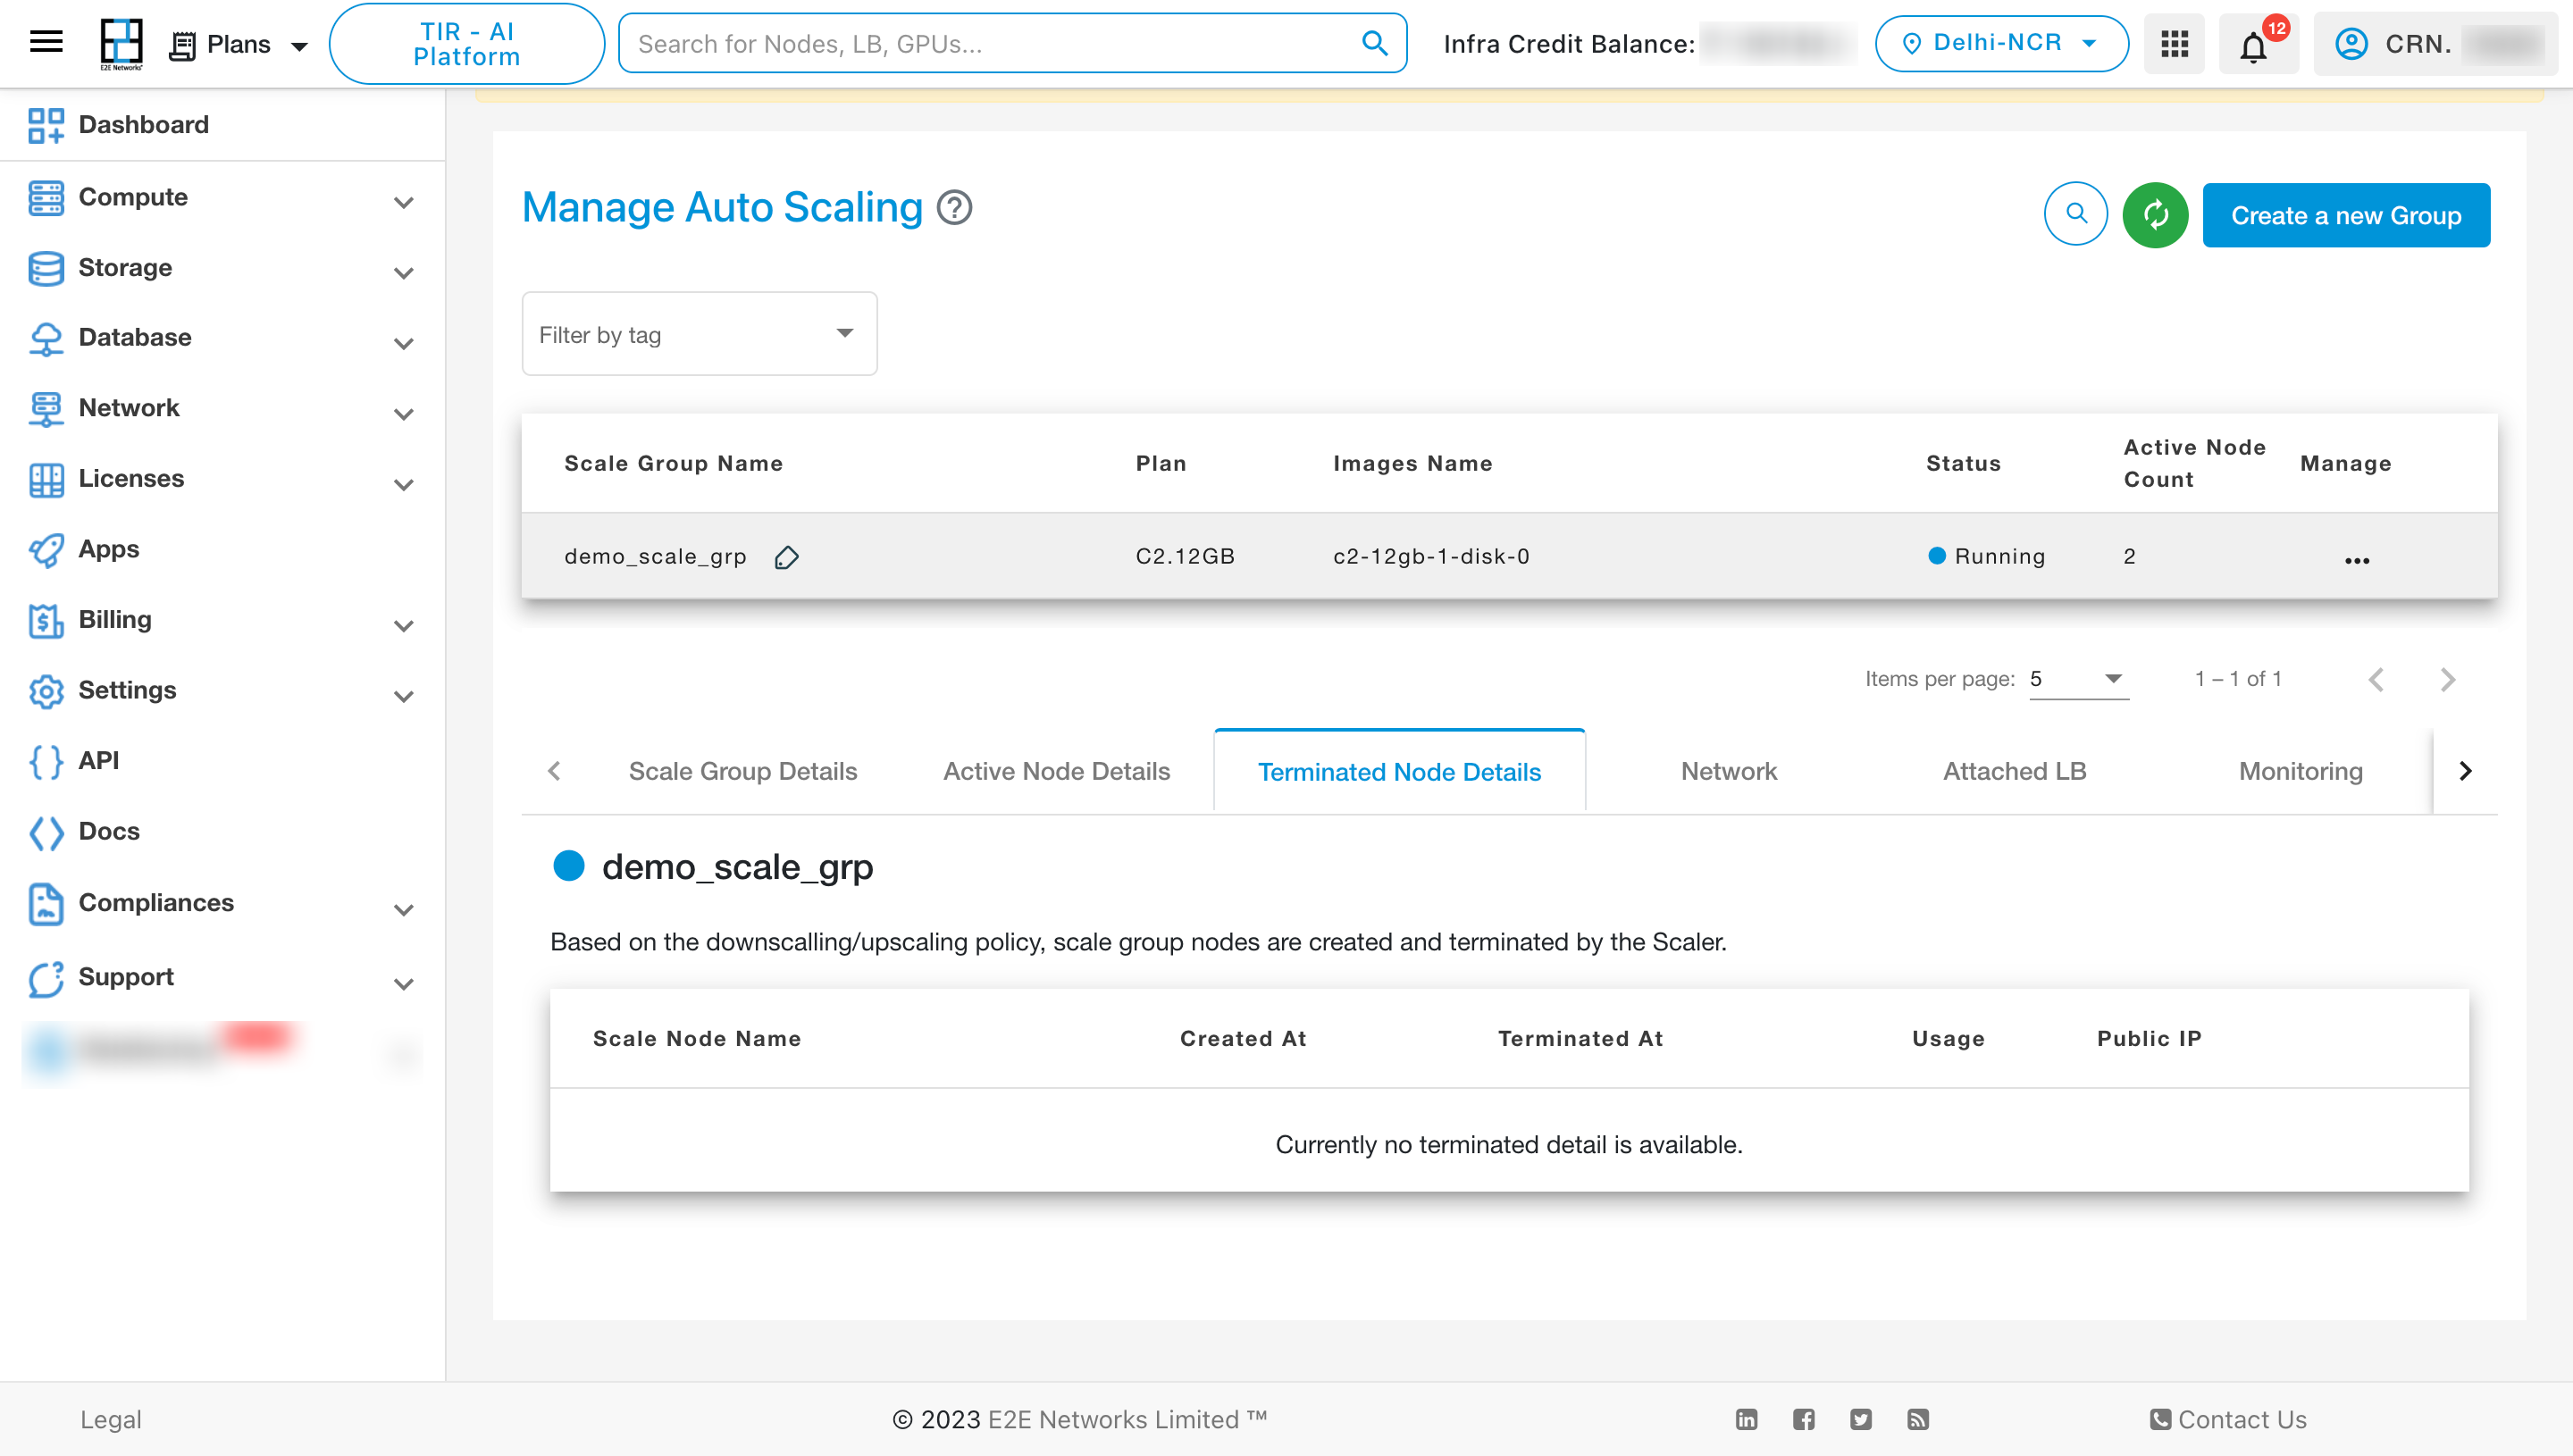
To View the details of the Terminated Node, click on “Terminated Node Details” tab.
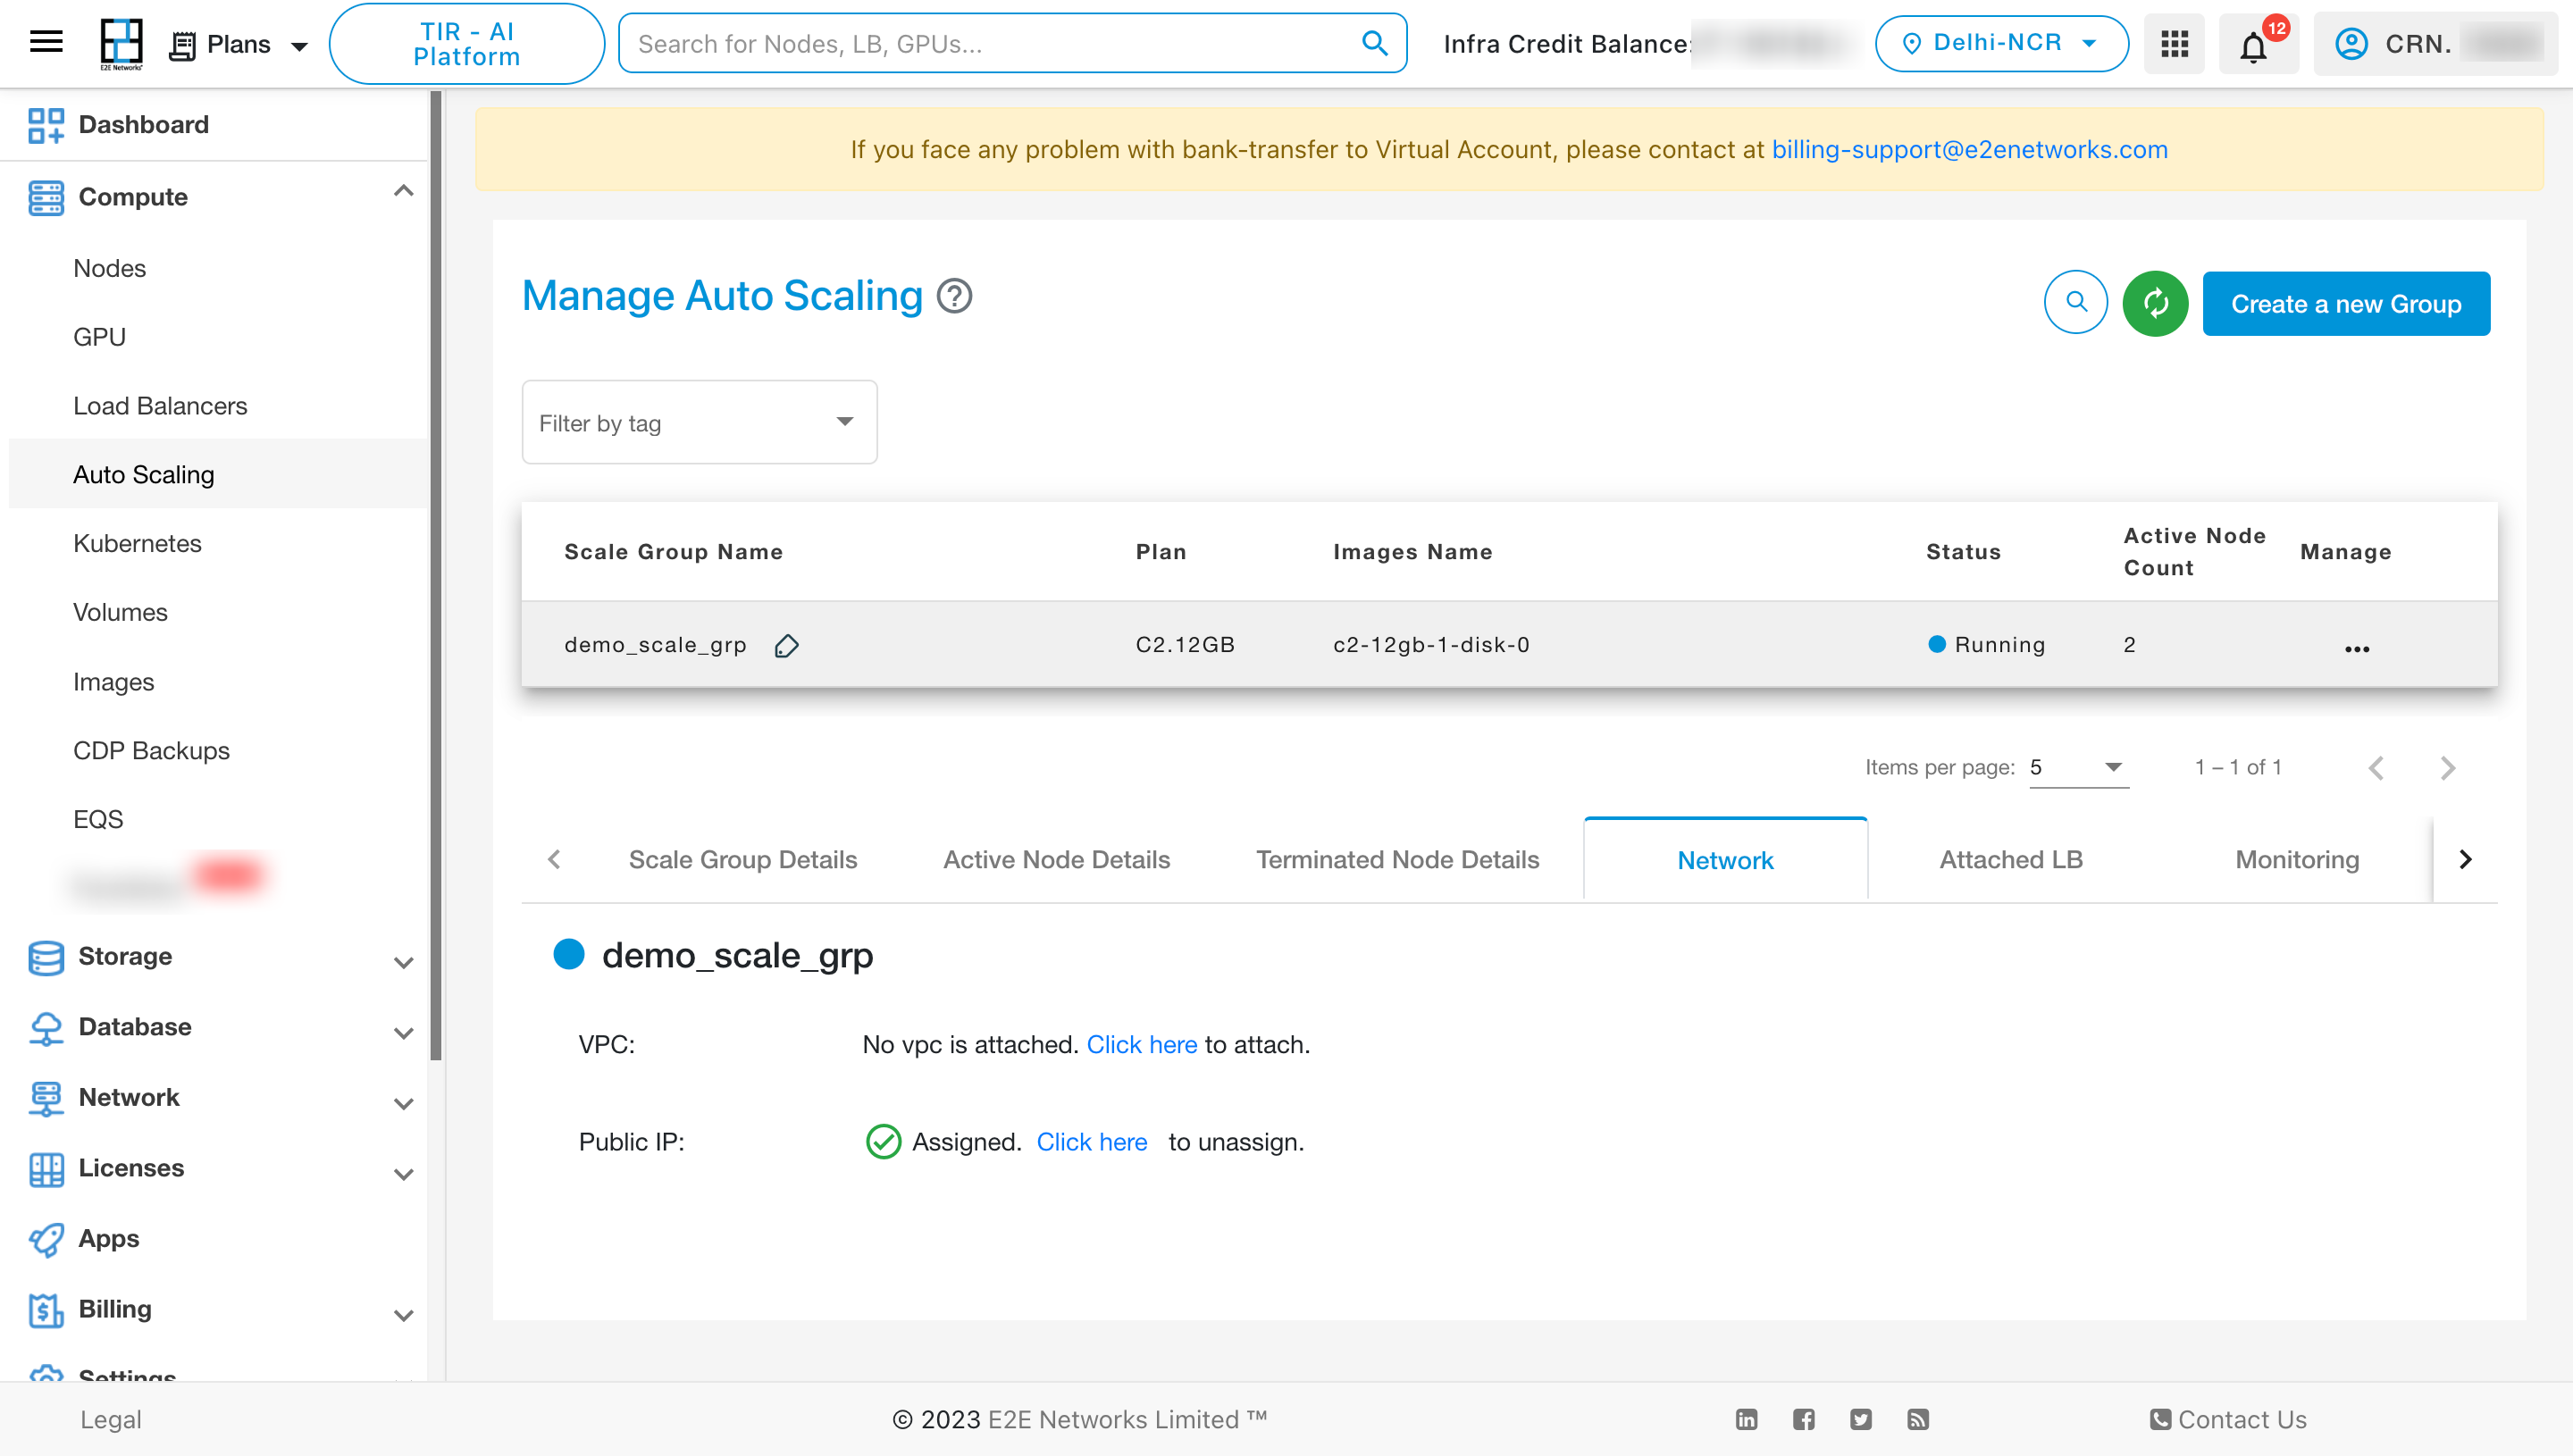
To View the details of the associated networks, click on the “Network” tab.
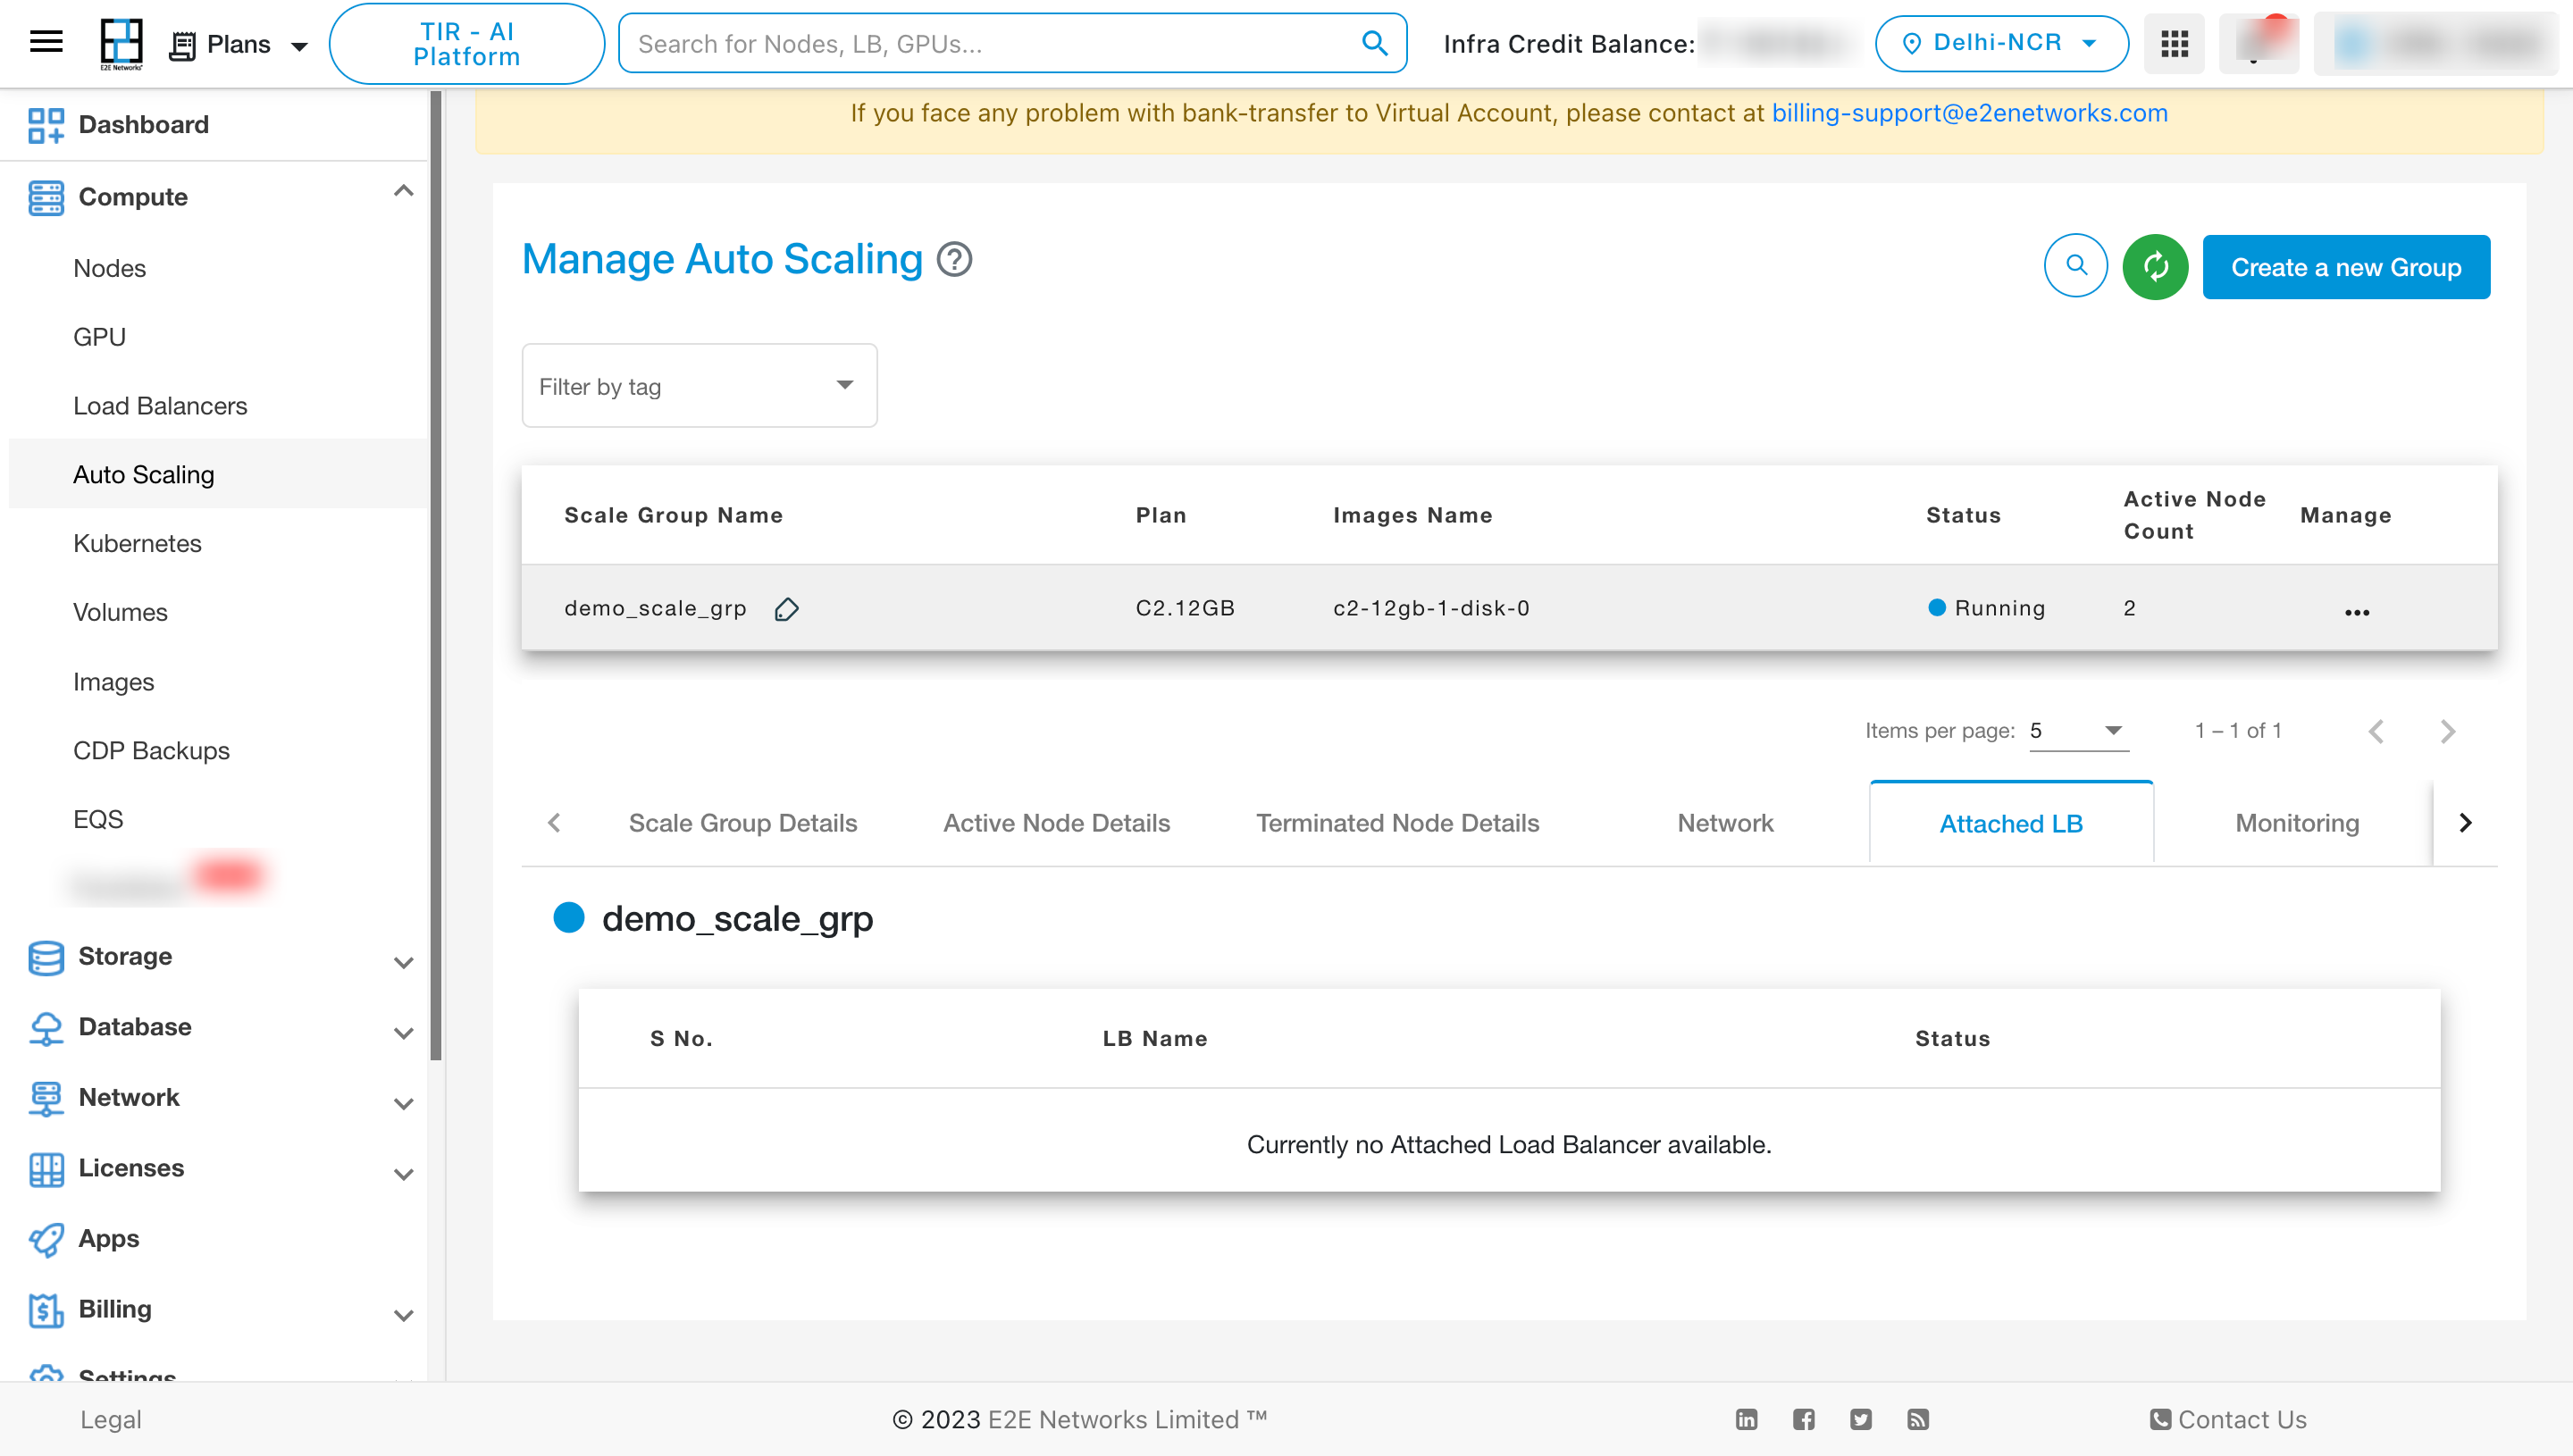
To View the details of the Attached LB, click on “Attached LB” tab.
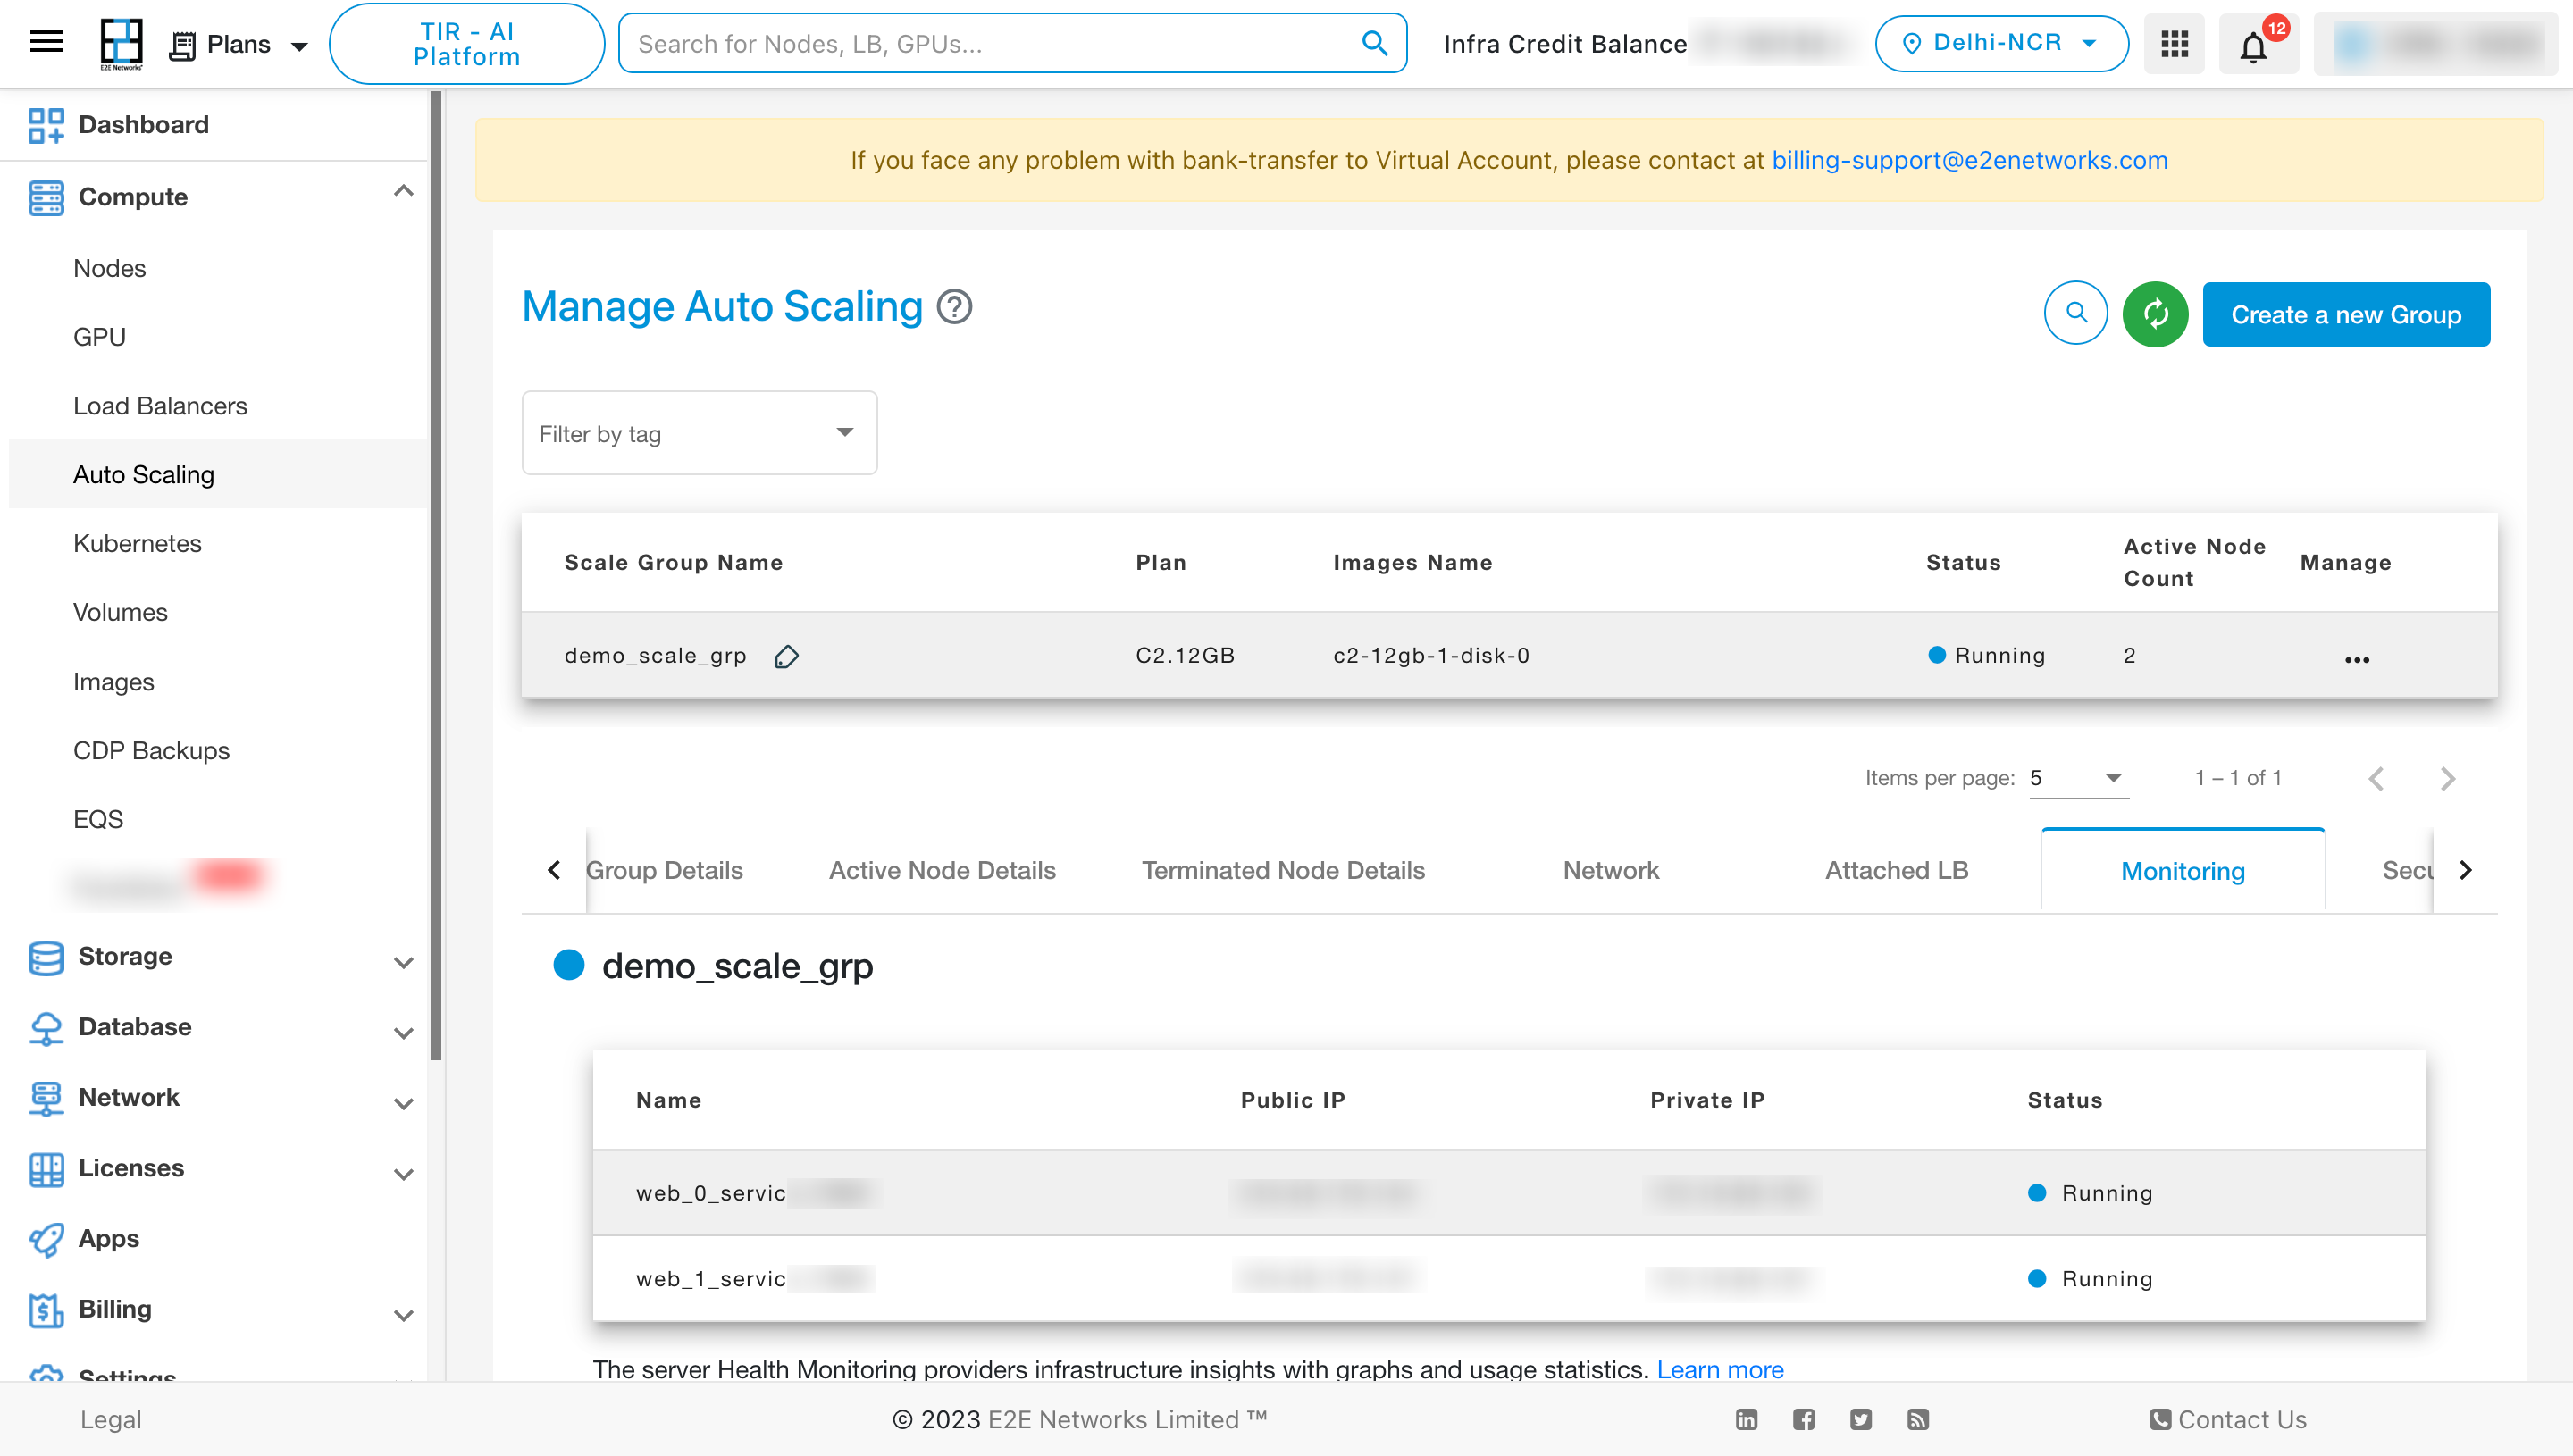
To View the details of the Monitoring, click on “Monitoring” tab.
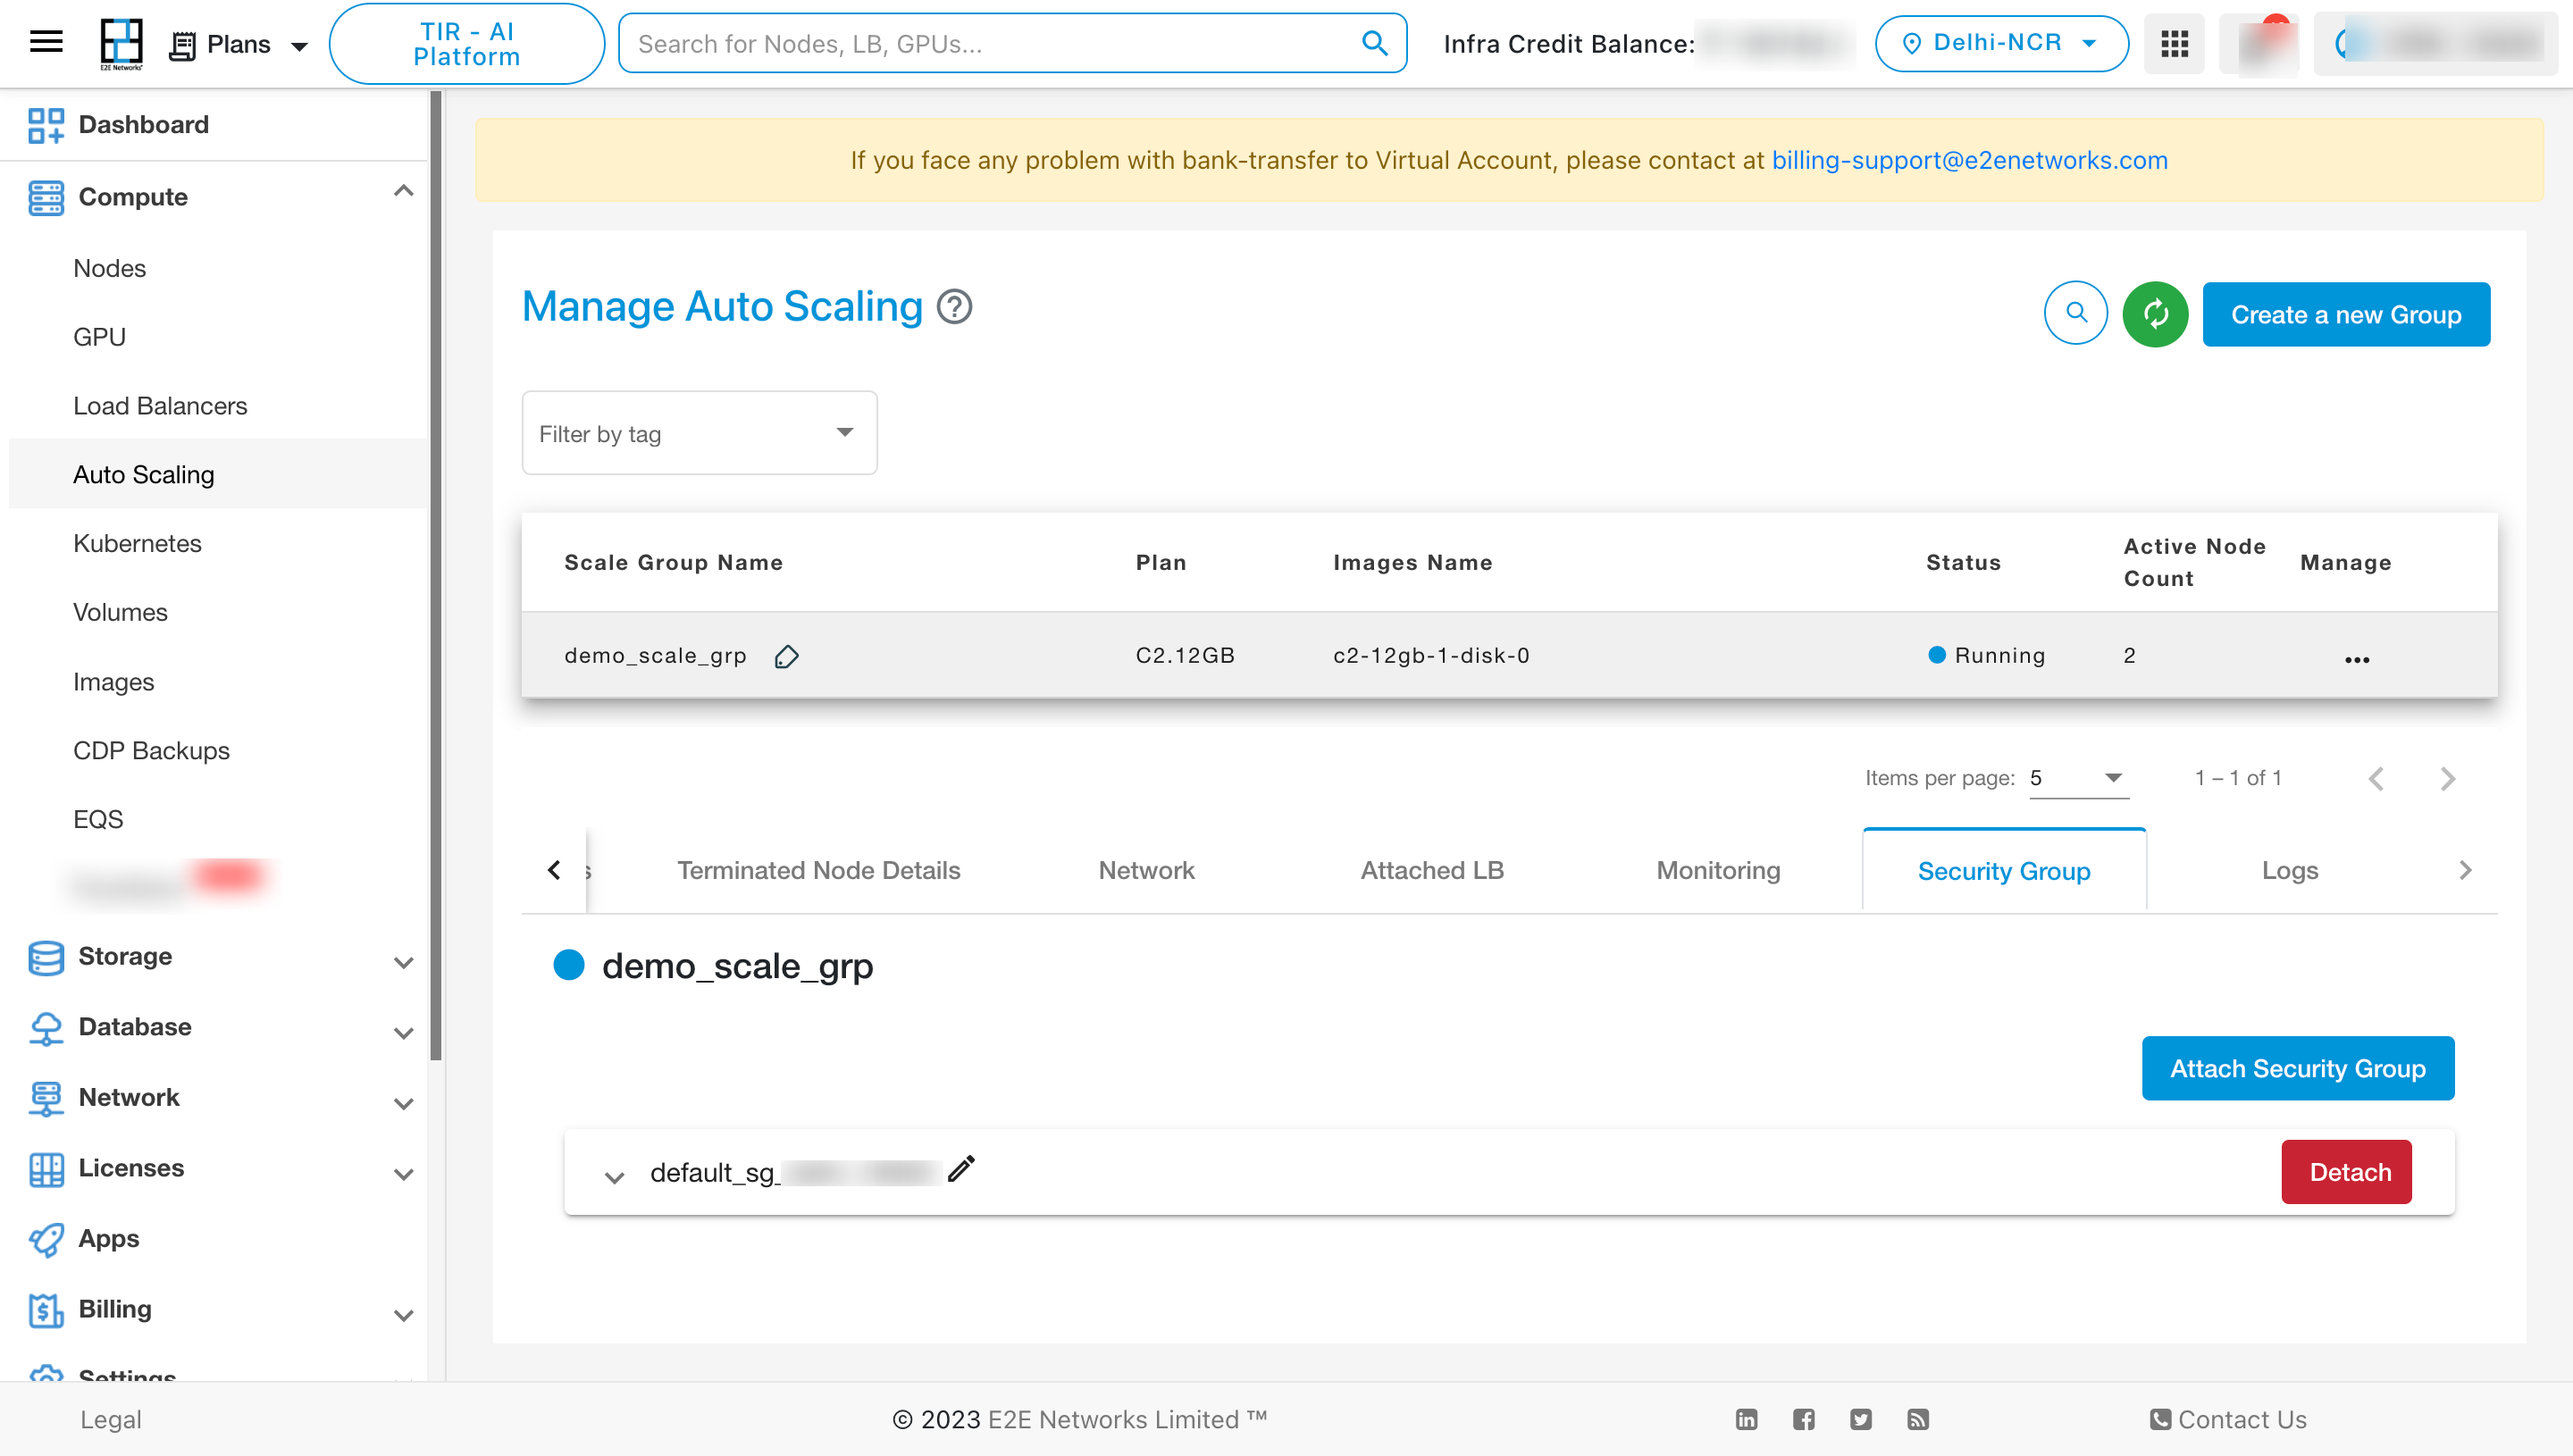
To View the details of the Security Group, click on “Security group” tab.
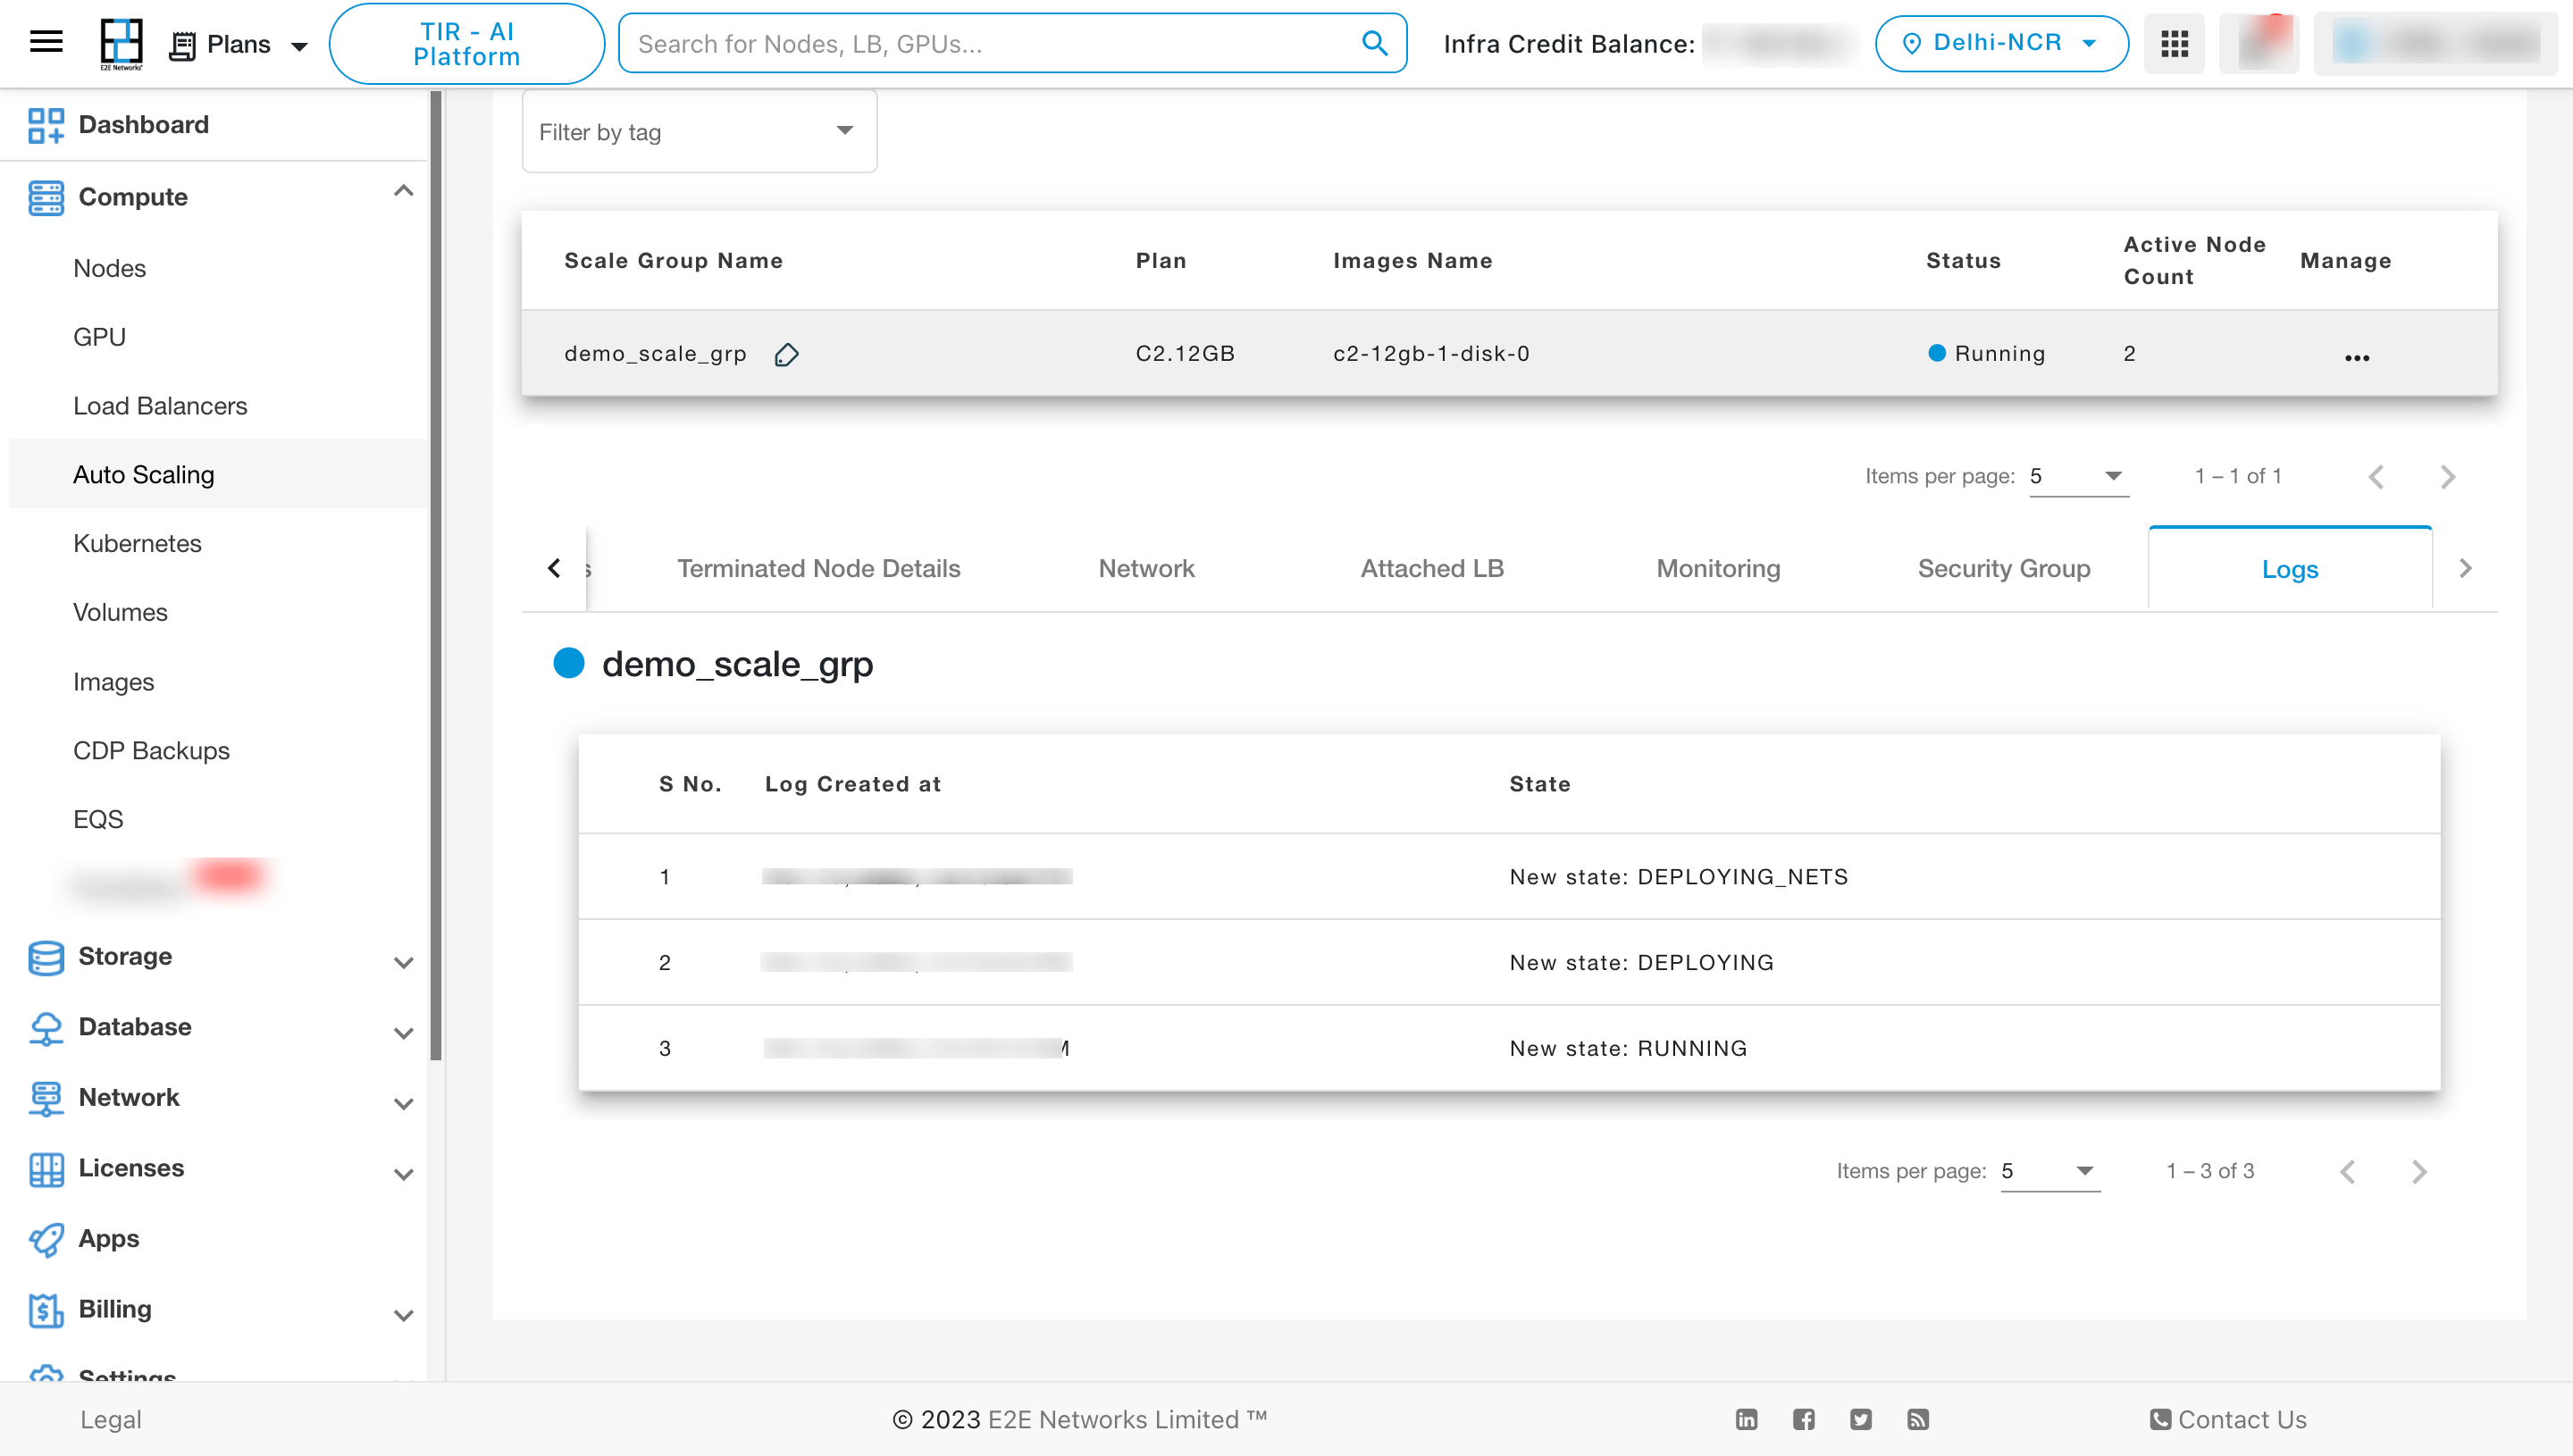
To View the details of the Logs, click on “Logs” tab.
Actions
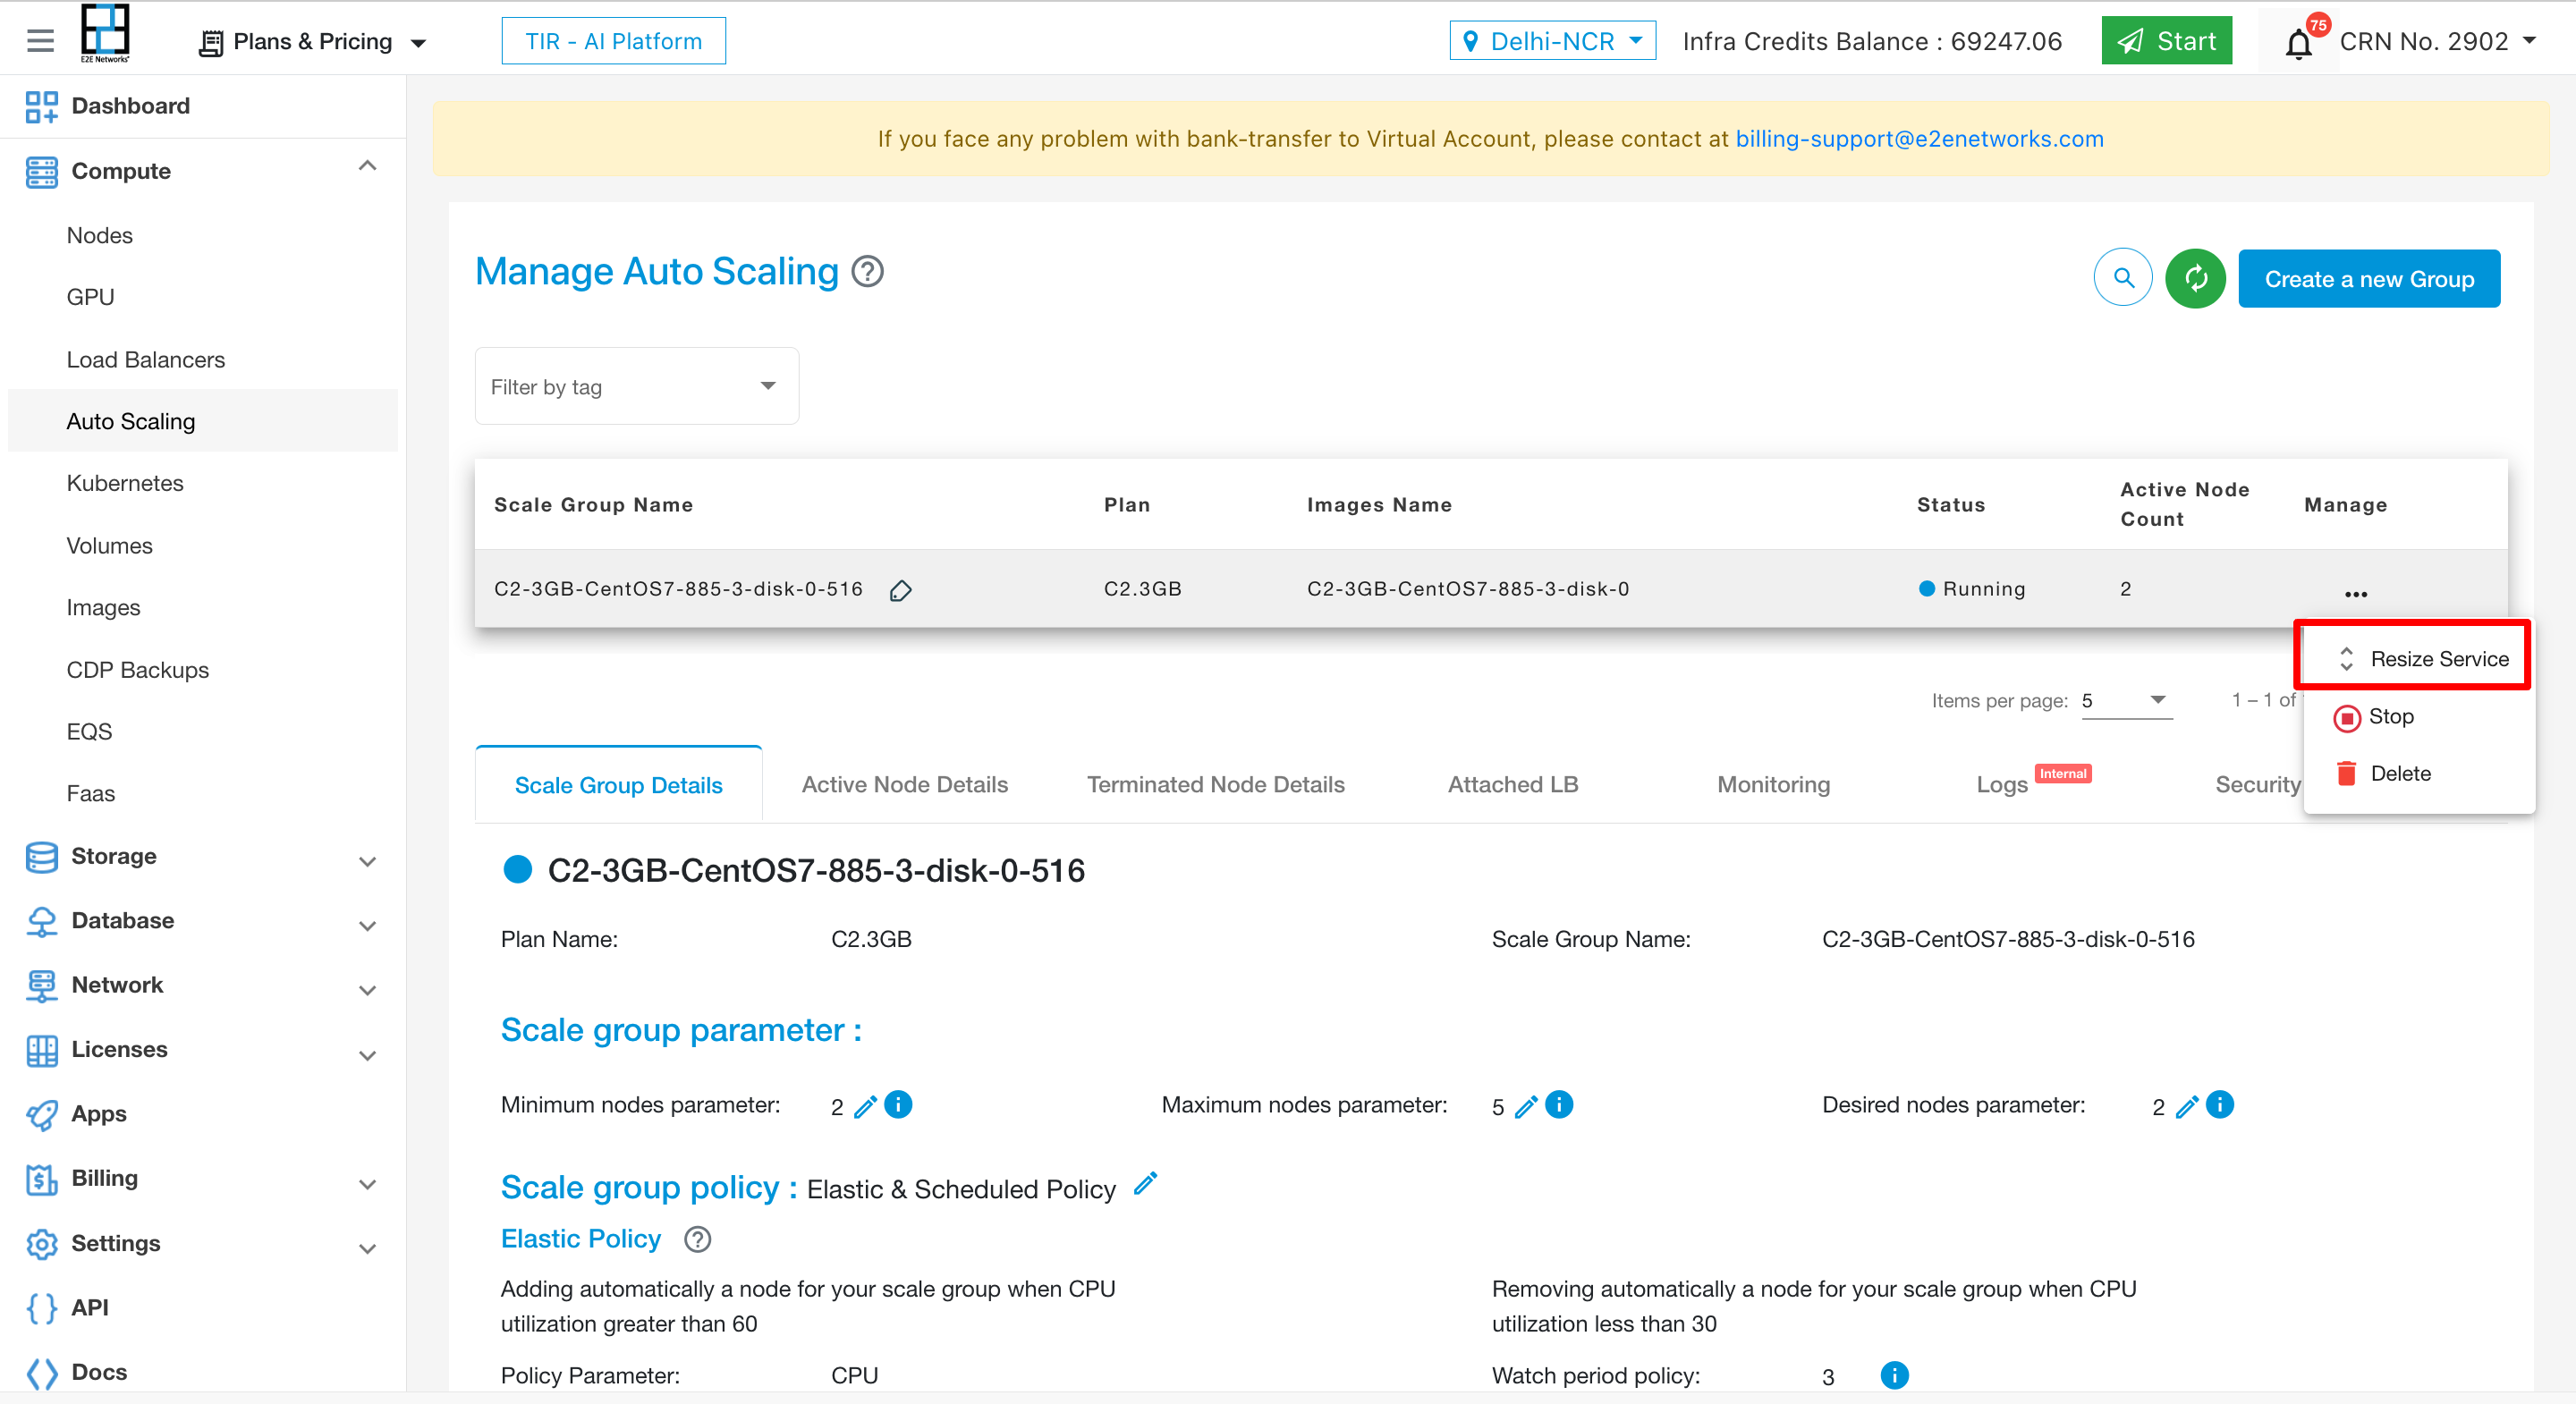
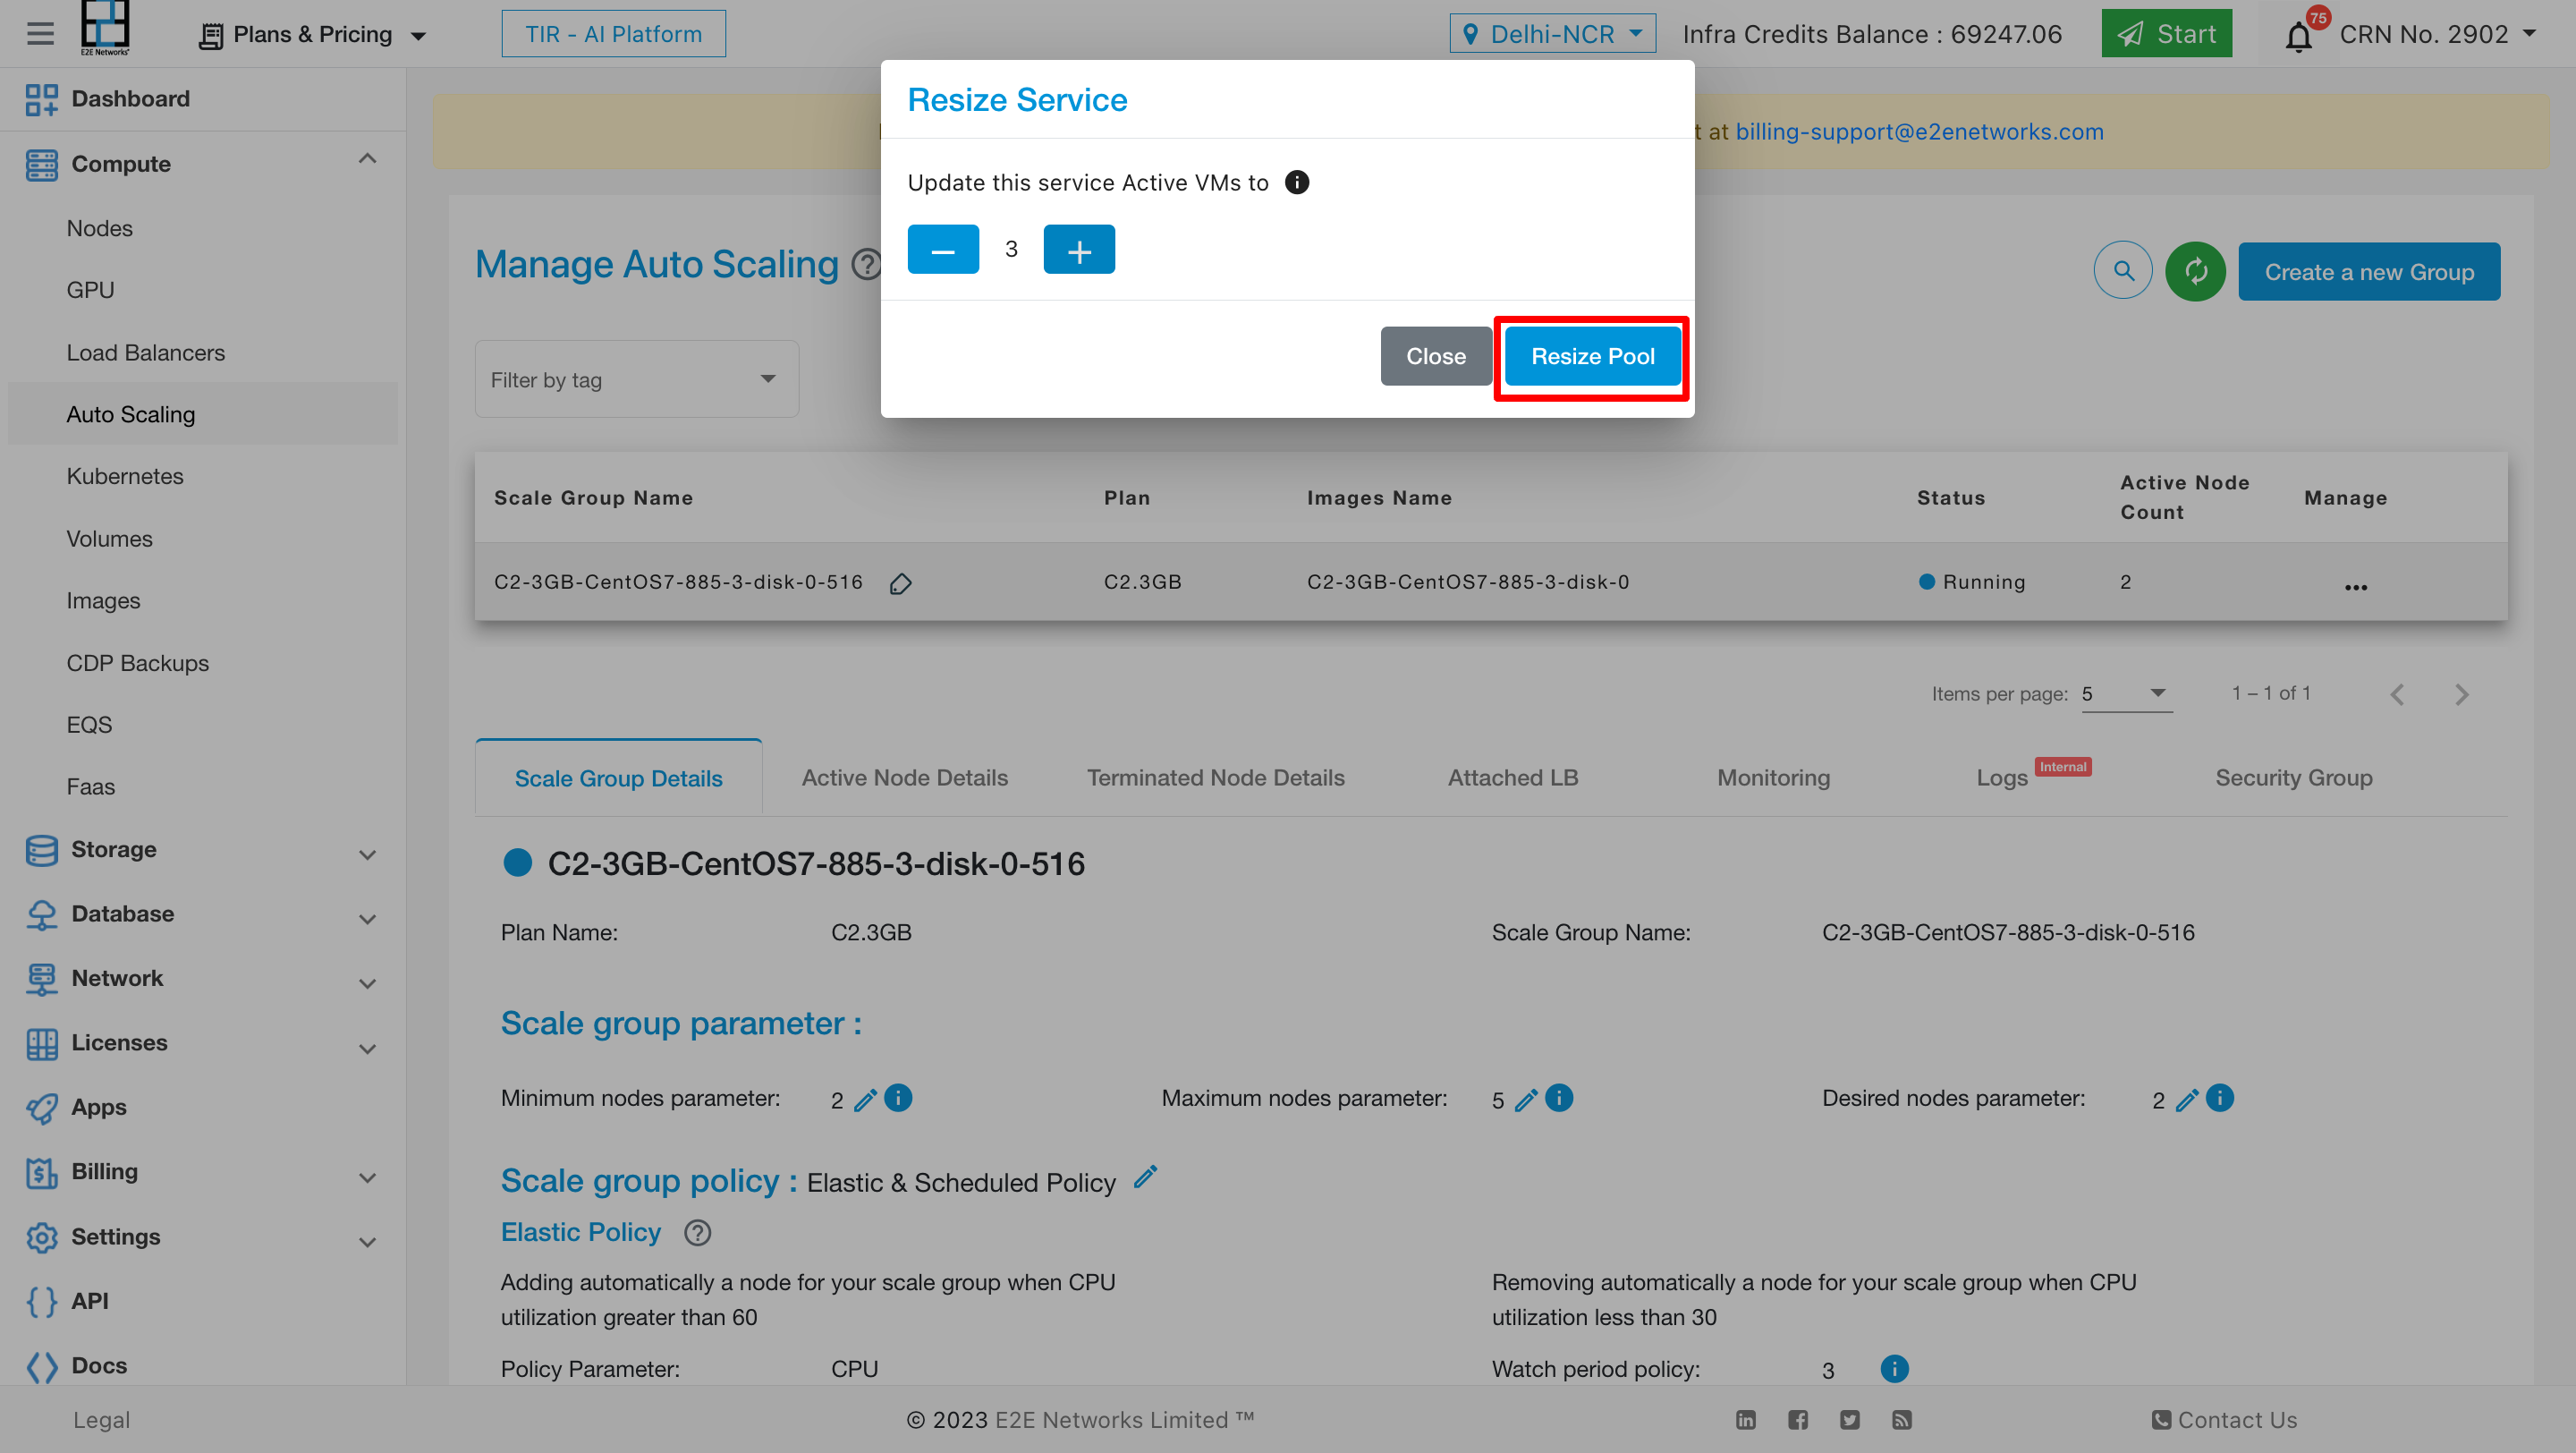
Resize Service
To resize the services click on 3 dots and click on resize services option
Start/Stop Action
Introduction
The start/stop actions in the autoscaling service are designed to manage the state of the service, allowing users to start or stop their instances as needed. This documentation provides a detailed guide on how to utilize these actions effectively.
Stop Action
The stop action is used to halt the service within the autoscaling infrastructure.
Process: When initiating a stop action, the service will transition to a stopped state after a brief period.
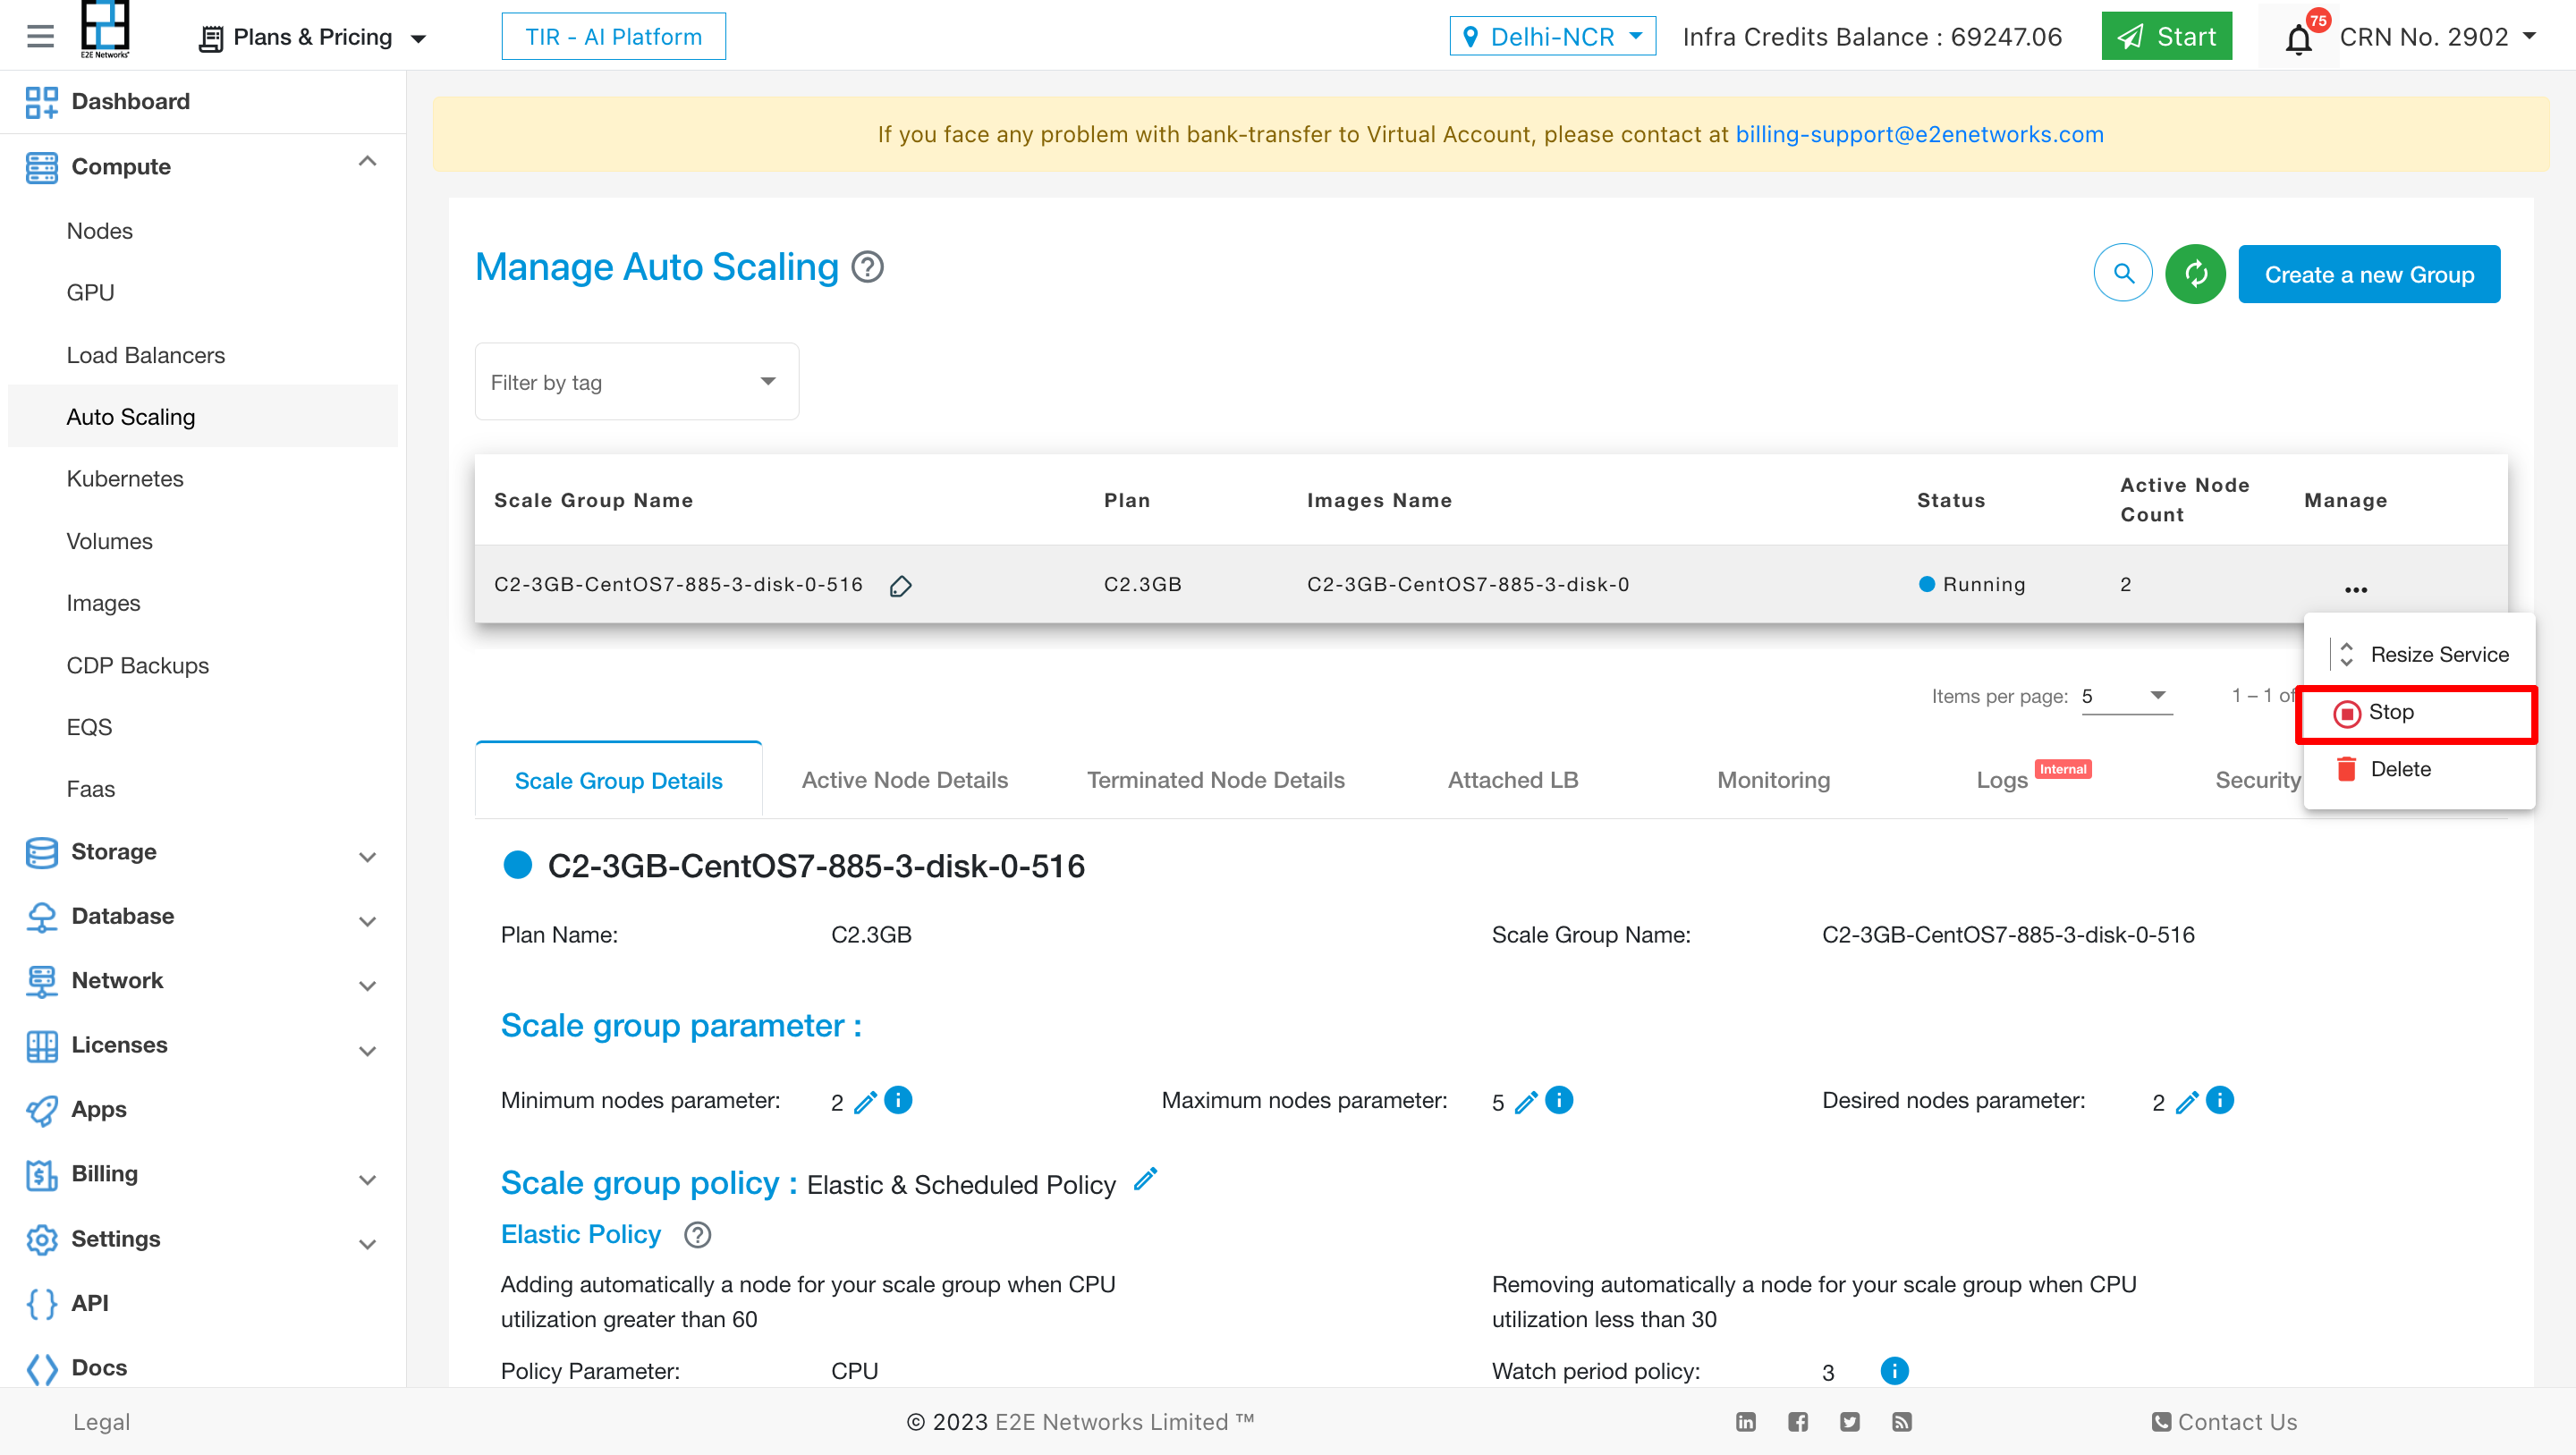
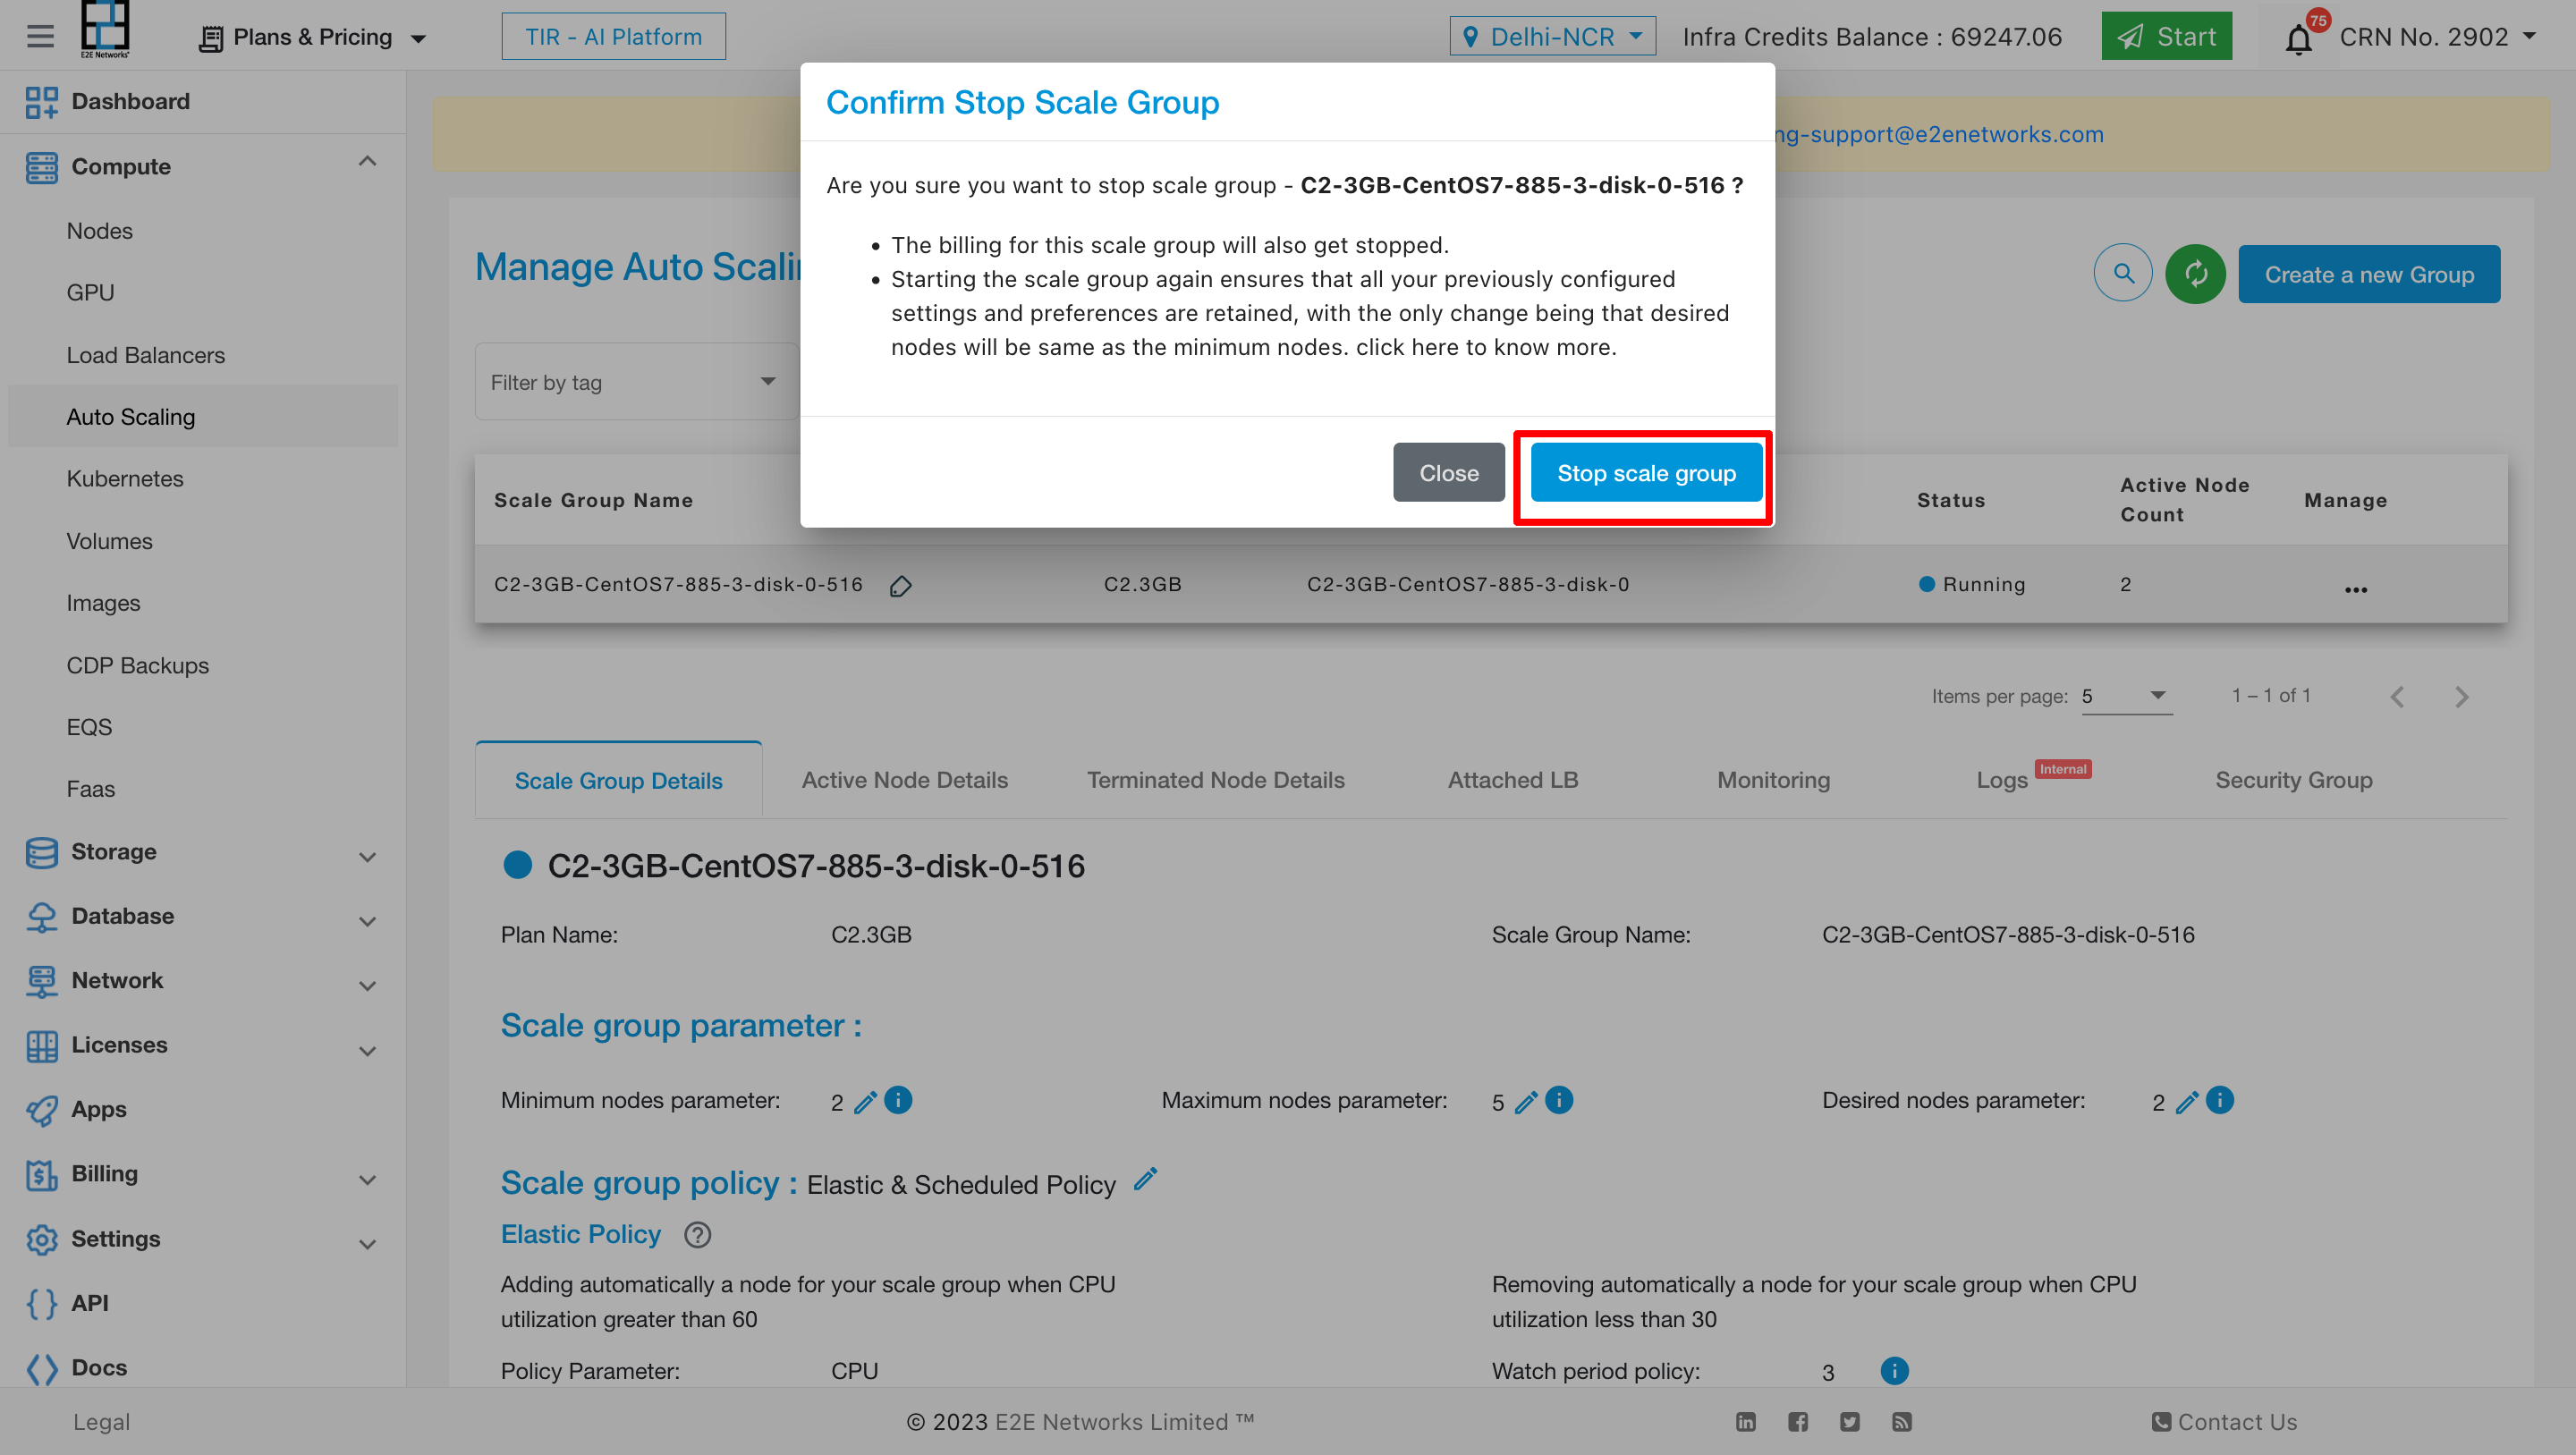
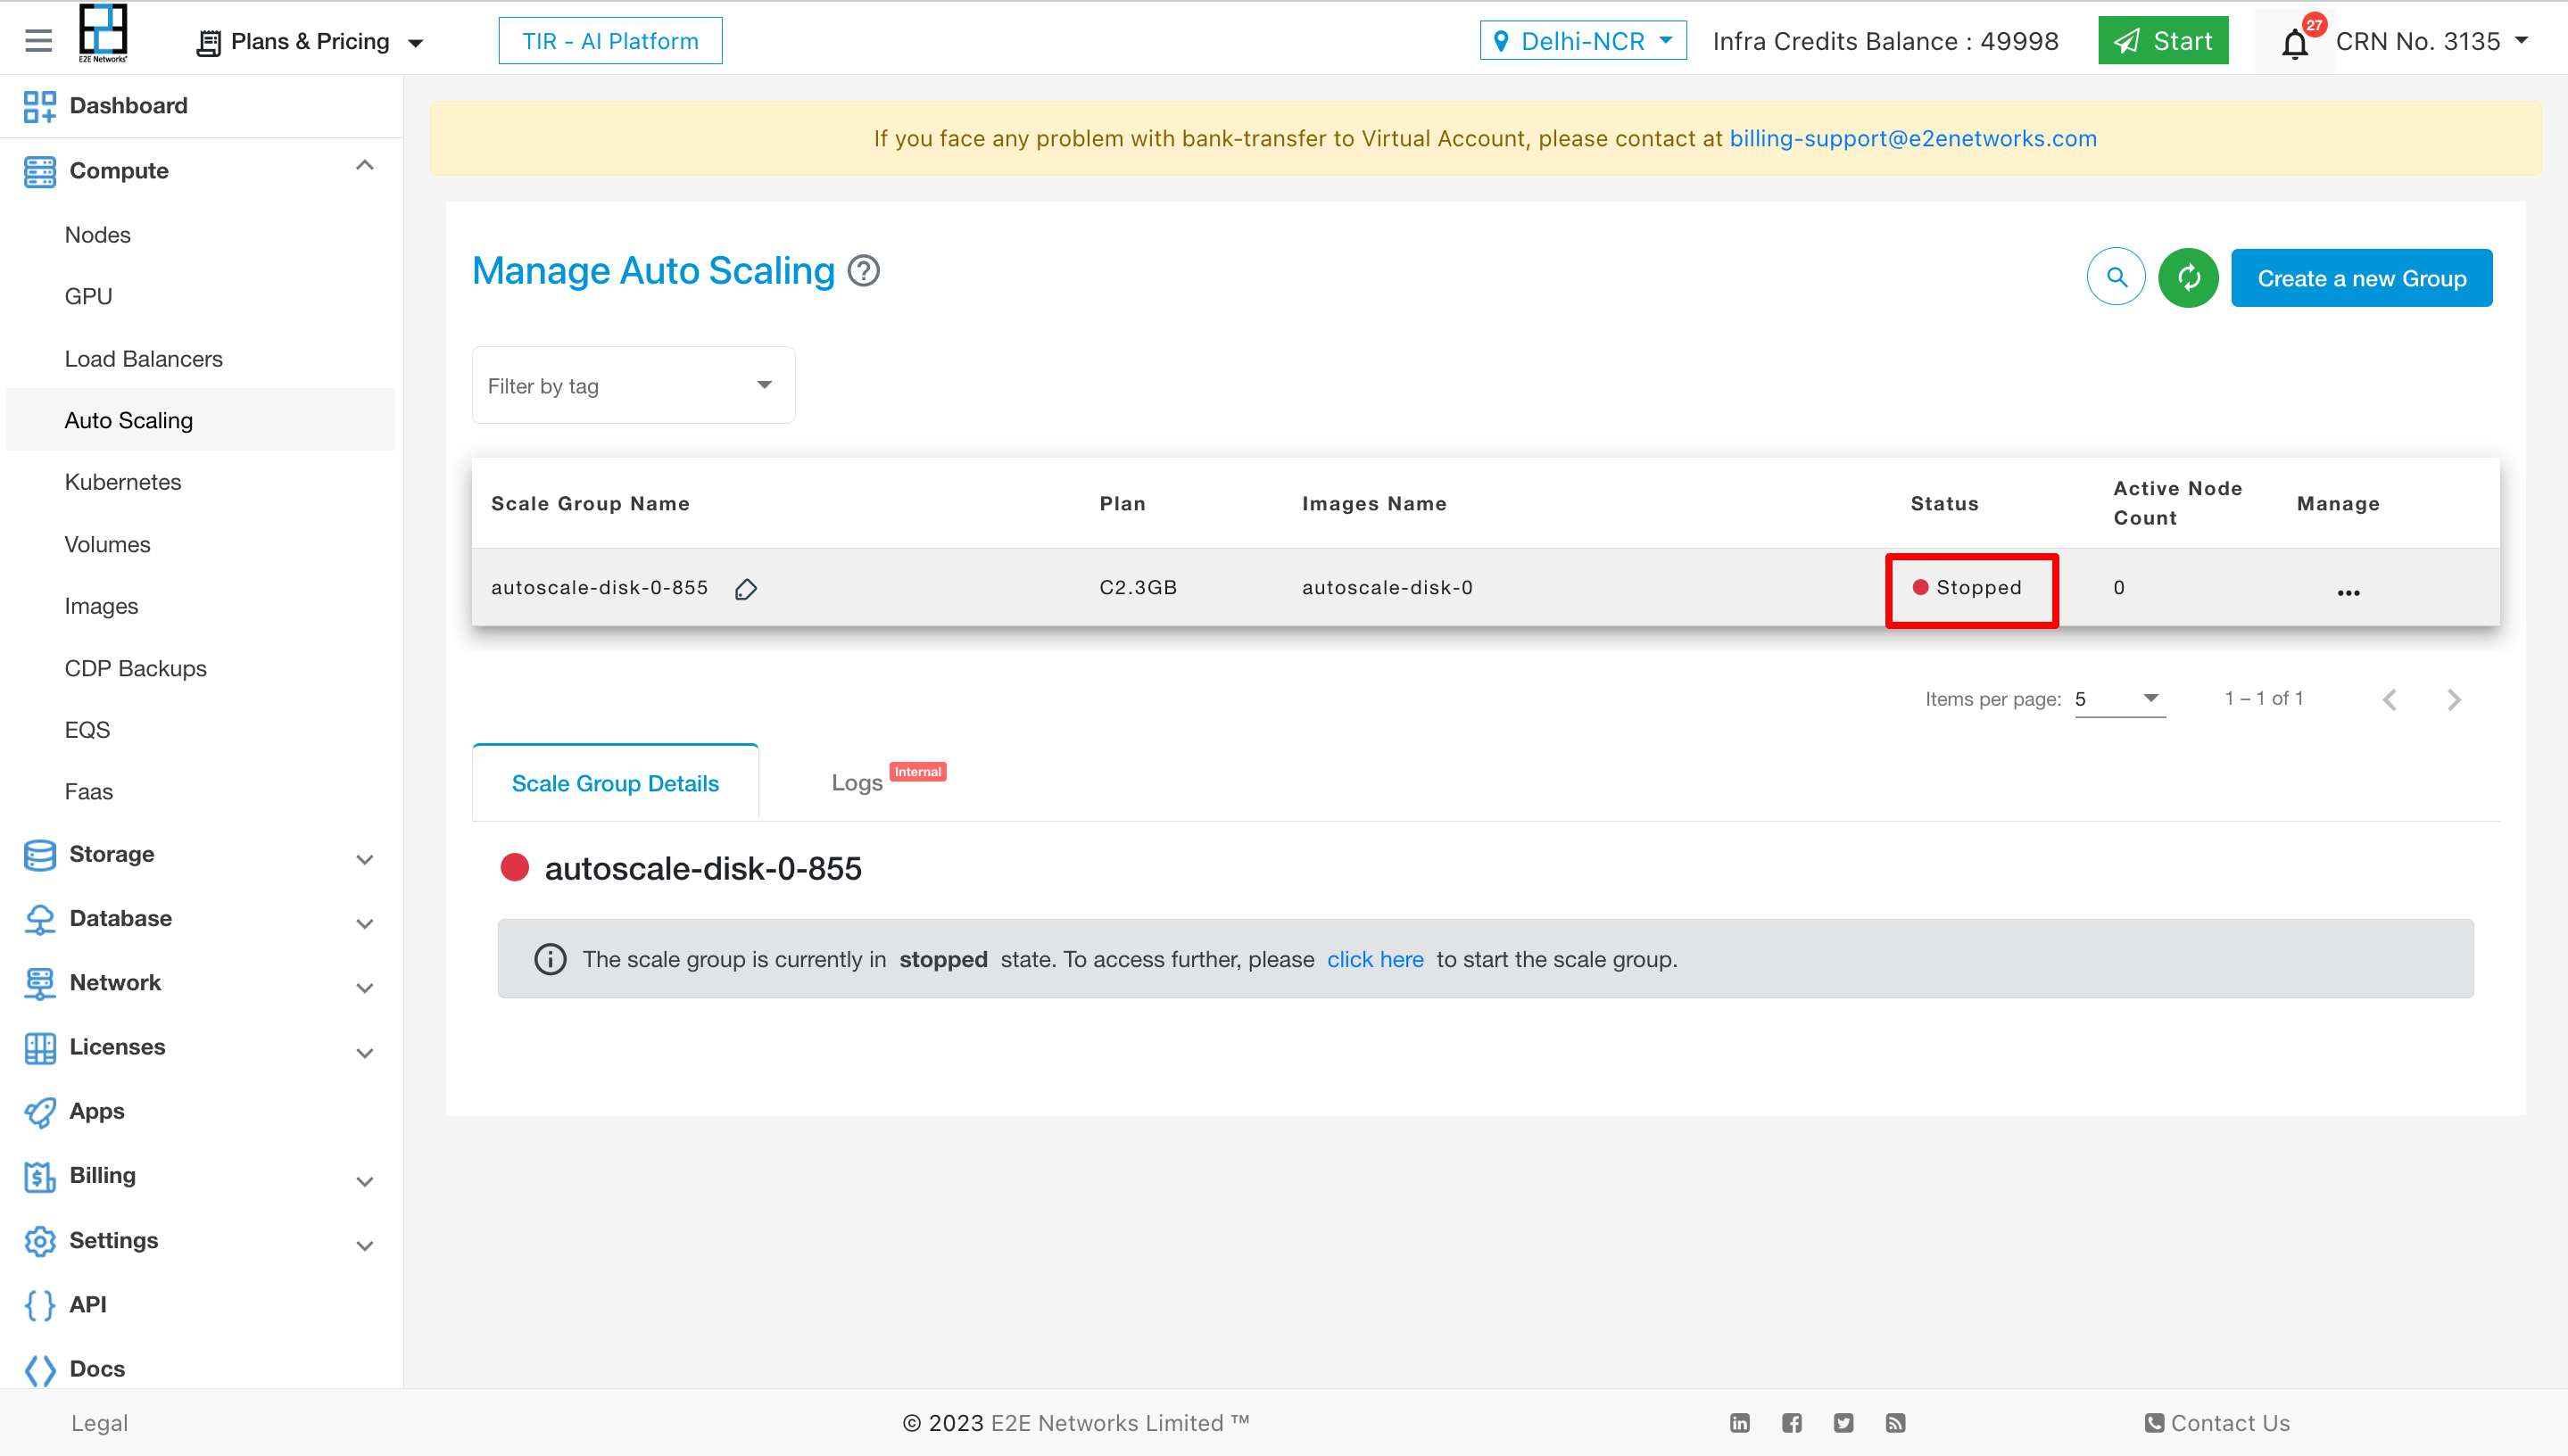
State: The service will be marked as ‘stopped,’ and the desired nodes will be set to zero.
Billing: During the stopped state, billing for the service will be paused, ensuring cost savings for the user.
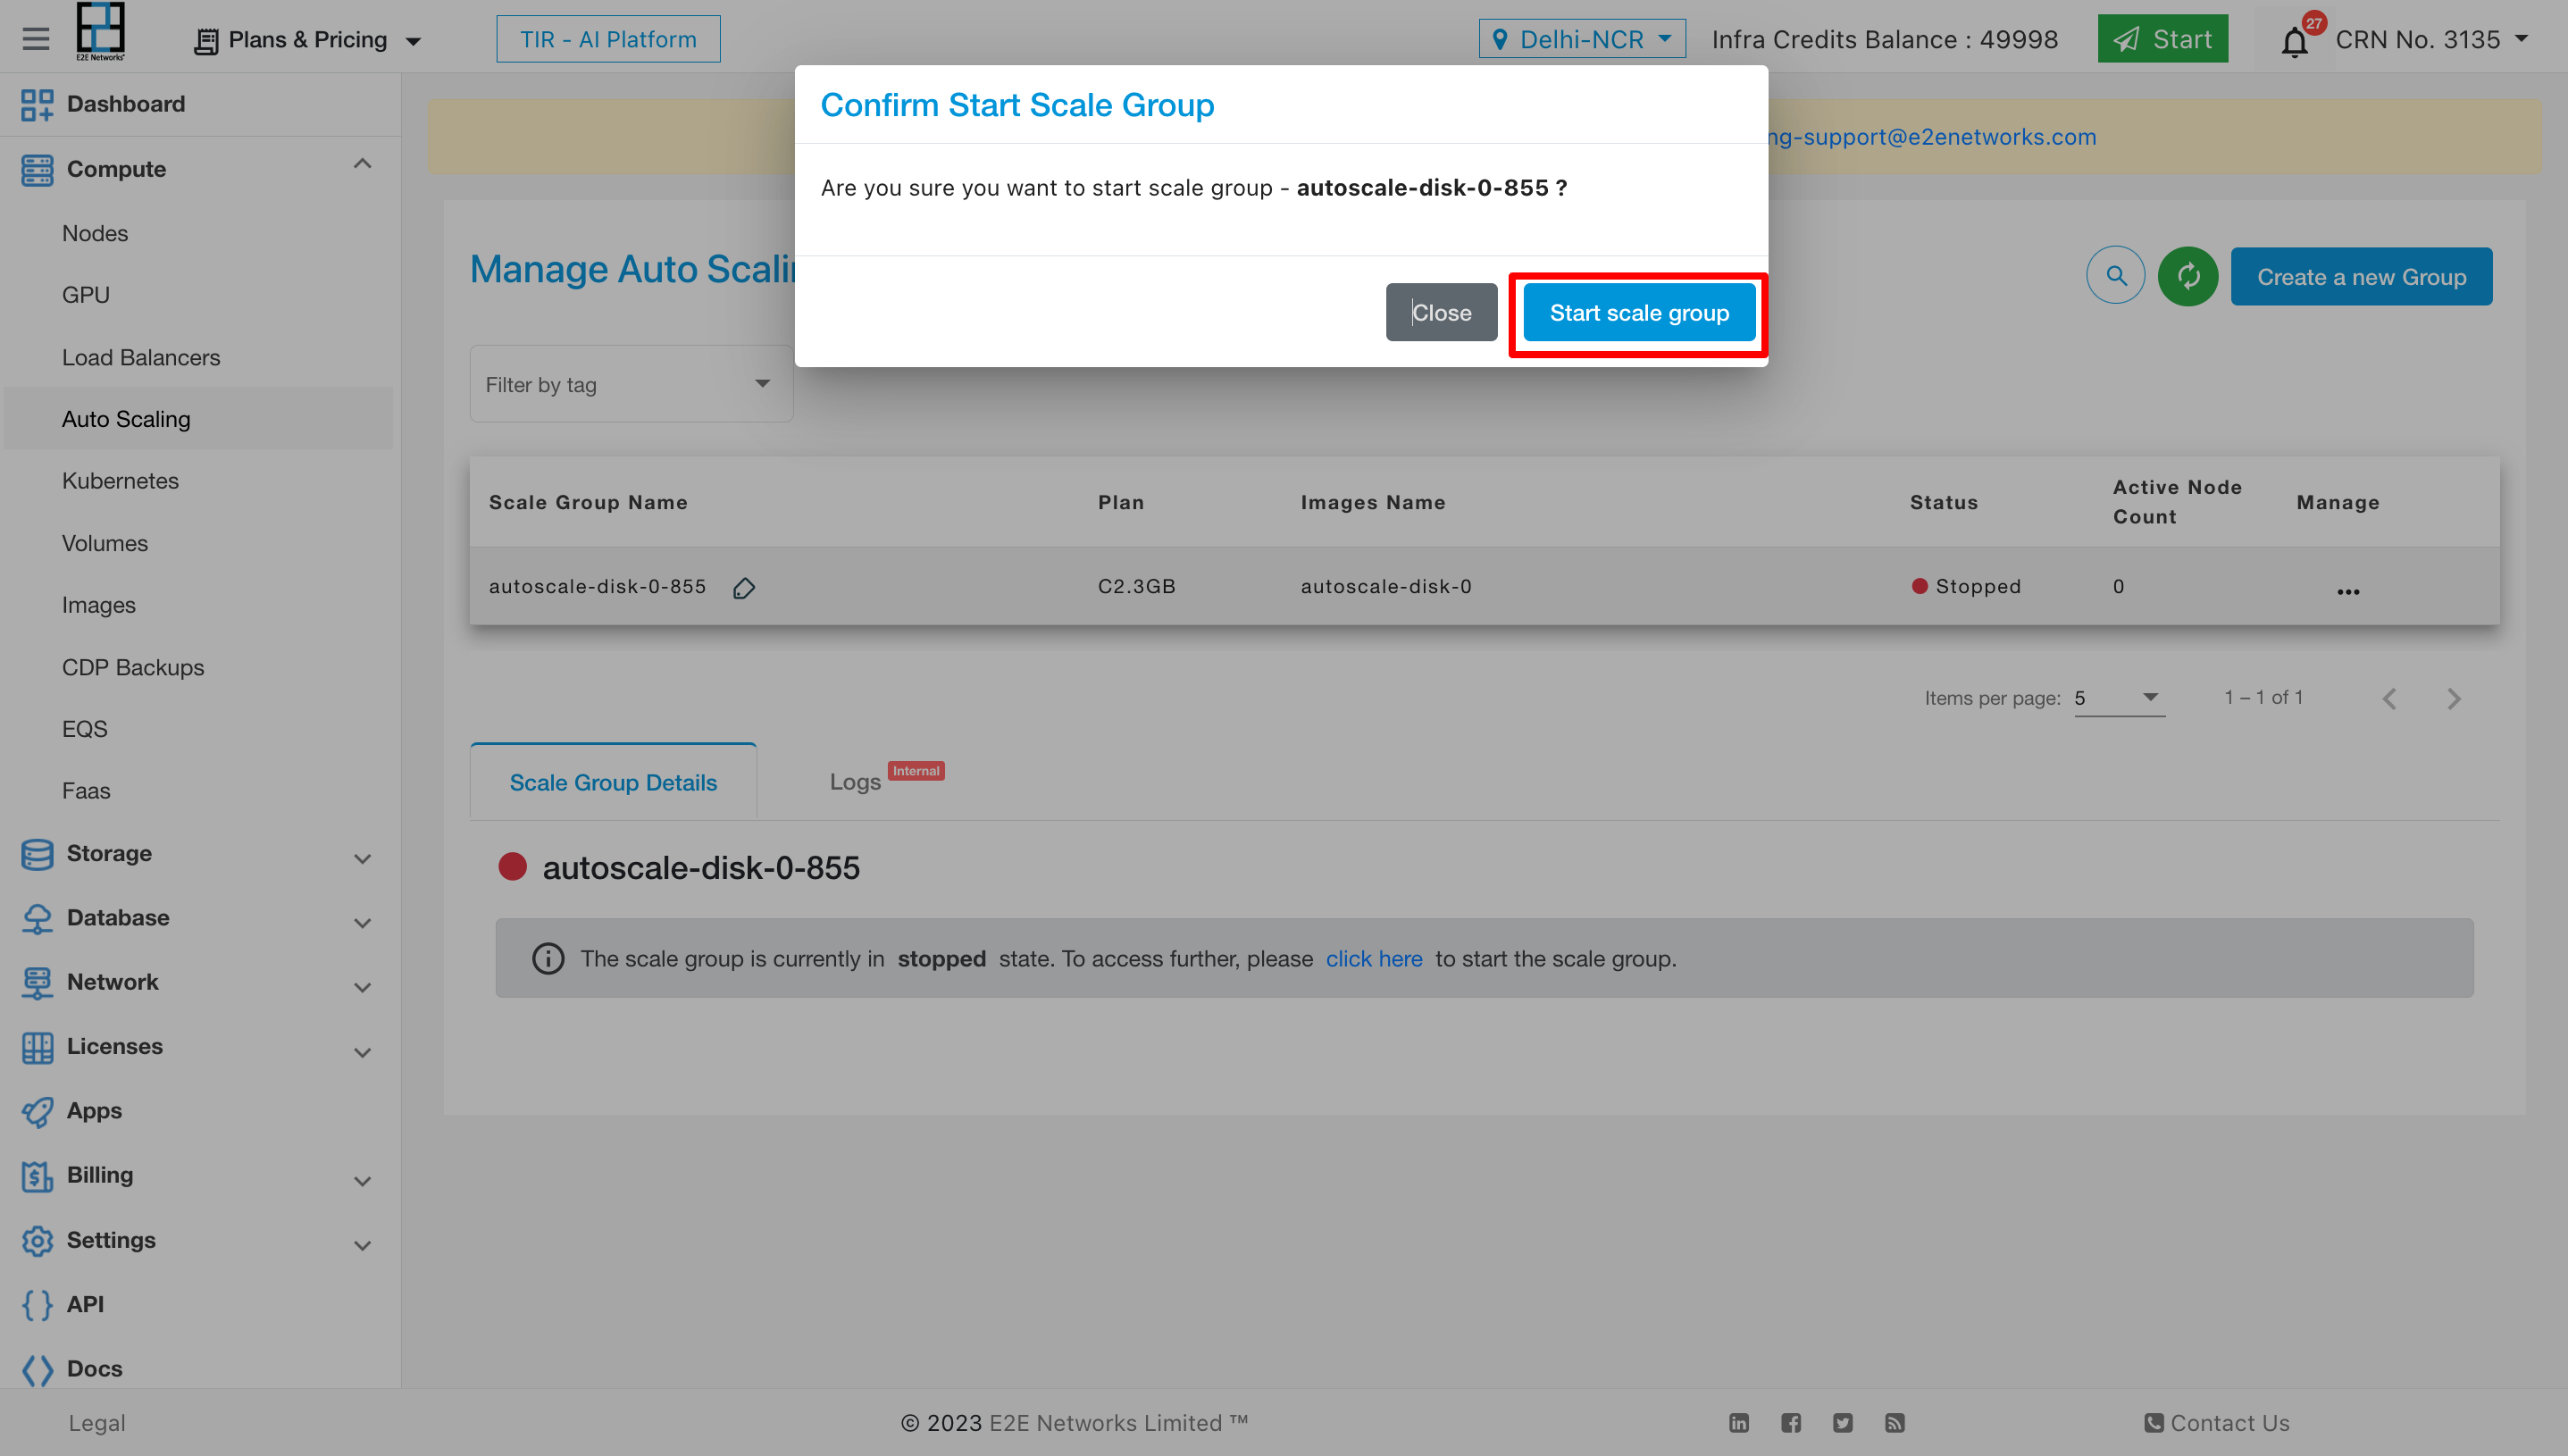
Start Action
The start action is employed to commence the service within the autoscaling environment.
Process: Upon executing a start action, the service will transition to a running state after a short duration.
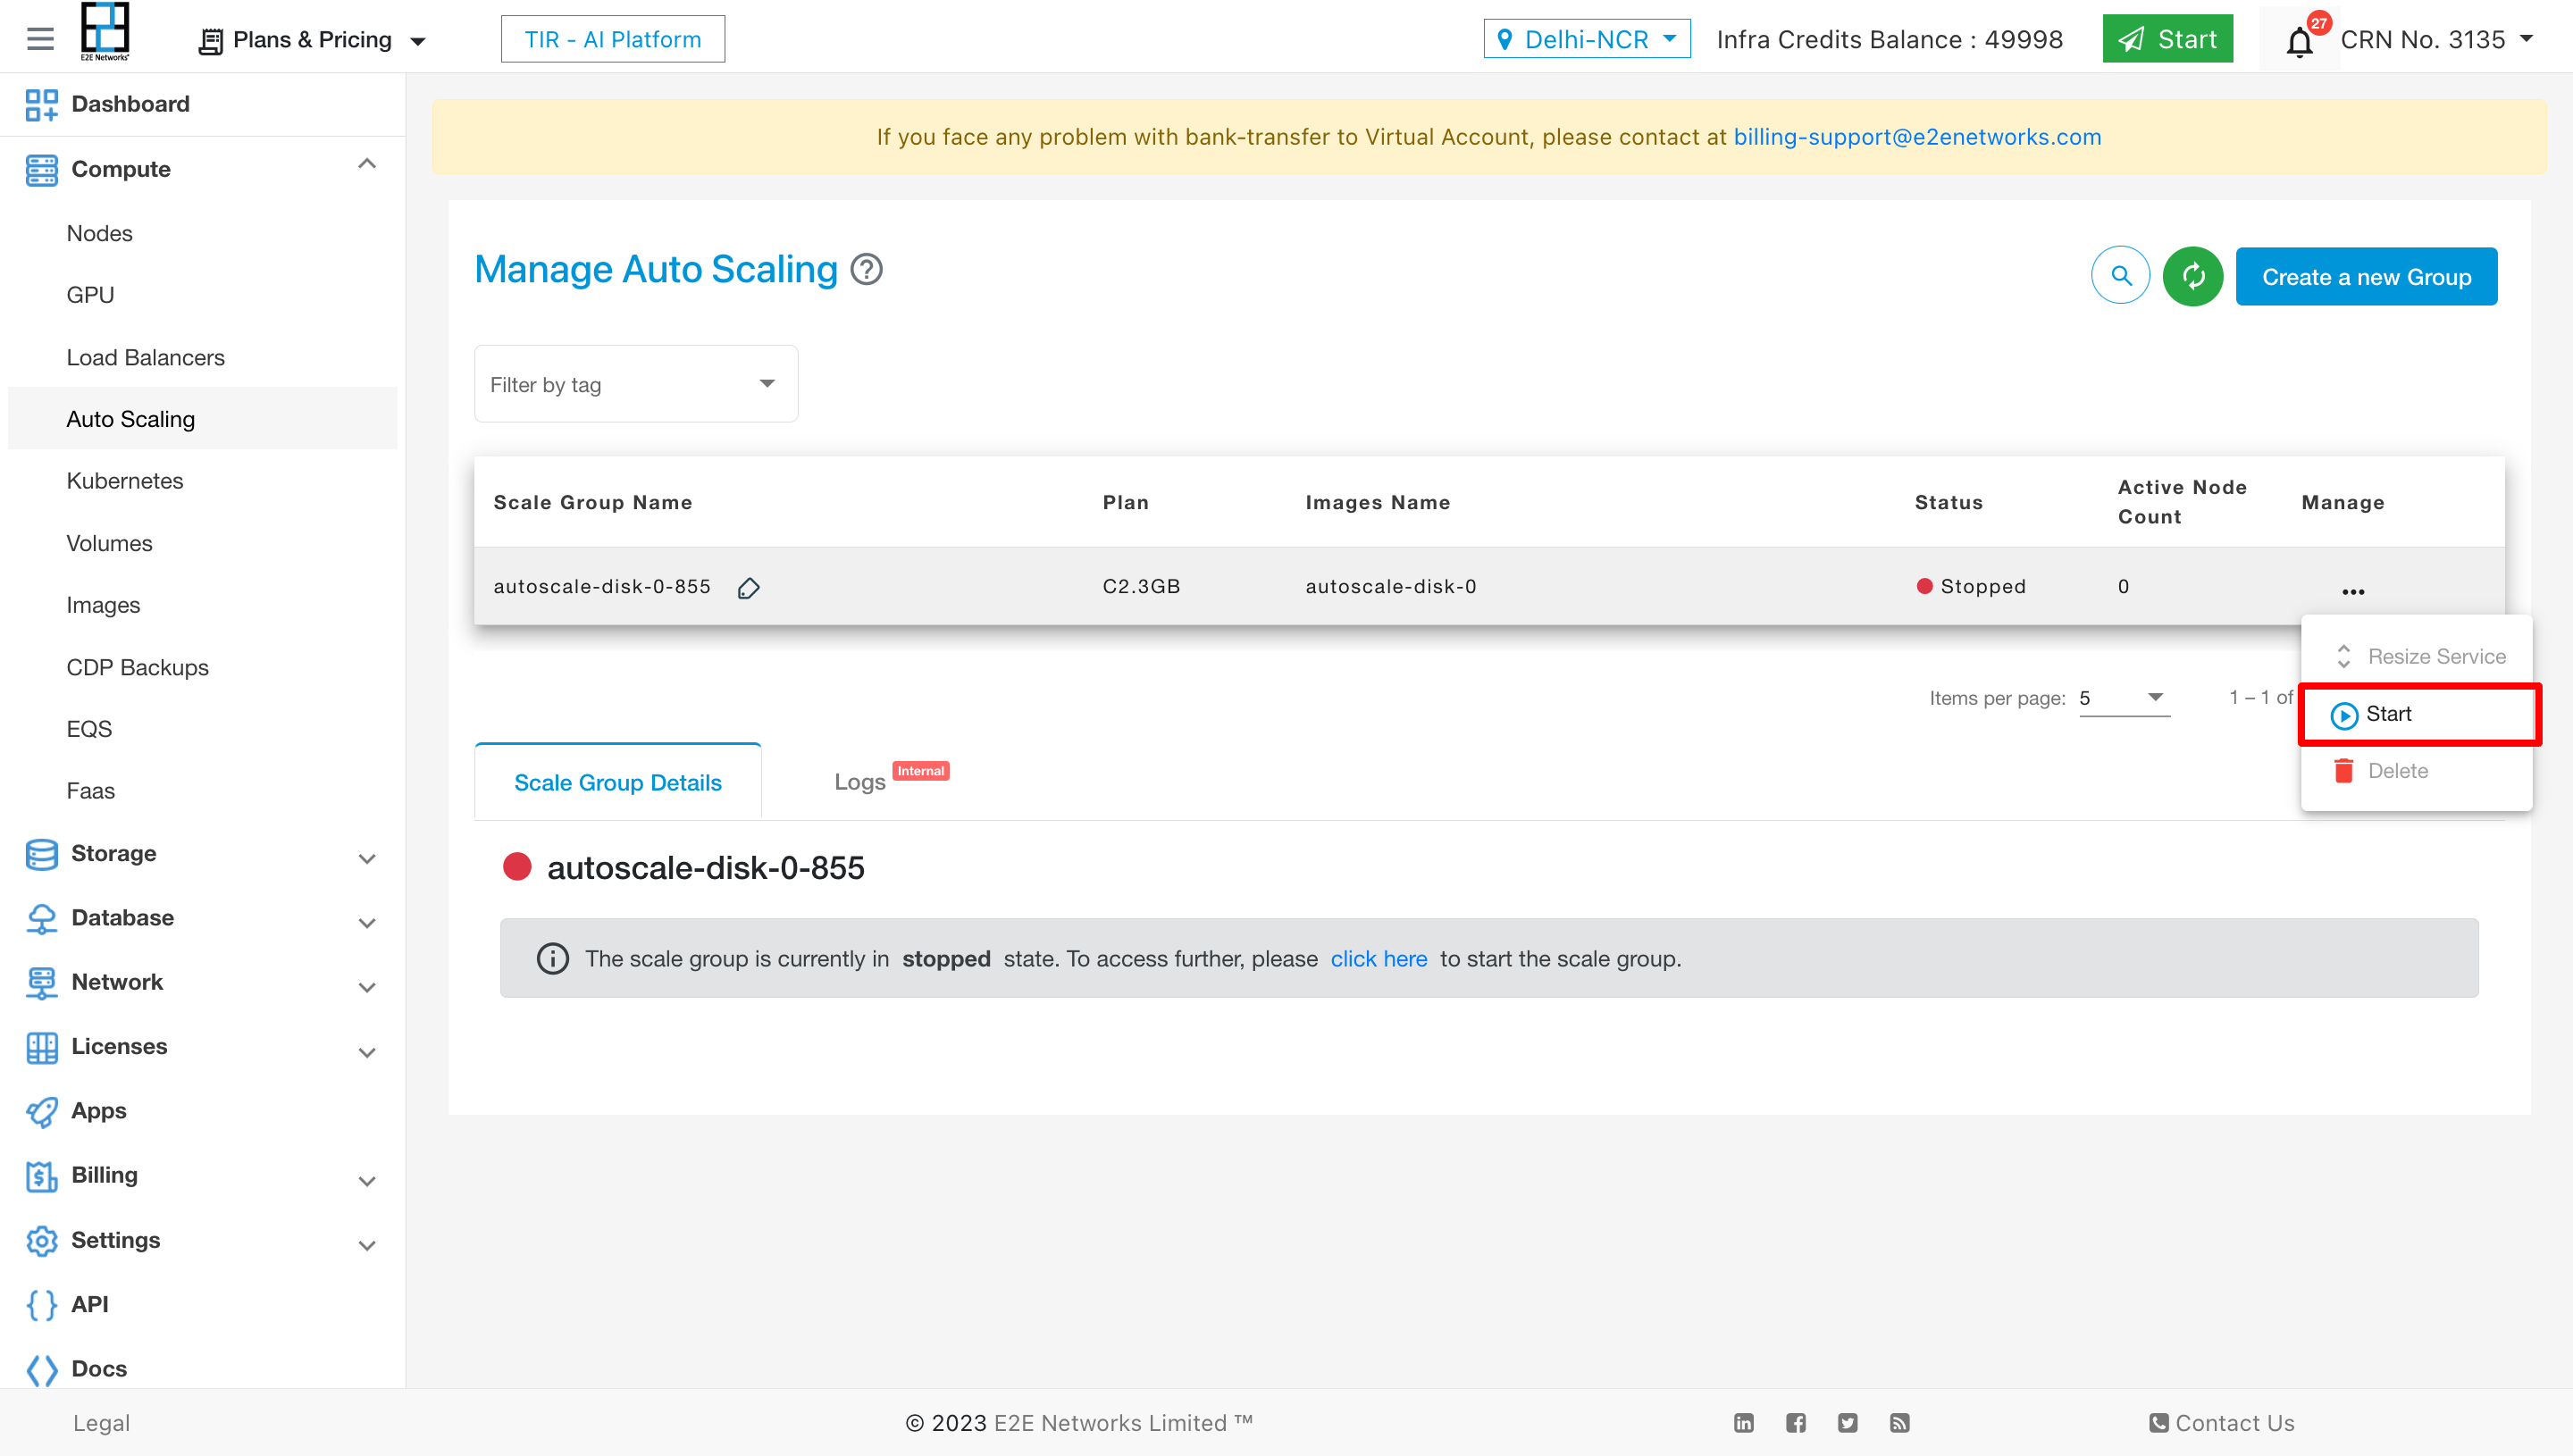
State: The service will be in a running state, maintaining the same configuration as before, with desired nodes set to the minimum node count specified.
Billing: Billing for the service resumes immediately upon starting, allowing for seamless operation with updated configurations.
Conclusion
Utilizing the start and stop actions provides users with the ability to efficiently manage their autoscaling service, controlling costs and resources effectively. For further assistance or inquiries, please reach out to our support team.
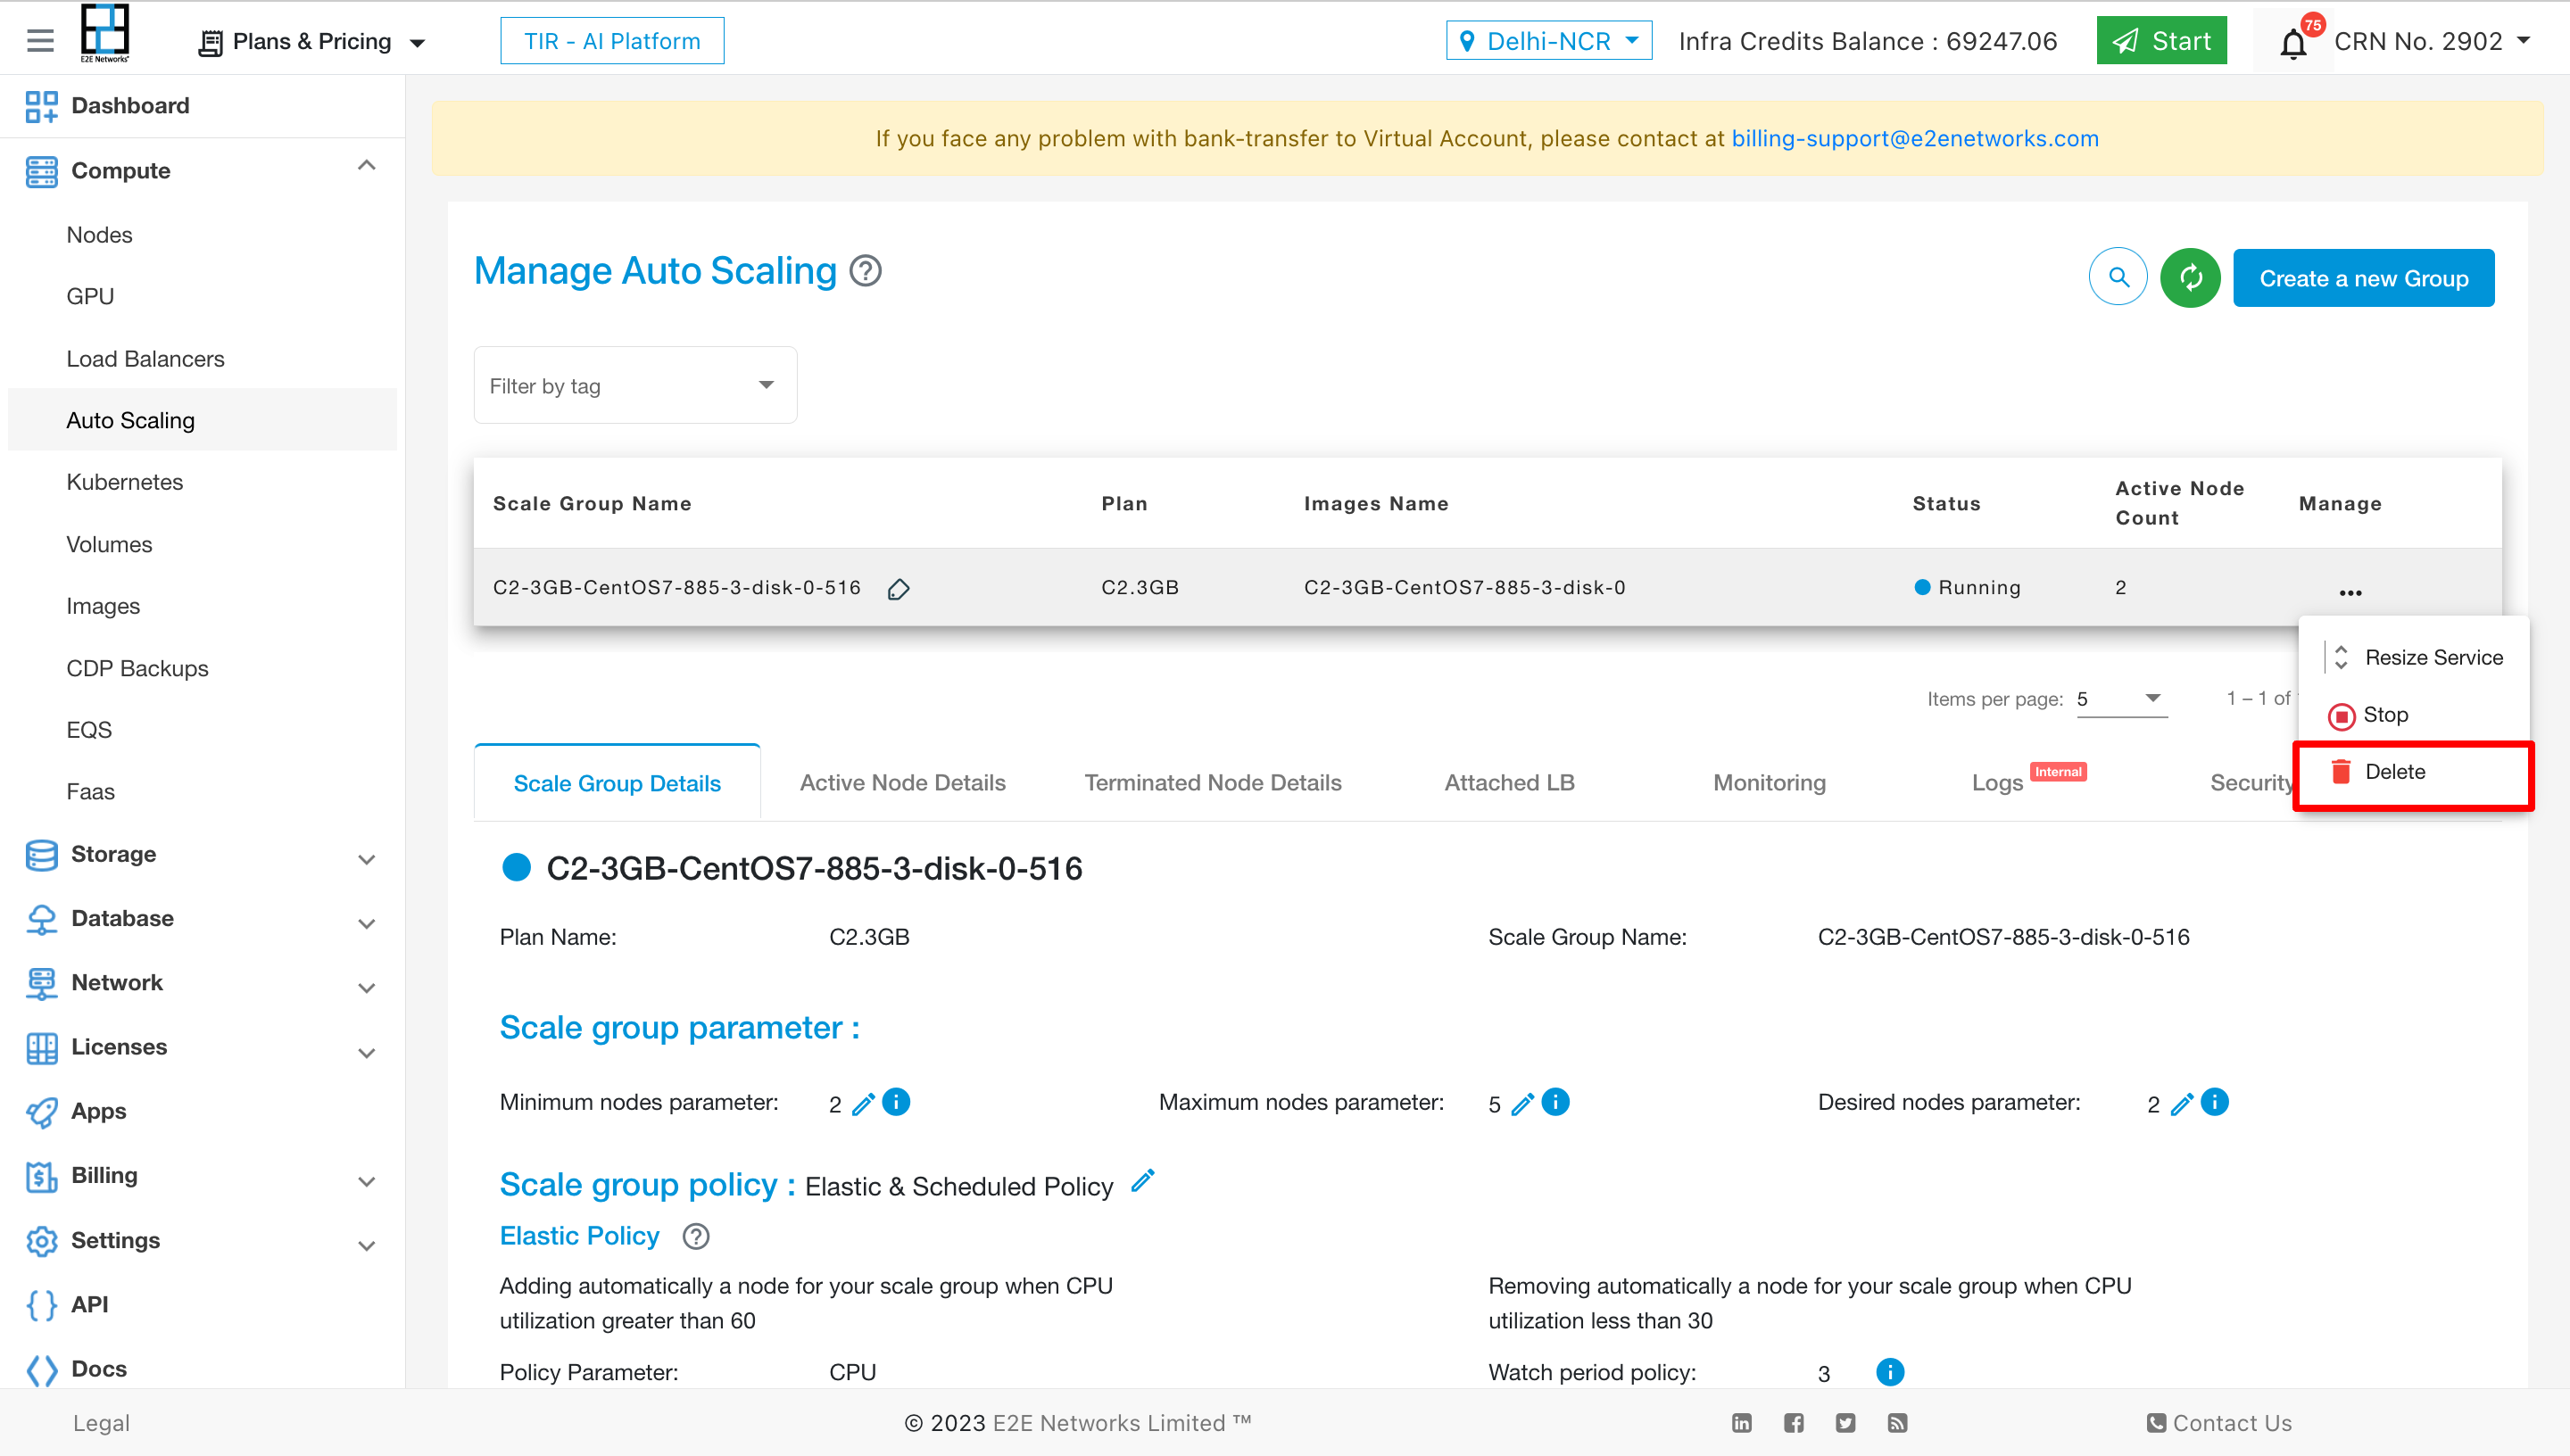
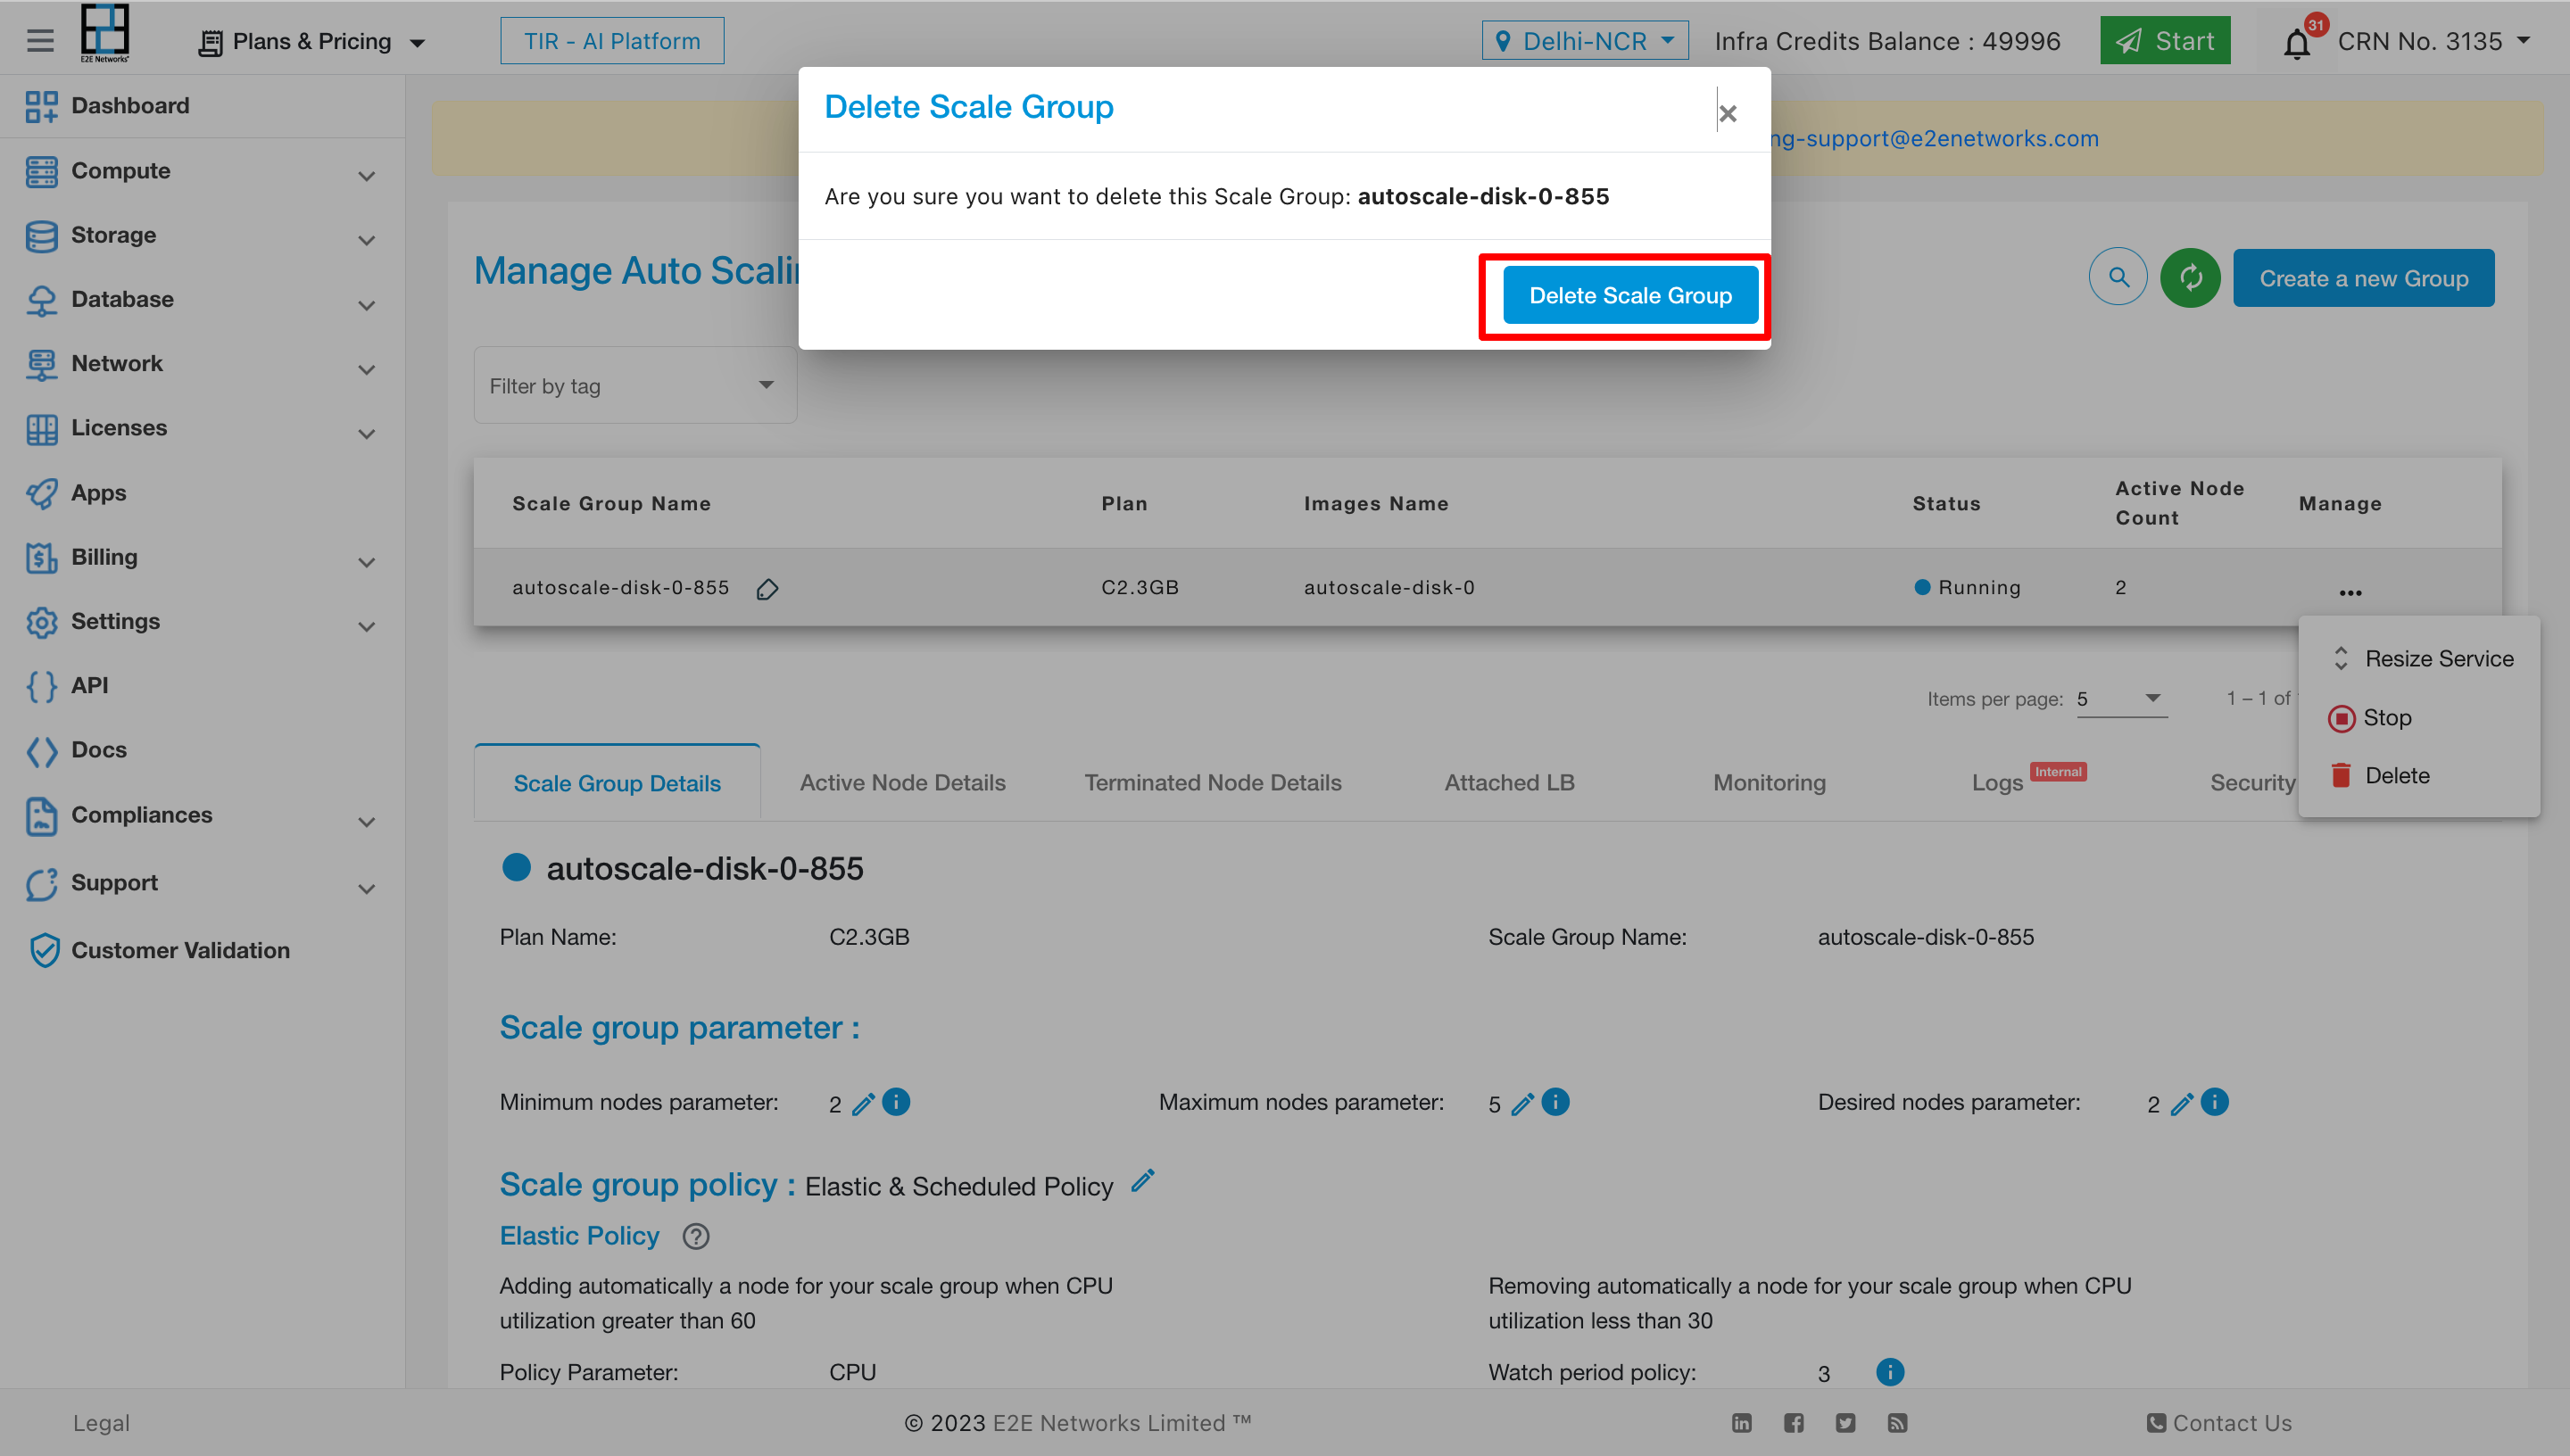
Delete
To delete the service click on “Delete” button.
Edit & Update Auto Scale
To edit the Scale groups details like parameters & policies then click on edit icon.
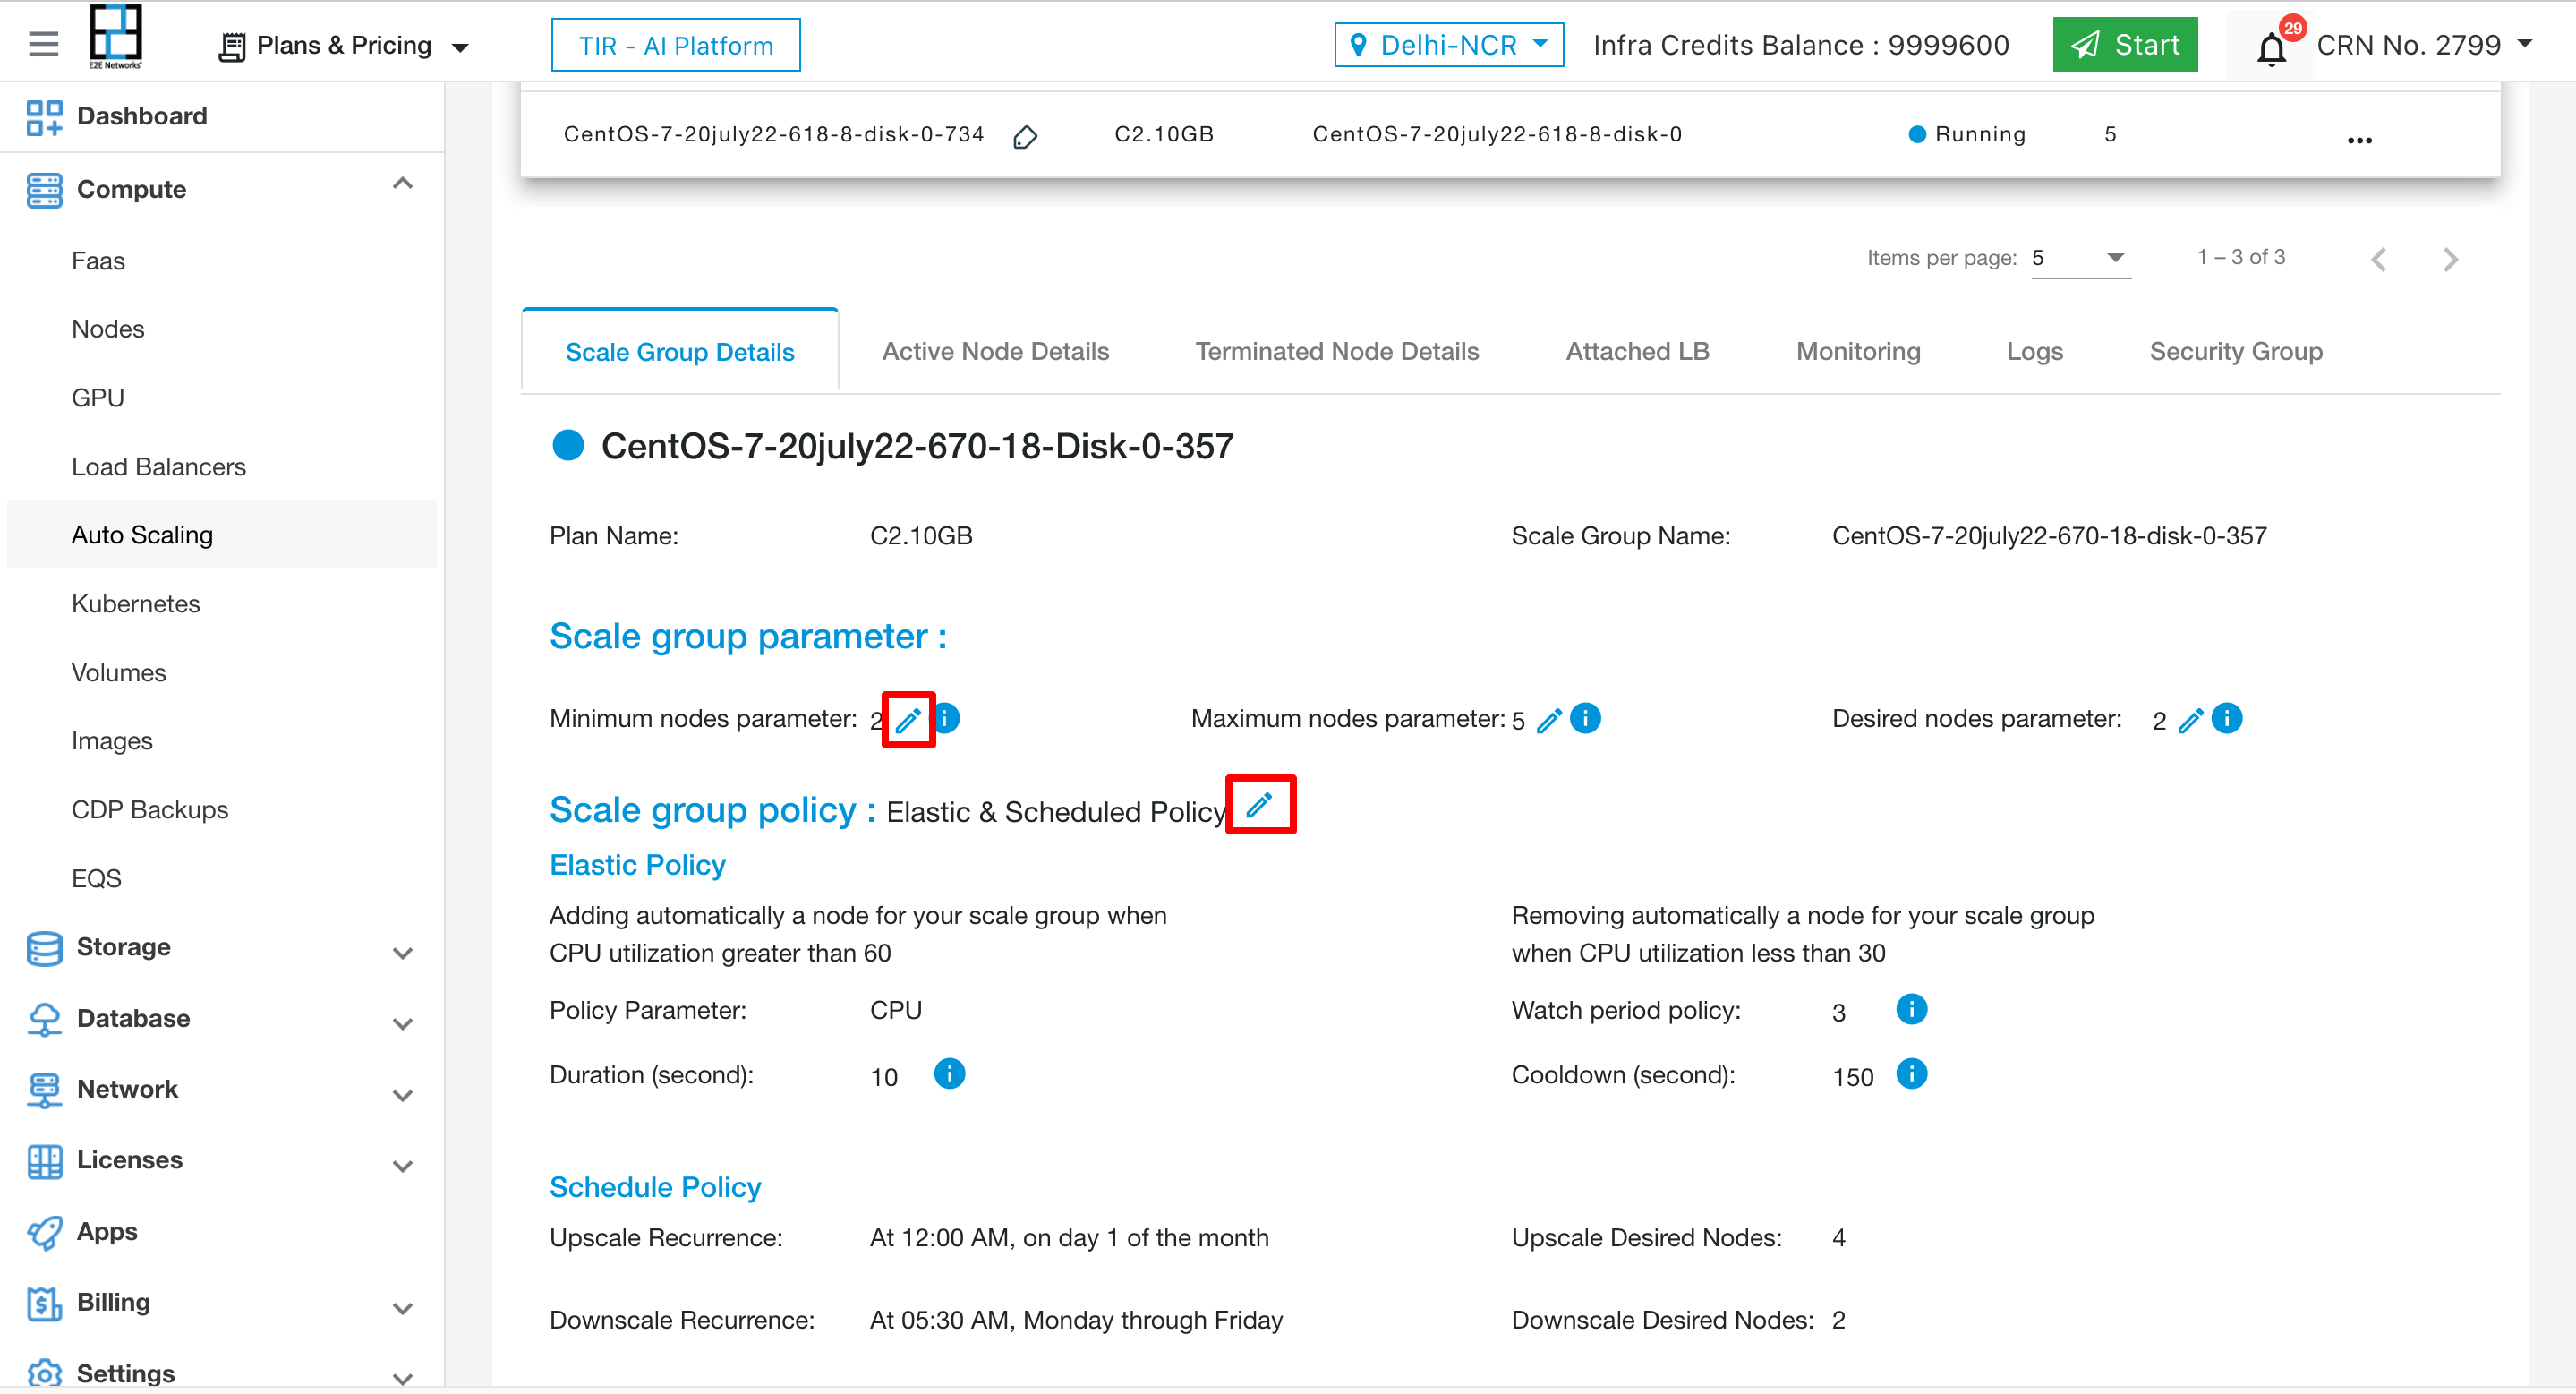
To edit the Scale group prarameters click on edit icon.
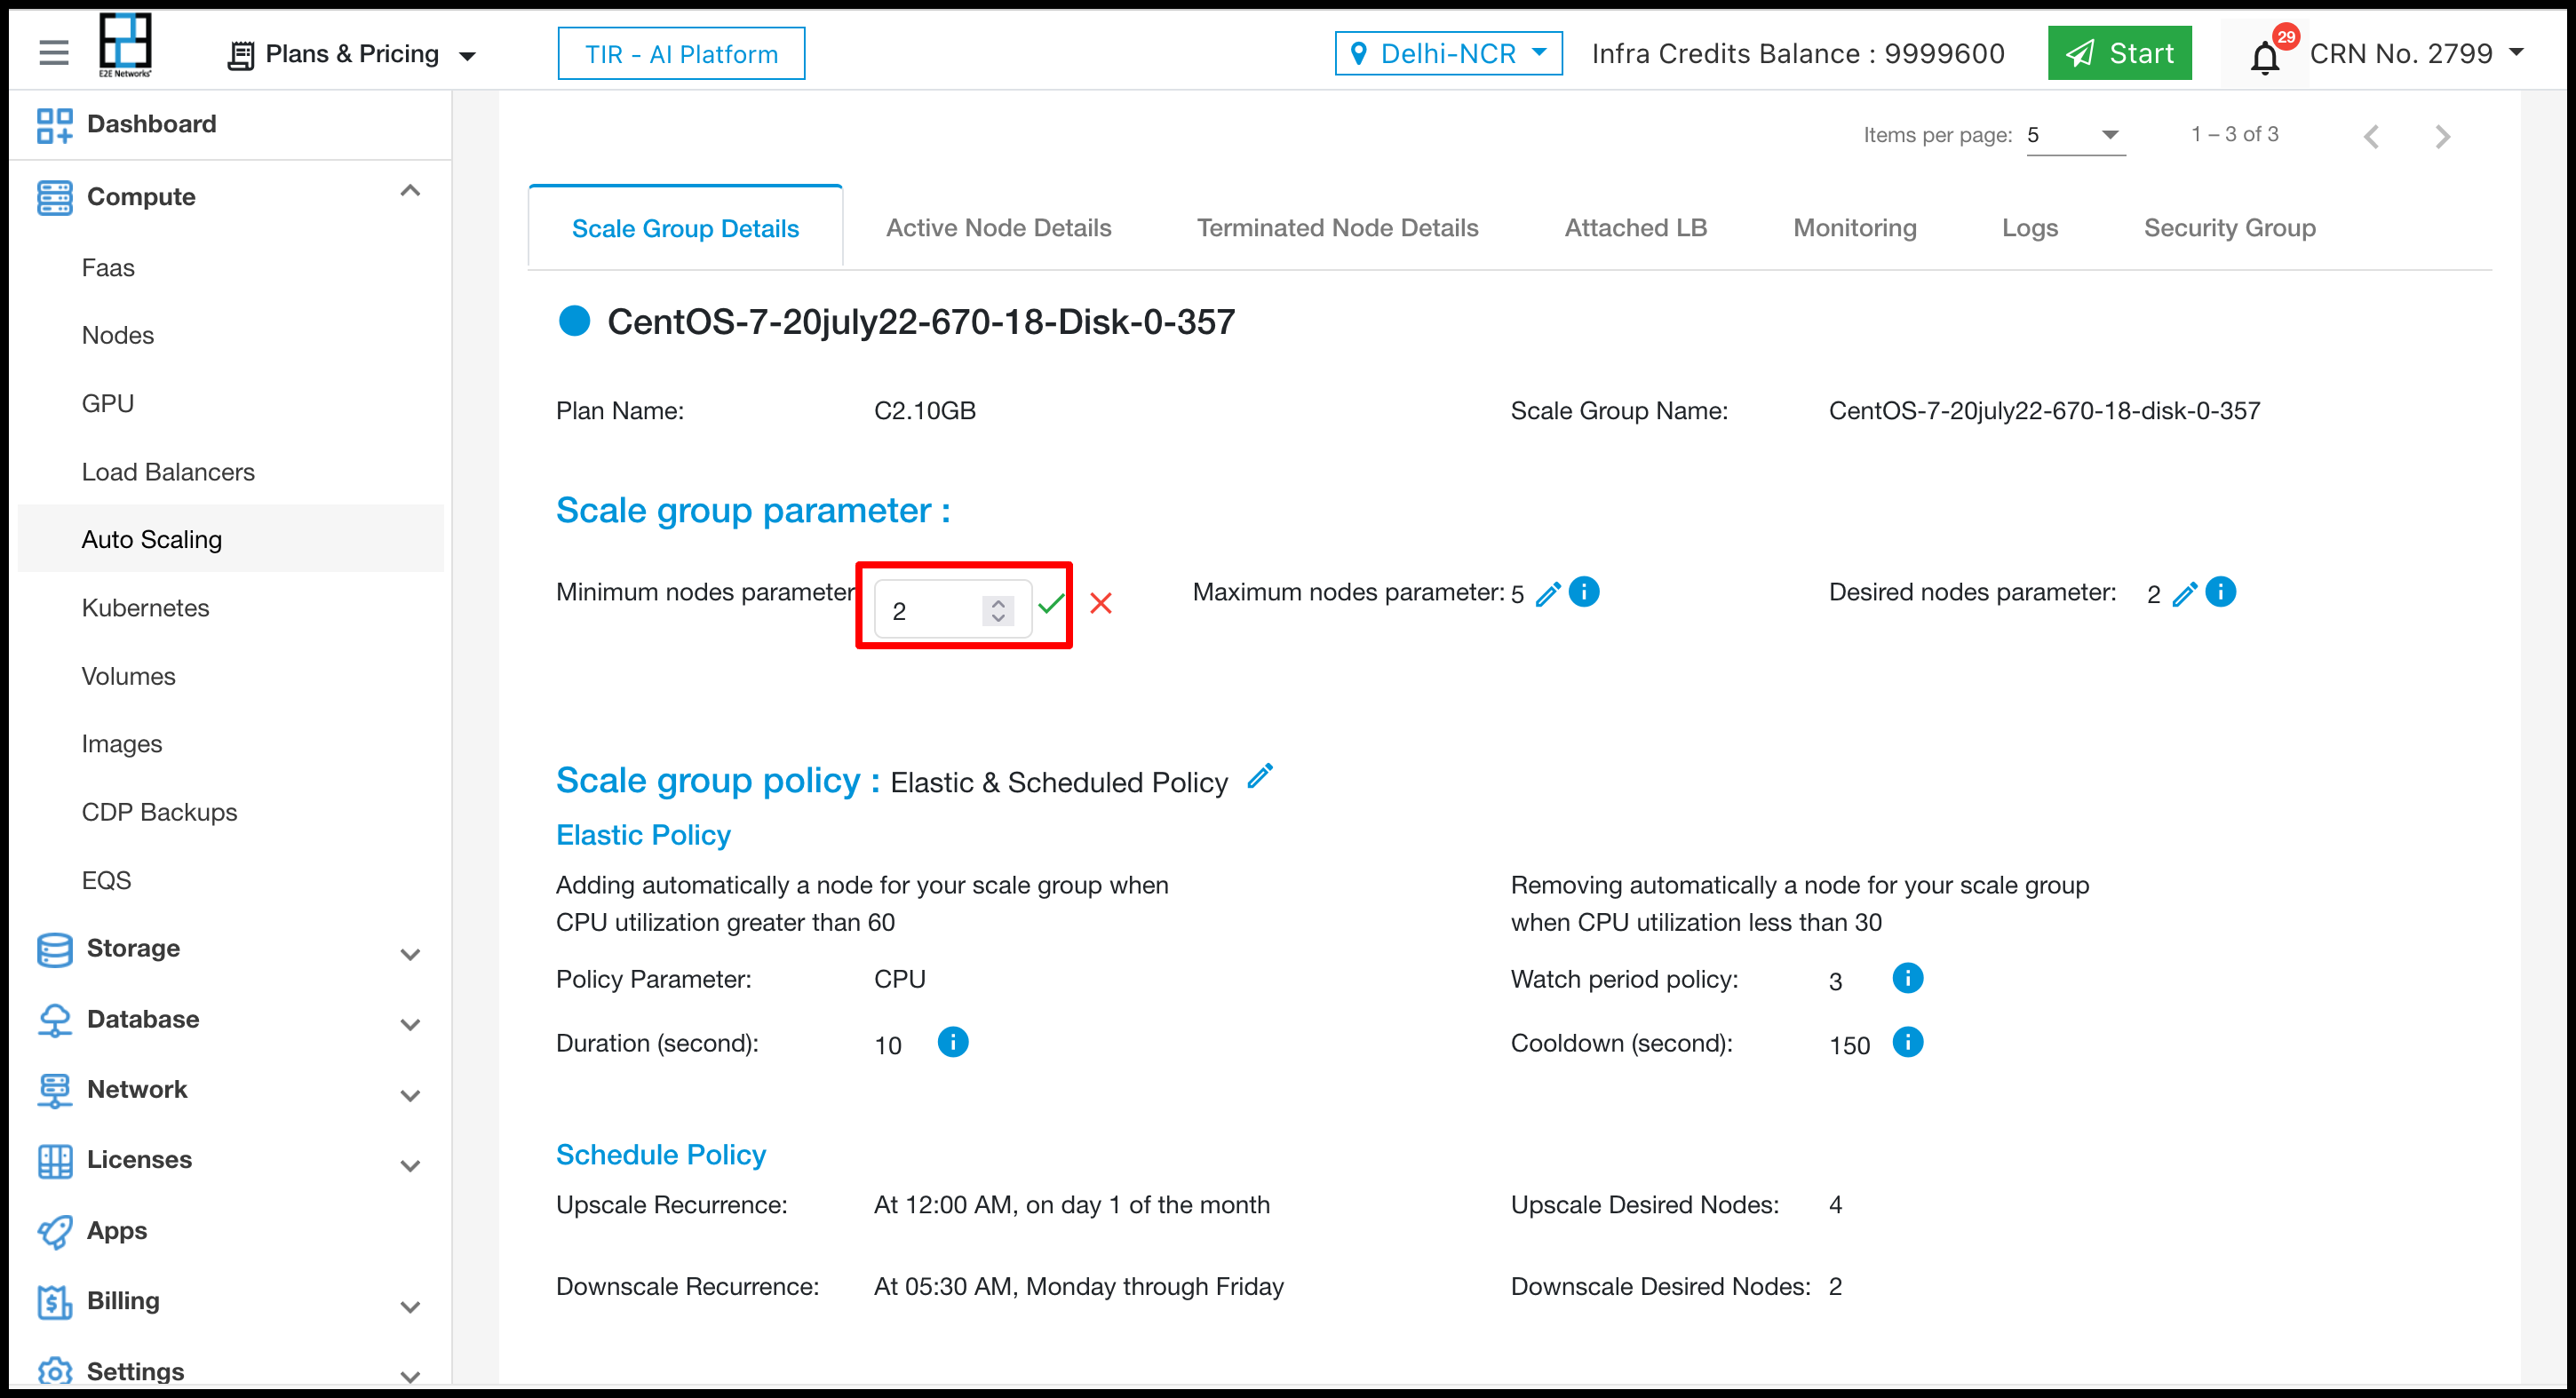
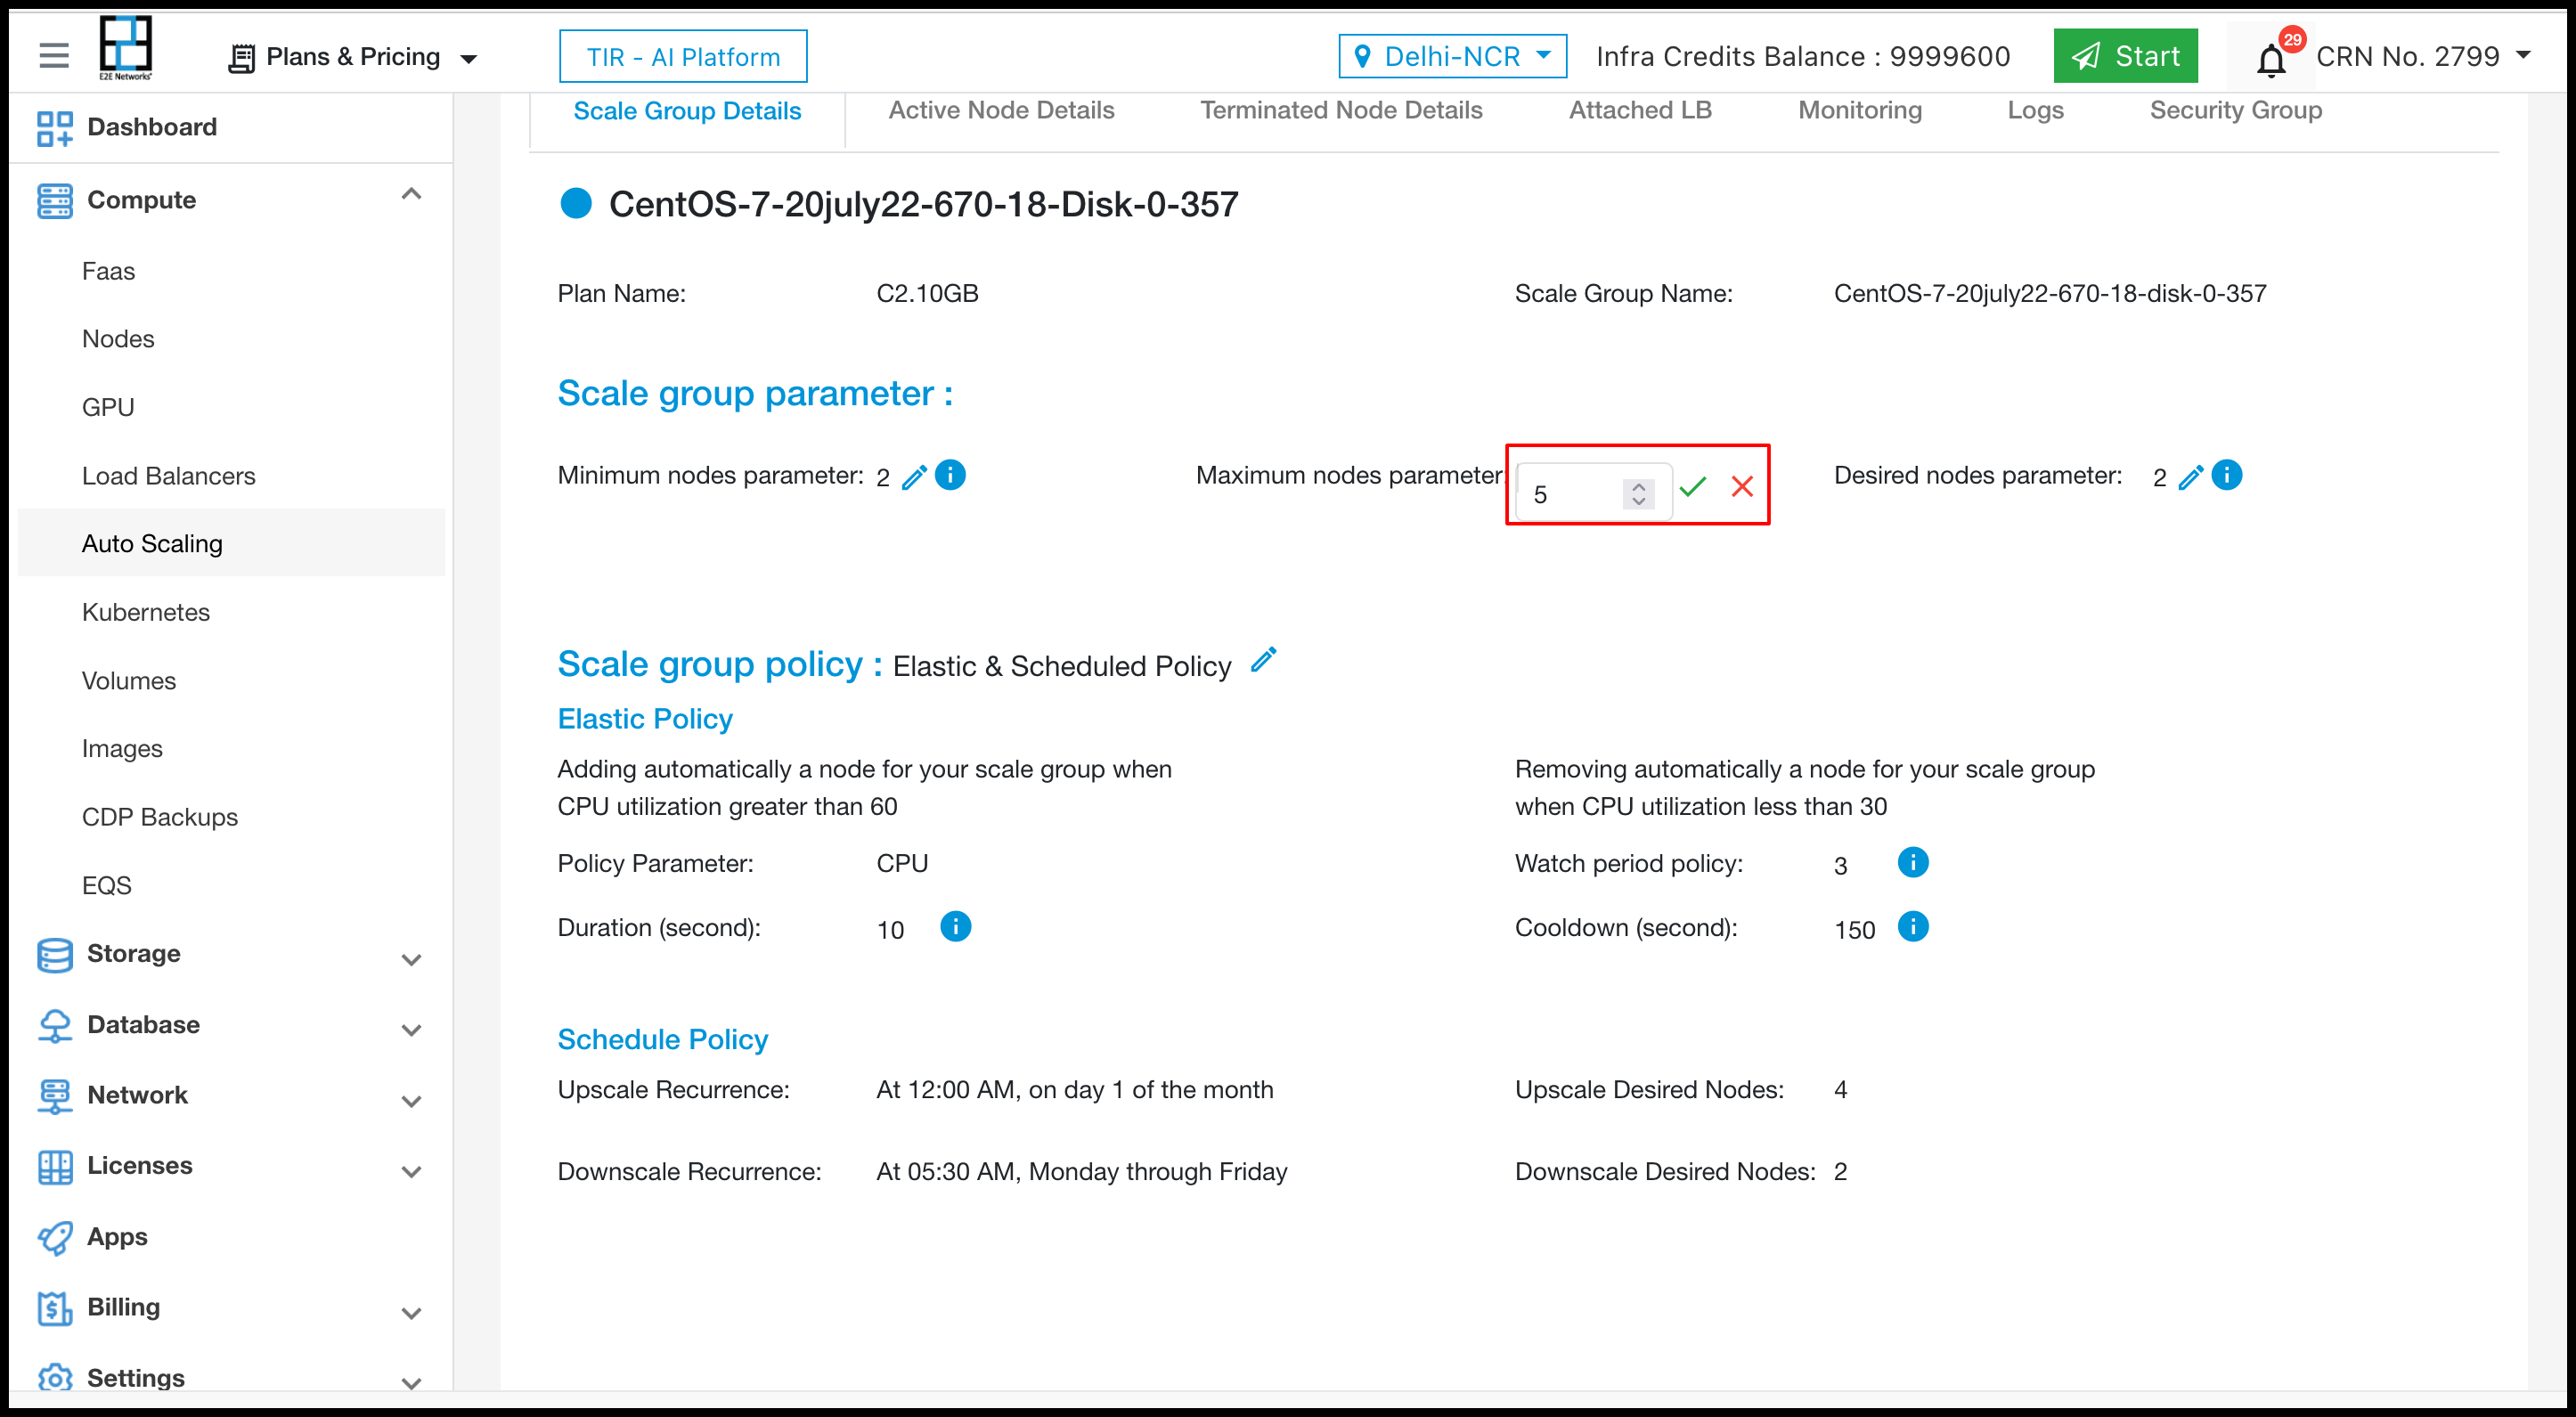
After doing changes click on right icon to update the scale group parameter.
To edit the Scale group policy click on edit icon.
To select Elastic policy click on edit icon and select from dropdown.
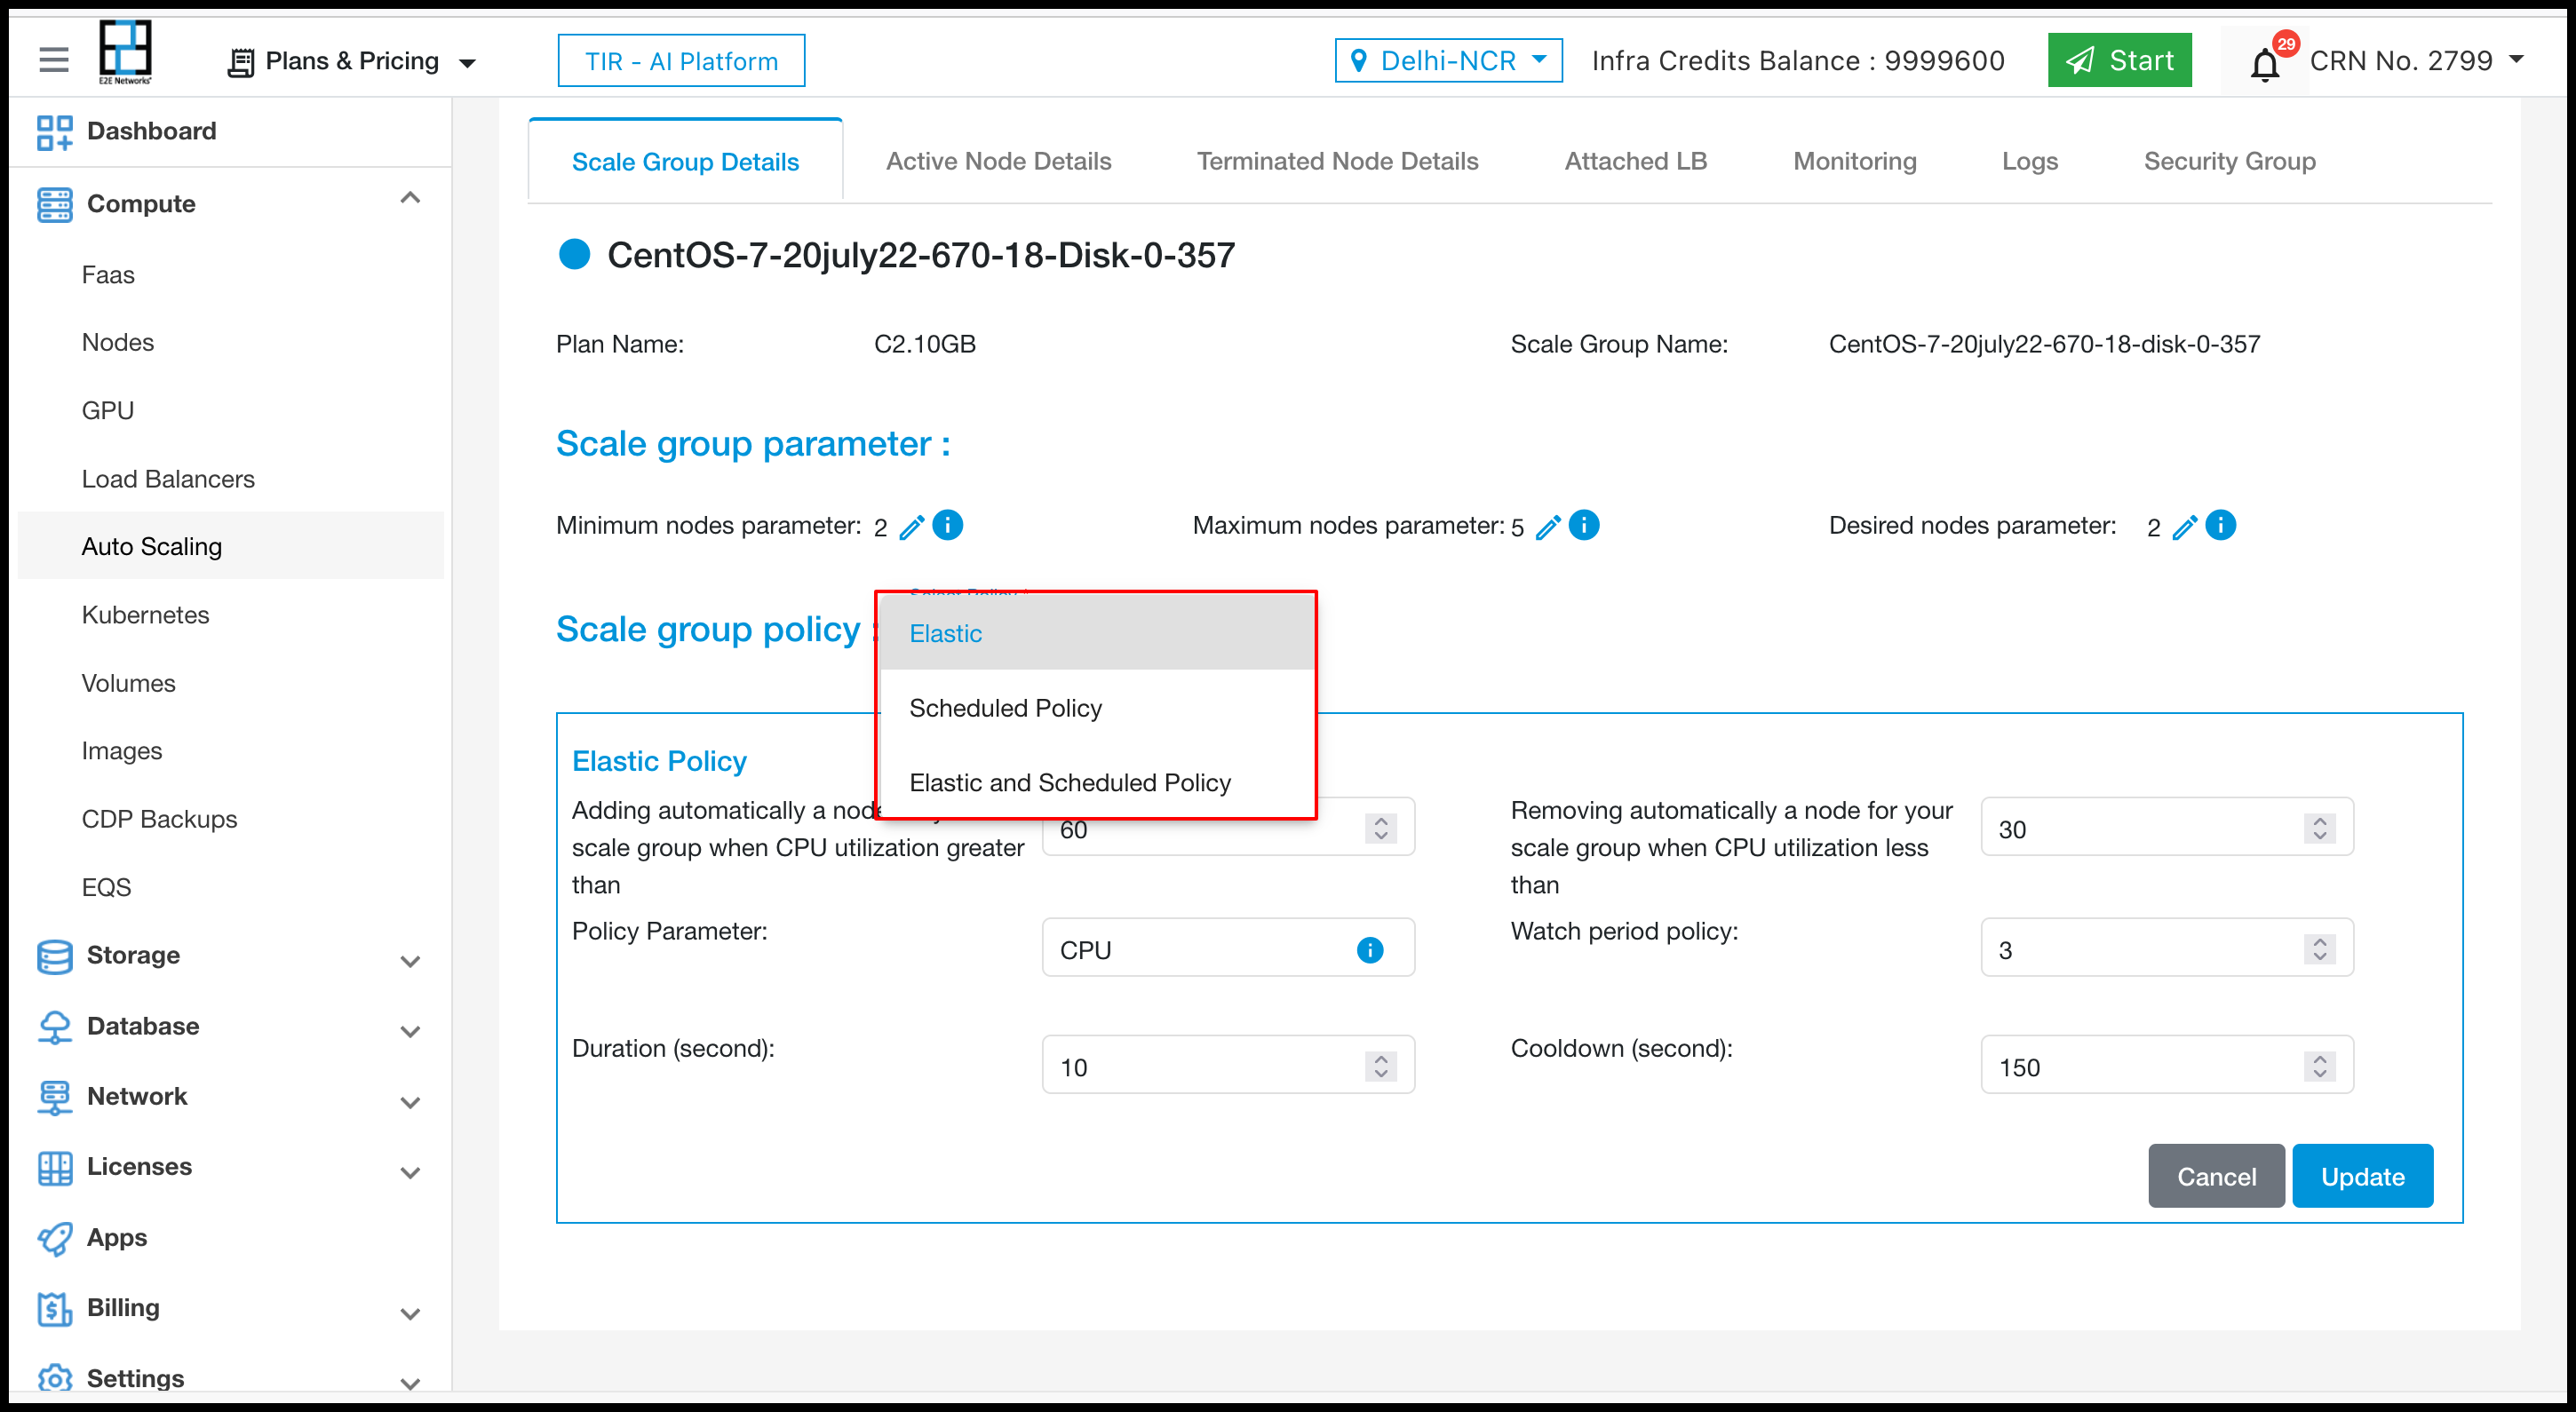
After selcting Elastic policy then want to change in CPU utilisation, watch period, duration & cooldown.
After doing changes click on update button.
To select Scheduled policy click on edit icon and select from dropdown.
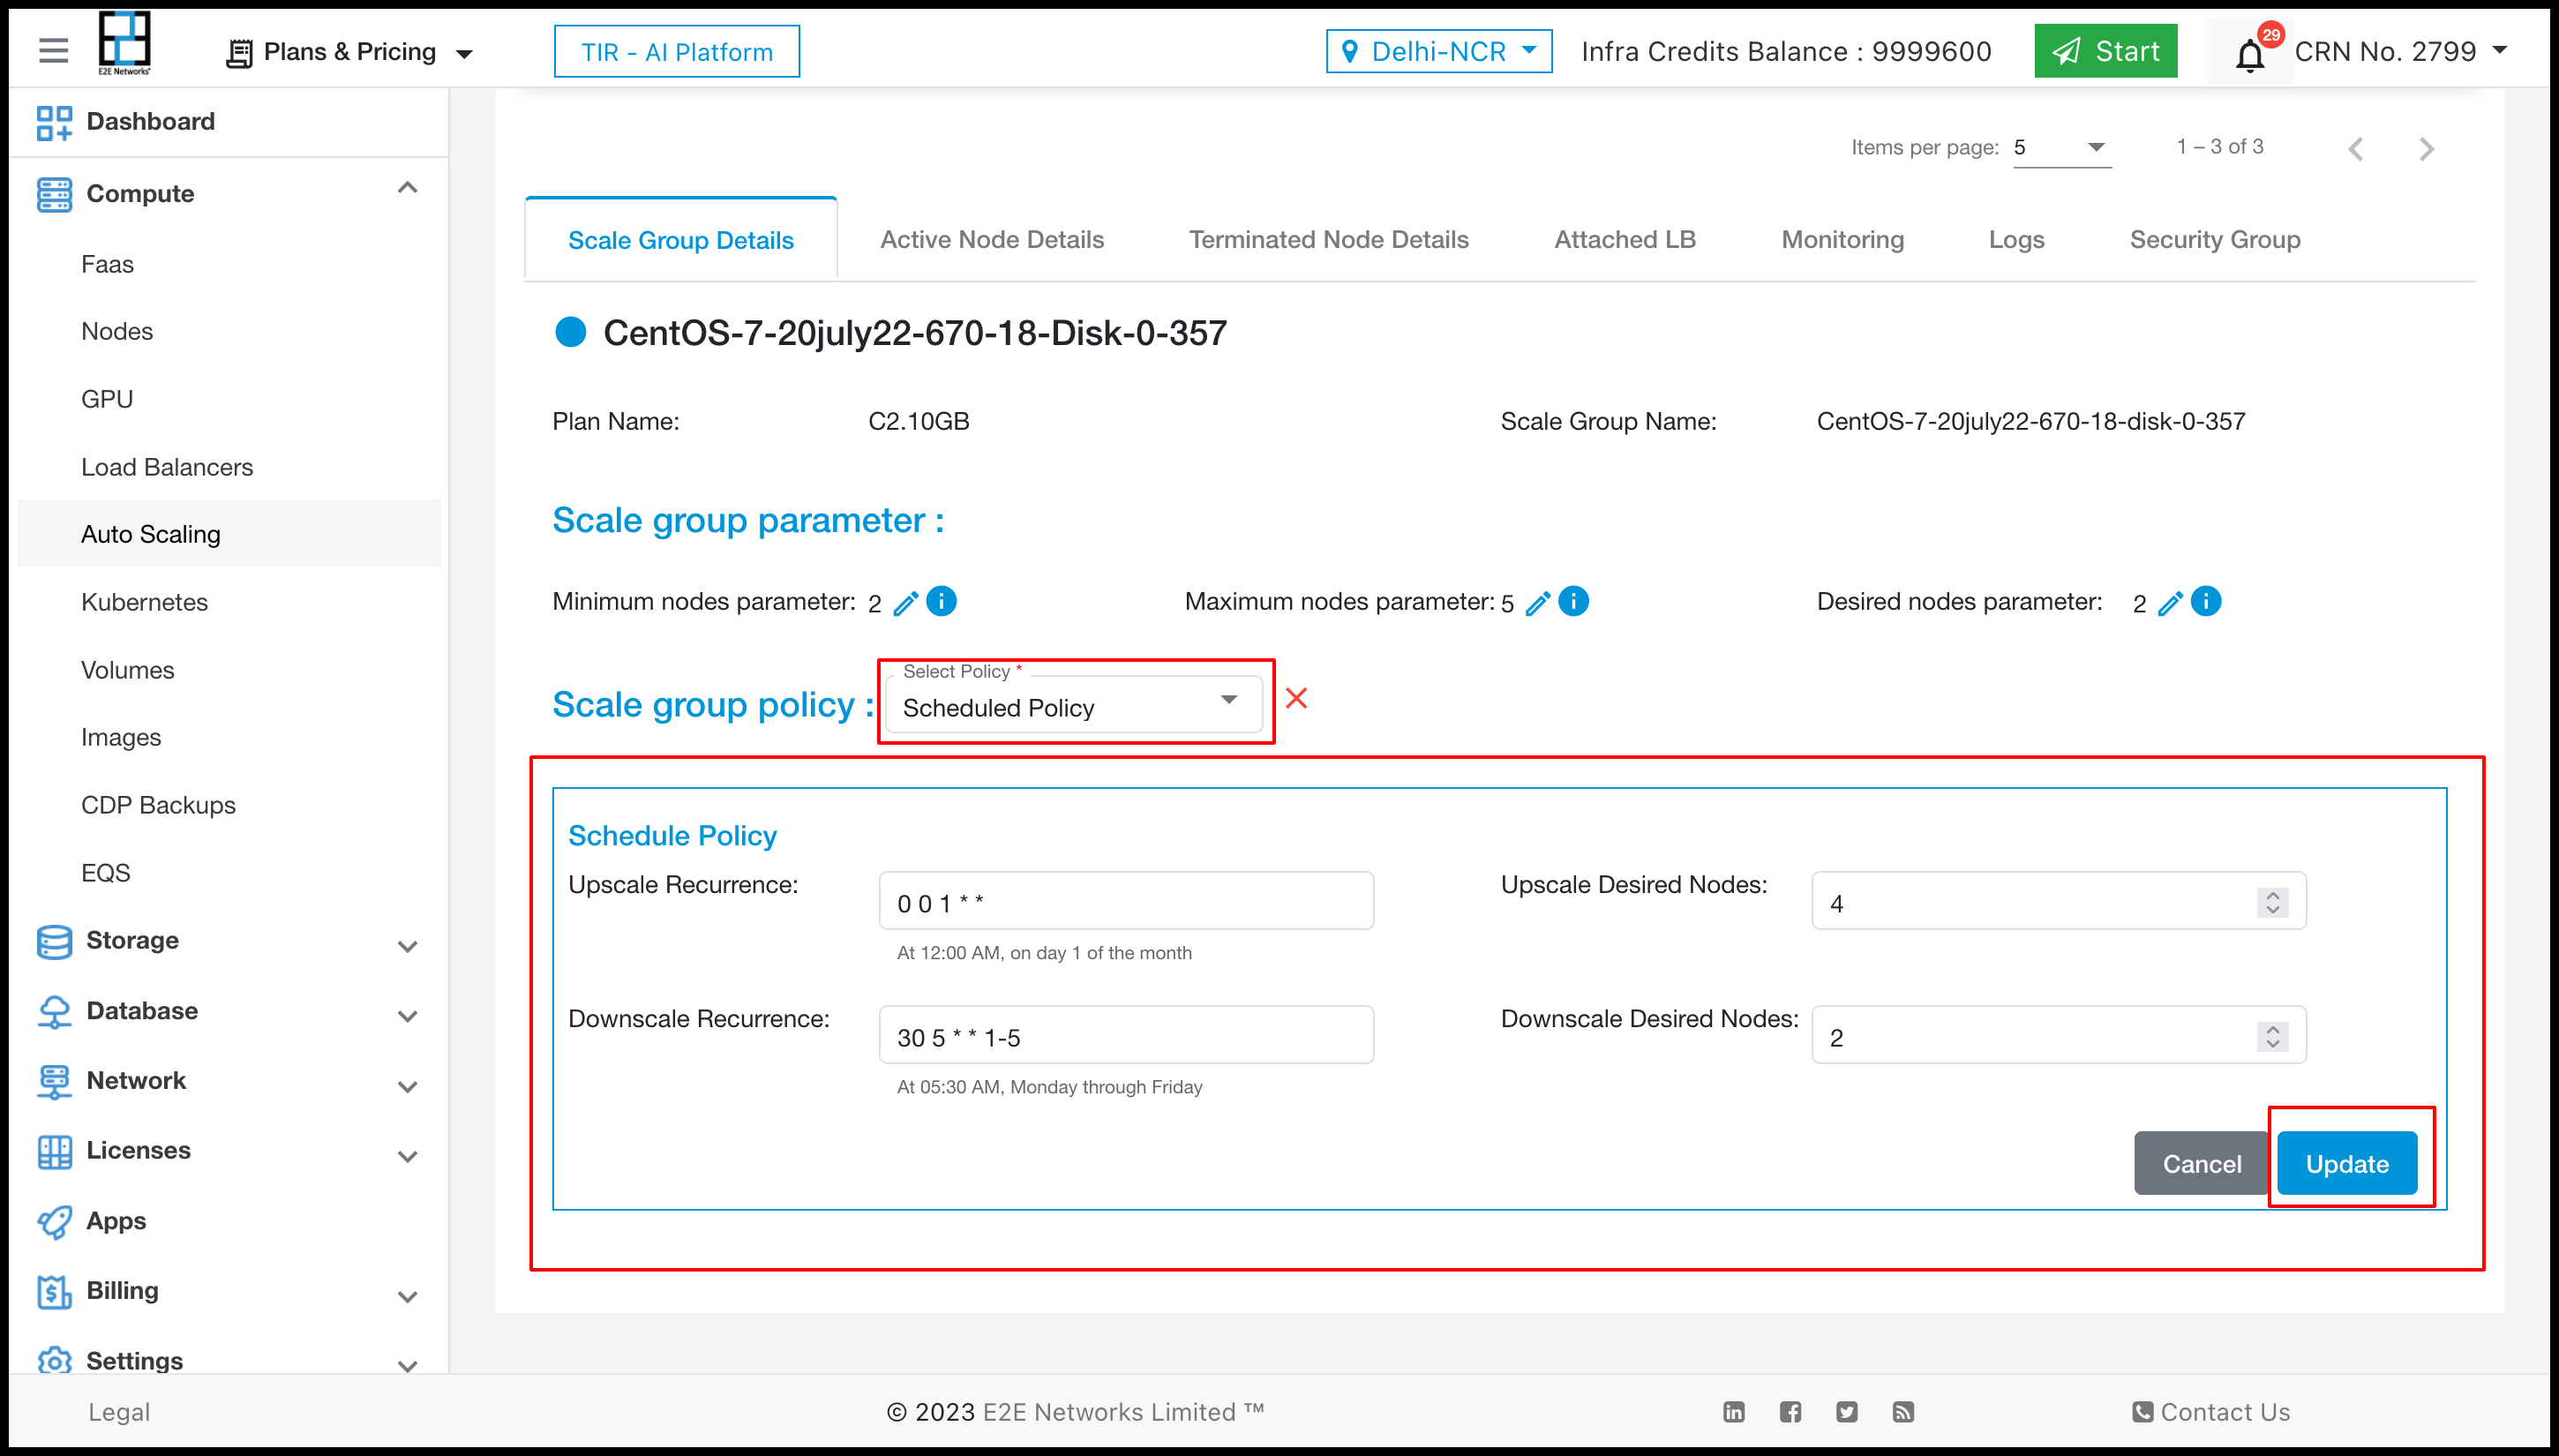
After selecting Scheduled policy then want to change in Upscale Recurrence, Upscale Desired Nodes etc.
After doing changes click on update button.
To select both policy i.e. Elastic & Scheduled policy click on edit icon and select from dropdown.
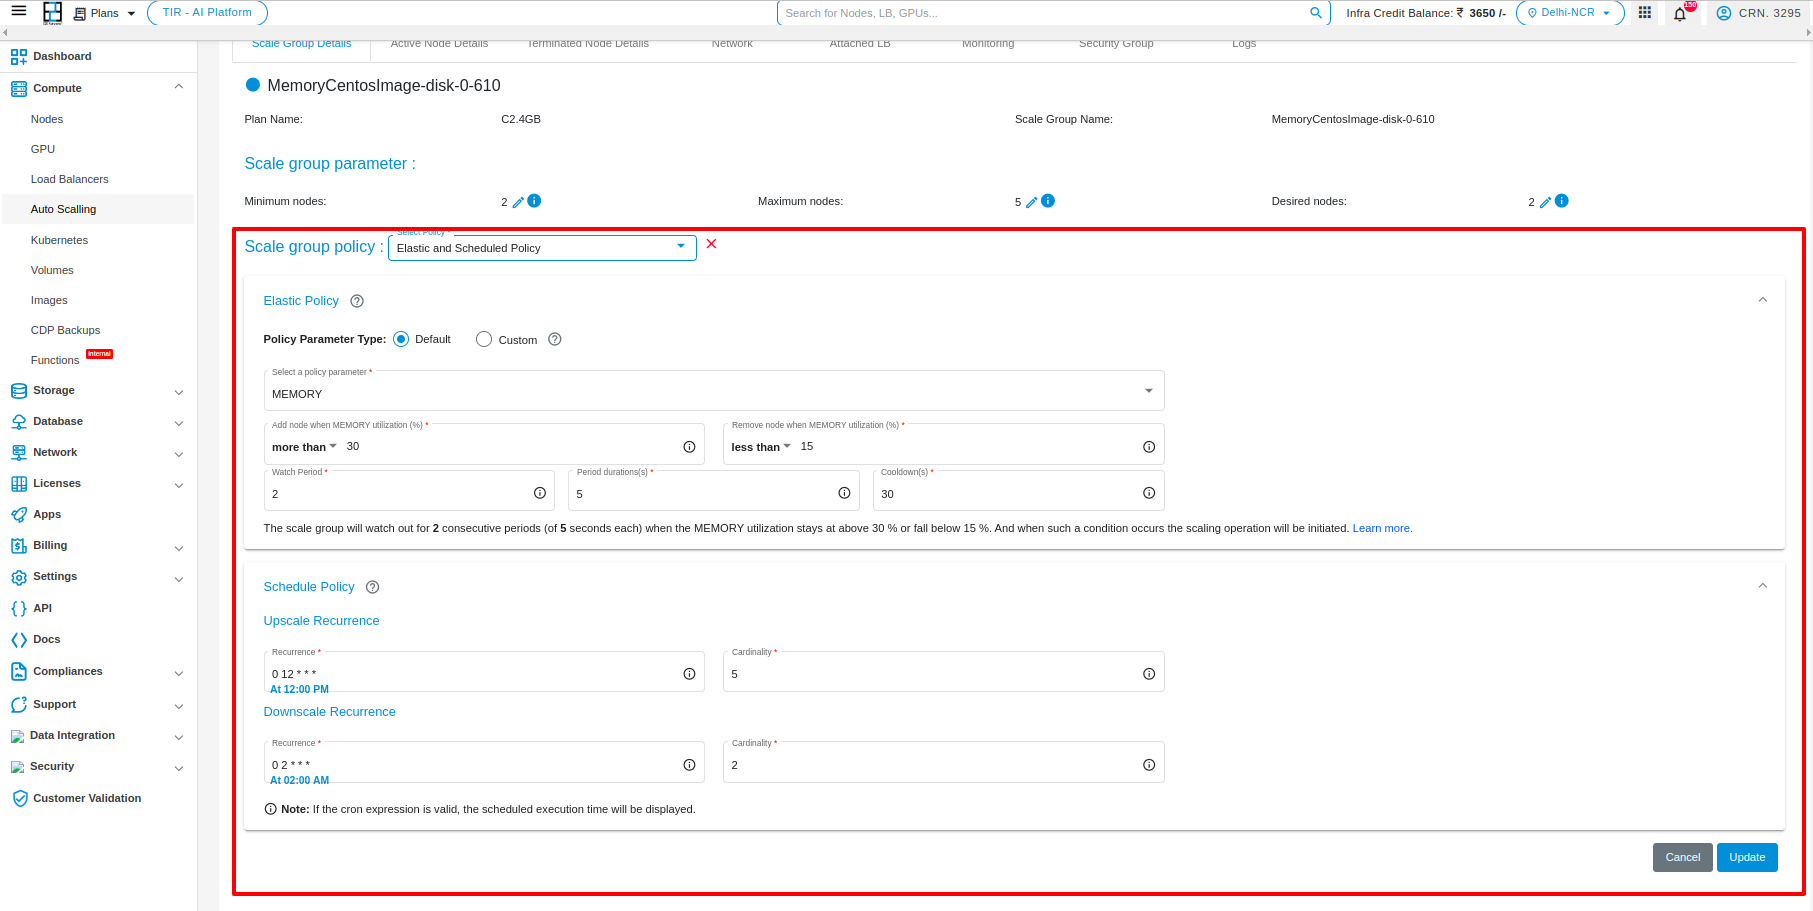
After doing changes in the form click on update button
Note
Deleting the saved image is not allowed when it is associated with a Scale group. You need to first terminate the associated scale group to delete this saved image.