Monitoring Stack
Prometheus is an open-source monitoring and alerting tool. It is designed to collect metrics from different sources, store them efficiently, and enable querying and visualization of these metrics for monitoring purposes.
Data Collection, Metrics Storage, Query Language, Alerting, Service Discovery, Visualizations, Exporters are some key features of prometheus
The kube-prometheus-stack is pre-configured to gather metrics from all Kubernetes components because it is designed for cluster monitoring. It also provides a standard set of dashboards and alerting rules. Many of the relevant dashboards and alerts originate from the kubernetes-mixin project.
- The kube-prometheus-stack consists of three main components:
Prometheus Operator, for spinning up and managing Prometheus instances in your DOKS cluster.
Grafana, for visualizing metrics and plot data using stunning dashboards.
Alertmanager, for configuring various notifications (e.g. PagerDuty, Slack, email, etc) based on various alerts received from the Prometheus main server.
When it comes to gathering metrics, Prometheus uses a pull model, therefore it expects that the service in question would expose a /metrics endpoint for scraping. A time series database is used to store the data points for each metric that Prometheus retrieves.
Grafana makes it simple to collect data from the Prometheus time series database and plot it using stunning graphs organized into dashboards. The PromQL language can also be used to run queries. You must allocate block storage for both Prometheus and Grafana instances using Persistent Volumes (or PVs) in order to persist all the data (metrics and different settings).
Alerts sent by client programmes like the Prometheus server are handled by the Alertmanager component. It handles the deduplication, grouping, and routing to the appropriate receiver integration, such as email, PagerDuty, or Slack. Additionally, it handles alert inhibition and silencing.
Please make sure to visit the official documentation page for each of the components to learn more:
Prometheus, to learn more about all the available features, as well as various configuration options.
Prometheus Operator, which provides useful information on how to use the operator.
Alertmanager, to learn more about Alertmanager and integrations with various notification platforms.
Getting Started after deploying kubernetes monitoring stack
Please refer to this document to connect your kubernetes cluster.
Once you have set up your cluster using kubectl, proceed with executing the following commands.
helm repo add jetstack prometheus-community https://prometheus-community.github.io/helm-charts
helm repo update
How to check if Prometheus monitoring stack is running
helm ls -n kube-prometheus-stack

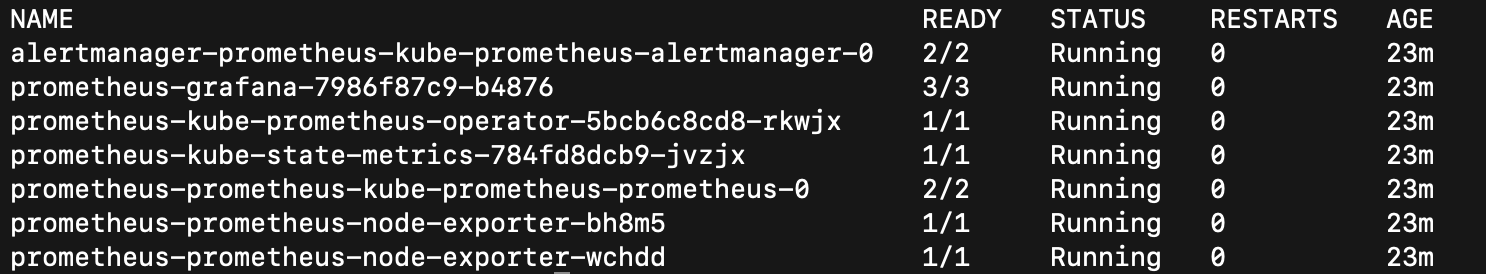
Verify if prometheus stack pods are up and running
kubectl get pods -n kube-prometheus-stack
Accessing Prometheus web panel
You can access Prometheus web console by port forwarding the kube-prometheus-stack-prometheus service:
kubectl port-forward svc/prometheus-kube-prometheus-prometheus 9090:9090 -n kube-prometheus-stack
Next, launch a web browser of your choice, and enter the following URL: http://localhost:9090. To see what targets were discovered by Prometheus, please navigate to http://localhost:9090/targets
Accessing Grafana web panel
You can connect to Grafana by port forwarding the prometheus-grafana service:
kubectl port-forward svc/prometheus-grafana 3000:80 -n kube-prometheus-stack
- Default credentials:
User: admin
Password: prom-operator
Please change your password after first login (Recommended)
Next, launch a web browser of your choice, and enter the following URL: http://localhost:3000. You can take a look around, and see what dashboards are available for you to use from the kubernetes-mixin project as an example, by navigating to the following URL: http://localhost:3000/dashboards?tag=kubernetes-mixin.
Tweaking Helm Chart Values
The kube-prometheus-stack provides some custom values to start with. Please have a look at the values, file from the main GitHub repository (explanations are provided inside, where necessary).
You can always inspect all the available options, as well as the default values for the kube-prometheus-stack Helm chart by running below command
helm show values prometheus-community/kube-prometheus-stack --version 48.6.0
After tweaking the Helm values file (values.yml) according to your needs, you can always apply the changes via helm upgrade command, as shown below:
helm upgrade prometheus prometheus-community/kube-prometheus-stack
--version 48.6.0 --namespace kube-prometheus-stack --values values.yml
If you want to run a service on a public ip then you can edit that specific service with the below command:
kubectl edit svc {service_name} -n kube-prometheus-stack
Change type from ‘ClusterIP’ to ‘LoadBalancer’, the available public ip gets automatically attached to the service. Then you can use the ip and respective port of your choice to access prometheus web panel publicly.
Configuring Service Monitors for Prometheus
To monitor applications in your cluster, you usually define a so called ServiceMonitor CRD. This is a custom resource definition provided by the Prometheus Operator, which helps you in the process of adding new services that need to be monitored.
A typical ServiceMonitor configuration looks like below:
apiVersion: monitoring.coreos.com/v1
kind: ServiceMonitor
metadata:
  name: example-app
  labels:
    team: frontend
spec:
  selector:
    matchLabels:
      app: example-app
  endpoints:
  - port: web
Explanations for the above configuration:
spec.selector.matchLabels.app: Tells ServiceMonitor what application to monitor, based on a label.
spec.endpoints.port: A reference to the port label used by the application that needs monitoring.
The kube-prometheus-stack Helm values file provided in the GitHub marketplace repository, contains a dedicated section (named additionalServiceMonitors) where you can define a list of additional services to monitor. Below snippet is setting up Nginx Ingress Controller monitoring as an example:
additionalServiceMonitors:
  - name: "ingress-nginx-monitor"
  selector:
    matchLabels:
      app.kubernetes.io/name: ingress-nginx
  namespaceSelector:
    matchNames:
      - ingress-nginx
  endpoints:
    - port: "metrics"
After adding required services to monitor, you need to upgrade the stack via the helm upgrade command, in order to apply the changes:
 helm upgrade prometheus prometheus-community/kube-prometheus-stack
 --version 48.6.0 --namespace kube-prometheus-stack --values values.yml

You can also check the full list of available `CRDs <https://github.com/prometheus-operator/prometheus-operator#customresourcedefinitions>`_ which you can use to control the
Prometheus Operator, by visiting the official GitHub documentation page
Upgrading Kubernetes Prometheus Stack
You can check what versions are available to upgrade, by navigating to the kube-prometheus-stack official releases page from GitHub. Alternatively, you can also use ArtifactHUB, which provides a more rich and user friendly interface.
helm upgrade prometheus prometheus-community/kube-prometheus-stack
--version <KUBE_PROMETHEUS_STACK_NEW_VERSION> --namespace kube-prometheus-stack
--values <YOUR_HELM_VALUES_FILE>

Replace KUBE_PROMETHEUS_STACK_NEW_VERSION with appropriate version


Replace YOUR_HELM_VALUES_FILE with your appropriate values file

See `helm upgrade <https://helm.sh/docs/helm/helm_upgrade/>`_ for command documentation.


Also, please make sure to check the official recommendations for
various `upgrade paths <https://github.com/prometheus-community/helm-charts/tree/main/charts/kube-prometheus-stack#upgrading-chart>`_, from an existing release to a new major
version of the Prometheus stack.
Uninstalling Kubernetes Prometheus Stack
helm uninstall prometheus -n kube-prometheus-stack
To delete namespace please use below command:
kubectl delete ns kube-prometheus-stack
CRDs created by this chart are not removed by default and should be manually cleaned up:
kubectl delete crd alertmanagerconfigs.monitoring.coreos.com
kubectl delete crd alertmanagers.monitoring.coreos.com
kubectl delete crd podmonitors.monitoring.coreos.com
kubectl delete crd probes.monitoring.coreos.com
kubectl delete crd prometheusagents.monitoring.coreos.com
kubectl delete crd prometheuses.monitoring.coreos.com
kubectl delete crd prometheusrules.monitoring.coreos.com
kubectl delete crd scrapeconfigs.monitoring.coreos.com
kubectl delete crd servicemonitors.monitoring.coreos.com
kubectl delete crd thanosrulers.monitoring.coreos.com